UK Emissions Trading Scheme: Business and Regulations Impact Assessment (BRIA)
This Business and Regulatory Impact Assessment (BRIA) covers the potential impacts on Scottish businesses due to upcoming changes to the UK Emissions Trading Scheme (ETS).
4. Options
4.1 Options Development
The Authority examined a range of options for each of the policy proposals set out in the consultation. Full details are set out in the “Developing the UK Emissions Trading Scheme” consultation, the Authority Government Response to the consultation and the UK ETS Impact Assessment.
4.1.1 Net zero consistent cap
The Authority considered three options when deciding on the cap trajectory:
i) Do nothing.
ii) A Net Zero Strategy consistent cap.
iii) Follow the CCC’s recommendations for the UK ETS cap.
Option i) was used as our counterfactual for these changes. It was ruled out as the current UK ETS cap is inconsistent with net zero targets (i.e. It allows for a higher level of traded sector emissions than would align with a pathway to our net zero targets).
Option ii) is the preferred approach as it incentivises the largest reduction in emissions, and therefore more likely to provide a greater contribution to Scotland’s climate change targets. This option presents a range for a ‘net zero consistent’ cap which would result in the total cap for the first phase (2021-2030) of between 887 million allowances and 936 million allowances, a reduction of 30-35% on the current legislated cap. Under these options by 2030 the cap would be 50 MtCO2e.
Option iii) was ruled out as it required lower emission reductions than option ii) and would place more pressure on the non-traded sector for the achievement of SG climate change targets. The CCC recommended that emissions should result in the total cap for the first phase of around 996 million allowances, with a cap of 59.3 MtCO2e in 2030.[14]
The Authority considered how to drive maximum climate ambition while enabling the market to function and UK ETS operators to decarbonise in a managed way. In combination with the other factors set out below, the Authority decided to set the cap at the top of the consulted range, which represents a reduction of 30% compared to what is currently legislated.
4.1.2 Unallocated Allowances
The Authority considered three options for the unallocated allowances:
i) Do nothing.
ii) Auction unallocated allowances to smooth the transition to the new cap.
iii) Retain unallocated allowances in contingency pots for later use.
Option i) was ruled out as the Authority deemed it important to support the transition to the net zero cap through bringing some unallocated allowances to auction.
The Authority therefore decided to combine options ii) and iii) to ensure that there are sufficient allowances to support the adjustment to the lower cap from 2024 whilst also retaining enough allowances in reserve for future market stability purposes and CSCF mitigation.
4.1.3 Industry Cap
The Authority considered two options for the setting of the industry cap:
i) Do nothing.
ii) Reset the industry cap to make up a percentage of the overall cap.
Under current rules the industry cap is set at the UK’s notional share of the EU ETS industry cap for Phase IV of the EU ETS. This means that the industry cap is currently legislated as fixed numbers of allowances based on the previous cap levels and will not automatically change with any changes to the cap. Option i) was therefore ruled out as it would mean that the proportion of allowances allocated for free would increase relative to the size of the revised cap. This was seen as potentially being detrimental to market functioning, stability and liquidity.
Option ii) is the preferred option as it enables the level of free allocations available to be set at a level which allows the overall cap to be distributed in a balanced way between free allocation and auction share.
The Authority decided to set the industry cap at 40% of overall cap. This is higher than retaining the current share of the cap of 37%. This enables the Authority to balance the requirements for a net zero consistent cap with support for businesses at risk of carbon leakage. It will also enable effective market functioning and allow sufficient allowances for auction.
This higher cap will also provide flexibility for the future decisions on the distribution of free allowances as part of the phase 2 Free Allocation Review. Further impact assessments will be undertaken as appropriate to assess the impact of any recommendations from this review. The Authority also committed to maintain free allocations at current levels, subject to activity level changes, until 2026 to further support the transition to the net zero consistent cap.
4.1.4 Aviation Free Allocation Phase out
The Authority examined the Aviation Free Allocation (AFA) phase out from two perspectives, namely the timing of a phase out and the speed/trajectory at which the AFAs would be reduced. Under current legislation AFAs are due to decline annually by 2.2% until 2026 at which point they are removed.
Three options were considered for the timing of the phase out:
- Option 1: Early phase-out: the rate at which free allocation entitlement reduces will increase so that full auctioning will apply from 2026.
- Option 2: Intermediate phase-out: the rate at which free allocation entitlement reduces will increase so that full auctioning will apply no later than 2028.
- Option 3: Later phase-out: The rate at which free allocation entitlement reduces will increase so that full auctioning will apply from the start of 2031.
Four options were considered for the speed/trajectory of the phase out:
- Option A: Linear: AFA entitlement decreases by a constant amount every year.
- Option B: Smooth backloaded: AFA entitlement decreases by an exponentially increasing amount each year.
- Option C: Sharp backloaded: half of the original AFA entitlement is phased-out linearly, the remaining half is phased-out in the final year.
- Option D: Sharp backload 2: AFA entitlement follows the business as usual trajectory (aviation free allocation annual reduction rate of 2.2%) until all the remaining AFA is removed in the final year.
Taking these options together the Authority considered the 12 phase-out trajectories. These comprised of four trajectories (options A to D) for each phase-out year 2026, 2028 and 2031 (options 1, 2 and 3,). These were assessed against the following criteria (more detail on which is available in Annex 4 of the IA):
- Cost;
- Revenue;
- UK ETS design and Objectives;
- Impact on competition and market distortion;
- Commercial viability and air connectivity; and
- Operational delivery.
The Authority has decided, following assessment of the options, that free allocation for the aviation sector will not be extended for the 2026-2030 allocation period but will follow a trajectory of a 2.2% annual reduction until all remaining AFAs are removed in 2026 (Option 1D). This option was chosen as it aligns with the overall policy objectives of the UK ETS, given the minimal risk of carbon leakage for the aviation sector.
4.2 Sectors and groups affected
The proposed changes to the UK ETS will primarily affect the sites and businesses which operate within the scheme. The UK ETS focuses on energy intensive industries, power generation and aviation. Scotland accounted for around 6.9% of the traded sector emissions in the UK ETS in 2021 (excluding those covered by the Hospital and Small Emitter opt out scheme[15]). The emission profiles vary across the regions with Scotland having a higher concentration of emissions in the energy intensive industries (around 72% of emissions) compared to the UK as a whole (around 42%), Figure 1.[16]
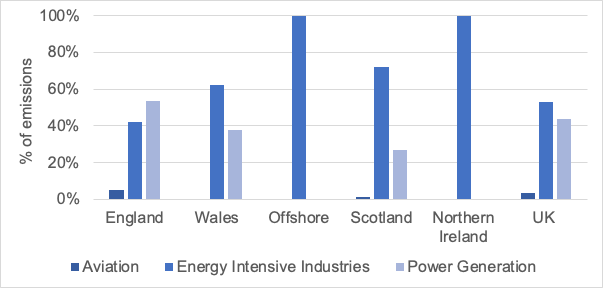
Source: Scottish Government analysis of main scheme activity as published in the UK ETS Registry data[17]
Notes to figure: Offshore activities are regulated by Offshore Petroleum Regulator for Environment and Decommissioning (OPRED) and are included in total UK ETS emissions.
In 2021 aggregated total emissions were approximately 73MtCO2e in England, 16.6 MtCO2e in Wales, 7.4MtCO2e in Scotland, 0.6MtCO2e in Northern Ireland and 10.1 MtCO2e for offshore sites.
By design, the UK ETS legislation applies across the whole of the UK to the same sectors (with the exception of power in Northern Ireland which remains under the EU ETS). This means that there is no specific Scottish cap, or specific cap for any of the four nations in the United Kingdom.
This presents challenges when assessing the impact and costs of the UK ETS changes at the regional level. Abatement opportunities, such as access to decarbonisation technologies, carbon capture and storage and fuel switching, will vary across and within sectors and regions and depend on often site-specific key infrastructure and technological solutions being available. In addition, Scotland’s industrial profile is different from the UK when taken as a whole and, as a result, the solutions required in Scotland may be different from those in the rest of the UK. Abatement solutions will also not be available or delivered symmetrically across the UK. Overall the rate of decarbonisation is therefore likely to differ across the UK nations. While we can draw some high level and aggregate conclusions around likely impacts, business responses to the proposed changes will be made on site-or organisation-specific commercial decisions which are difficult to predict on the basis of national or sector-level data and targets.
In addition to the sites and businesses which operate within the scheme, we expect that the proposed changes have the potential to have indirect and second order impacts on:
- Scottish businesses operating within the supply chain of those directly affected firms or businesses purchasing and using the products of firms within the UK ETS
- Scottish households which consume products produced by affected firms
- Central and local government and other public bodies which either participate directly in the UK ETS (i.e. hospitals via the HSE scheme) or which purchase products produced by firms within the UK ETS.
- Individuals who live and work in close proximity to sites within the UK ETS may experience positive air quality impacts as a result of a move towards clean energy sources.
4.2.1 Overall impact of Cap, Industry Cap and Unallocated Allowances
The overall impact on Scottish businesses is likely to be broadly in line with what is happening at the UK level. However, it should be noted that there are variations in the sectoral composition of the scheme across the regions. Emissions from the Scottish traded sector, excluding HSE, in 2021 were concentrated in three sectors; power (27%), oil and gas (27%) and chemicals (20%), Figure 2. This is different from the traded sector in the UK as a whole, as emissions are more concentrated in the power sector (44%), oil and gas (22%) and iron and steel (11%).
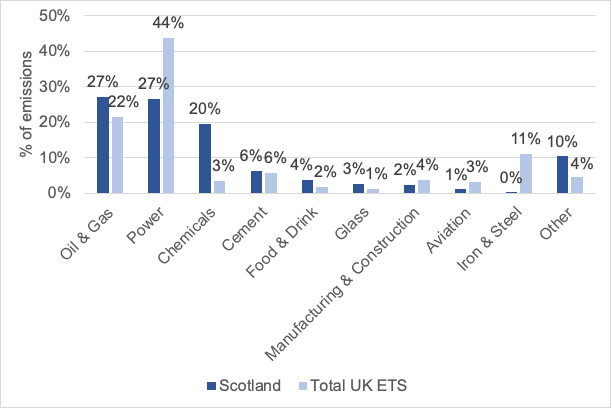
Source: Scottish Government analysis of UK ETS registry data
Scotland’s emissions are also highly concentrated in a few sites, with the top ten emitters accounting for 73% of Scotland’s traded sector emissions in 2021. The impact the UK ETS has on these sectors will depend on their decarbonisation pathways, including access to decarbonisation technology.
The impact of the UK ETS on Scottish regions will also vary, as different regions are home to different numbers, and types, of UK ETS sites. Figure 3 highlights that the largest concentration of emissions and sites occurs in the central belt and Aberdeenshire.
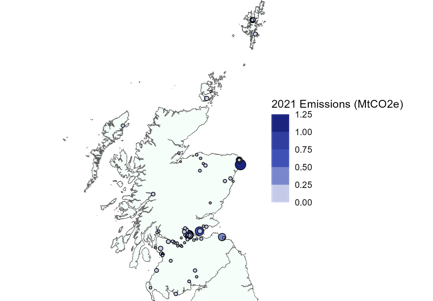
Source: Scottish Government analysis of UK ETS registry data and SEPA data
The proposals to reset the cap will affect all sectors operating in the UK ETS. It will intentionally limit the number of allowances available, thereby creating an incentive to invest in decarbonisation. Likewise, the decisions around the auctioning of unallocated allowances will impact all UK ETS operators as these will be available to all UK ETS operators (under the main scheme) to buy.
To assess the potential impact of the changes in the UK ETS cap on Scotland we used Scotland’s 2021 share of main UK ETS emissions (6.9%) to produce a hypothetical “Scottish Share” of the UK ETS cap over the period to 2030. (Figure 4). This has been used as a proxy to estimate how Scottish industries may be impacted by the Cap and implies that Scottish ETS emitters decarbonise on average at the same rate as the UK as a whole. As discussed above, the actual rate at which Scottish emitters decarbonise may well be faster or slower than the overall decline in the UK cap and will depend on a variety of site-specific factors related to costs and the technological and process options available.
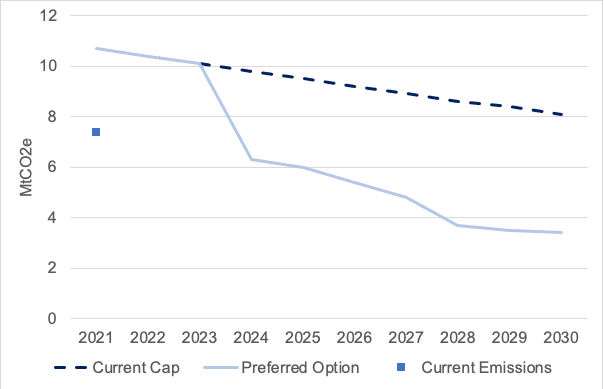
Source: Scottish UK Government Analysis
Scottish Operators who are exposed to the risk of carbon leakage[18] are eligible for free allowances. The decision to set the ‘Industry Cap’ at 40% of the cap is designed to mitigate that risk of carbon leakage and support those industries to invest in decarbonisation. Scottish ETS sites account for 7.7% of all free allowances which cover 44% of Scottish ETS emissions. This is slightly higher than the UK as a whole where 39% of UK ETS emissions were covered by free allowances in 2021, however this will be influenced by the lower proportion of emissions from power in Scotland.
The Authority is due to review the Free Allocation (phase 2) in the coming years ahead of the next free allocation phase (from 2026). Further impact assessments will be undertaken as appropriate to assess the impact of any recommendations from this review.
4.2.2 Impact of the aviation phase out
The phase out of free allocation for aviation will impact a number of airlines operating across the UK, including those operating routes in Scotland. In 2021 there was only one airline which was regulated by SEPA which participated in the UK ETS - 14% of its emissions were covered by free allowances. As SEPA regulates only one airline it would not be appropriate for government to speculate on the impacts on an individual business. We have, however, considered the potential impact on island connectivity specific to Scotland, in our Island Communities Impact Assessment[19].
As a large number of other airlines operate in Scotland (whilst being regulated by the appropriate organisations in England or Wales) it is useful to consider the impact on the aviation sector as a whole. As part of the Authority’s review of the future of aviation free allowances, external economic research was commissioned by the Department for Transport and the Department for Business, Energy and Industrial Strategy (BEIS).[20] This suggests that the withdrawal of free allowances poses minimal risk of carbon leakage for aviation. However, this analysis does highlight that withdrawal of free allowances may lead to a reduction in airlines’ capacity. Further, the UK ETS Impact Assessment highlights that “we expect that the withdrawal of free allocation may lead to small impacts on regional airports except where an Aircraft Operator leaves a market and there is a subsequent sustained reduction in capacity, there may be knock on impacts on small regional airports, particularly if they are reliant on one carrier or limited routes”.
4.3 Benefits
There are a number of benefits associated with these policy changes to the UK ETS. The primary benefit of this policy is the reduction in GHG emissions reductions arising from the tightened cap. This will support delivery of our statutory climate change targets. Relative to the counterfactual we expect a significant reduction in traded sector emissions.
It is expected that the price signal from the UK ETS will increase the incentive for firms to invest and deploy clean technologies and processes by making them better value for money than higher emissions alternatives. It will also incentivise firms to drive improvements in their energy efficiency as using less fuel input per unit of output would reduce their exposure to the carbon price. This increased investment in decarbonisation technologies can have long term positive spillovers, with reduced costs and accelerated future abatement. The development and implementation of these decarbonisation technologies will also support jobs and investment within the green economy in Scotland and across the rest of the UK which is key to Scotland’s objectives for a Just Transition to net zero.
Any movement away from fossil fuels and other fuels such as biofuels can yield improvements to air quality, which can significantly improve health outcomes. In their Sustainable Health Equity: Achieving a Net Zero report to the CCC The UK Health Expert Advisory Group highlighted that the move to clean energy sources and a move away from fossil fuels in the power generation and industry sectors is a key component of improving health outcomes.[21]
4.4 Costs
There are two main costs to Scottish businesses as a result of this policy: the costs associated with investment in decarbonisation technologies, and the costs associated with purchasing of allowances.
The primary objective of the UK ETS is to encourage firms to invest in decarbonising technologies and processes. The higher the UK ETS allowance price the higher the costs to firms of unabated emissions. In theory we would expect abatement to occur up to the point where the marginal cost (i.e., the cost of abating an additional unit of emissions) is less than or equal to the allowance price in the system. The available decarbonisation options and associated costs will be diverse and determined on a site-specific basis. Options could range from fuel saving and energy efficiency measures, fuel switching and electrification, process redesign and Carbon Capture and Storage.
There are also costs associated with the purchasing of allowances. This can be done via auction, where the allowances are purchased directly from the Authority, or via the secondary market. The reduction in free allowances, and greater abatement required by the cap, means there may be more operator engagement in primary and secondary allowance markets in order to buy and sell allowances.
From the primary auctions in 2021 alone, Scottish businesses are estimated to have spent in the region of £215m to comply[22]. Estimates suggest that industry in Scotland spent in the region of £110m, Power £100m and aviation £5m in 2021. By the same token free allowances can be considered a benefit to business with free allowances issued in 2021 being valued at around £170m, with nearly all of this in the industry sector. It is estimated in the UK ETS Impact Assessment that across the whole of the UK the direct cost to business of the preferred option is £2.4bn, assuming that the UK Government policies under the high policy scenario, such as CCUS and hydrogen, are delivered. This is primarily driven via the purchasing of allowances via the markets by participants.
4.5 Overall costs and benefits associated with the UK ETS changes
As highlighted above there are a number of challenges to analysing the impact of the changes to the cap on Scottish Businesses. As the Authority agrees a shared approach to UK ETS changes it is appropriate for the costs and benefits of this policy to be examined at a UK-level. This analysis was undertaken by the Department of Energy Security and Net Zero (DESNZ) and full details can be found in the UK ETS Impact Assessment attached to the Government Response.
The UK ETS Impact Assessment provides the overall economic impact across the UK of these changes. The UK ETS Impact Assessment discounts and sums the flow of costs and benefits over time to derive a net present value, a measure of the overall economic impact of the policy changes. It suggests that for the preferred option there is a high Net Present Value (NPV) of £10.1bn along with a high Benefit to Cost Ratio (BCR) of 7.1, assuming that there is other UK Government Support for decarbonisation alongside UK ETS under the high policy baseline. A key element of this decarbonisation support in Scotland will be the decision around whether or not we are awarded the Track 2 Cluster for CCUS, which will impact our ability to decarbonise. Whilst the analysis in the impact assessment is done at a UK level, we would expect the level of overall impact for the individual UK nations should also remain high and positive. This is because the same mechanisms that drive the overall NPV and BCR would also apply to the Devolved Administrations.
Contact
Email: emissions.trading@gov.scot
There is a problem
Thanks for your feedback