Offshore wind - birds on migration in Scottish waters: strategic review
A report detailing the migratory routes of bird species around the UK and Ireland which have the potential to be impacted by offshore wind developments. This forms part of the strategic study of collision risk for birds on migration and further development of the stochastic collision risk modelling tool work package one.
This document is part of a collection
Species accounts
Species are listed below systematically, following the most recent online checklist of the British Ornithologists Union, which is dated 29 November 2021[16]. This online checklist is maintained and updated between full published checklist editions, the latest of which was the 9th edition (BOU, 2017). For some geese species, the species accounts have been split into separate accounts for different biogeographic populations. The names given for these populations have been taken from the Wetlands International Waterbird Population Estimates website[17].
Recommended values for key parameters for the collision risk modelling tool developed as part of Work Package 2 are highlighted in bold and included in electronic appendix 5, which accompanies this report and forms the basis for data entry in relation to the collision risk modelling tool. These values are based on the evidence reviewed by the project teamand have been derived using the criteria and approach described in the approach to baseline data update (above). These values represent our best assessment based on evidence at time of writing. However, these values should not be taken to reflect guidance from Statutory Nature Conservation Bodies (SNCBs) with respect to application of the migration sCRM tool to future project-level impact assessments. Advice from SNCBs should be sought in relation to suitable parameter values before any collision risk modelling is undertaken.
'East Atlantic' Light-bellied Brent Goose (North Greenland/Svalbard) Branta bernicla hrota
SPA species? |
Yes (non-breeding population) |
|---|---|
SPA site codes (Introduction, Table 2) |
33 |
Population size breeding (UK) |
n/a |
Population size non-breeding (UK) |
3,400 individuals (APEP 4, 2020); uncertainty: low |
Population size (Biogeographic flyway, SPA season) |
13,400 individuals (North Greenland/Svalbard, non-breeding); uncertainty: low (Wetlands International, 2021) |
Percentage of biogeographical population at risk of collision in UK waters (passage / breeding / non-breeding) |
100%; uncertainty: low |
Movement of wintering birds
Migratory routes
Confidence: Medium
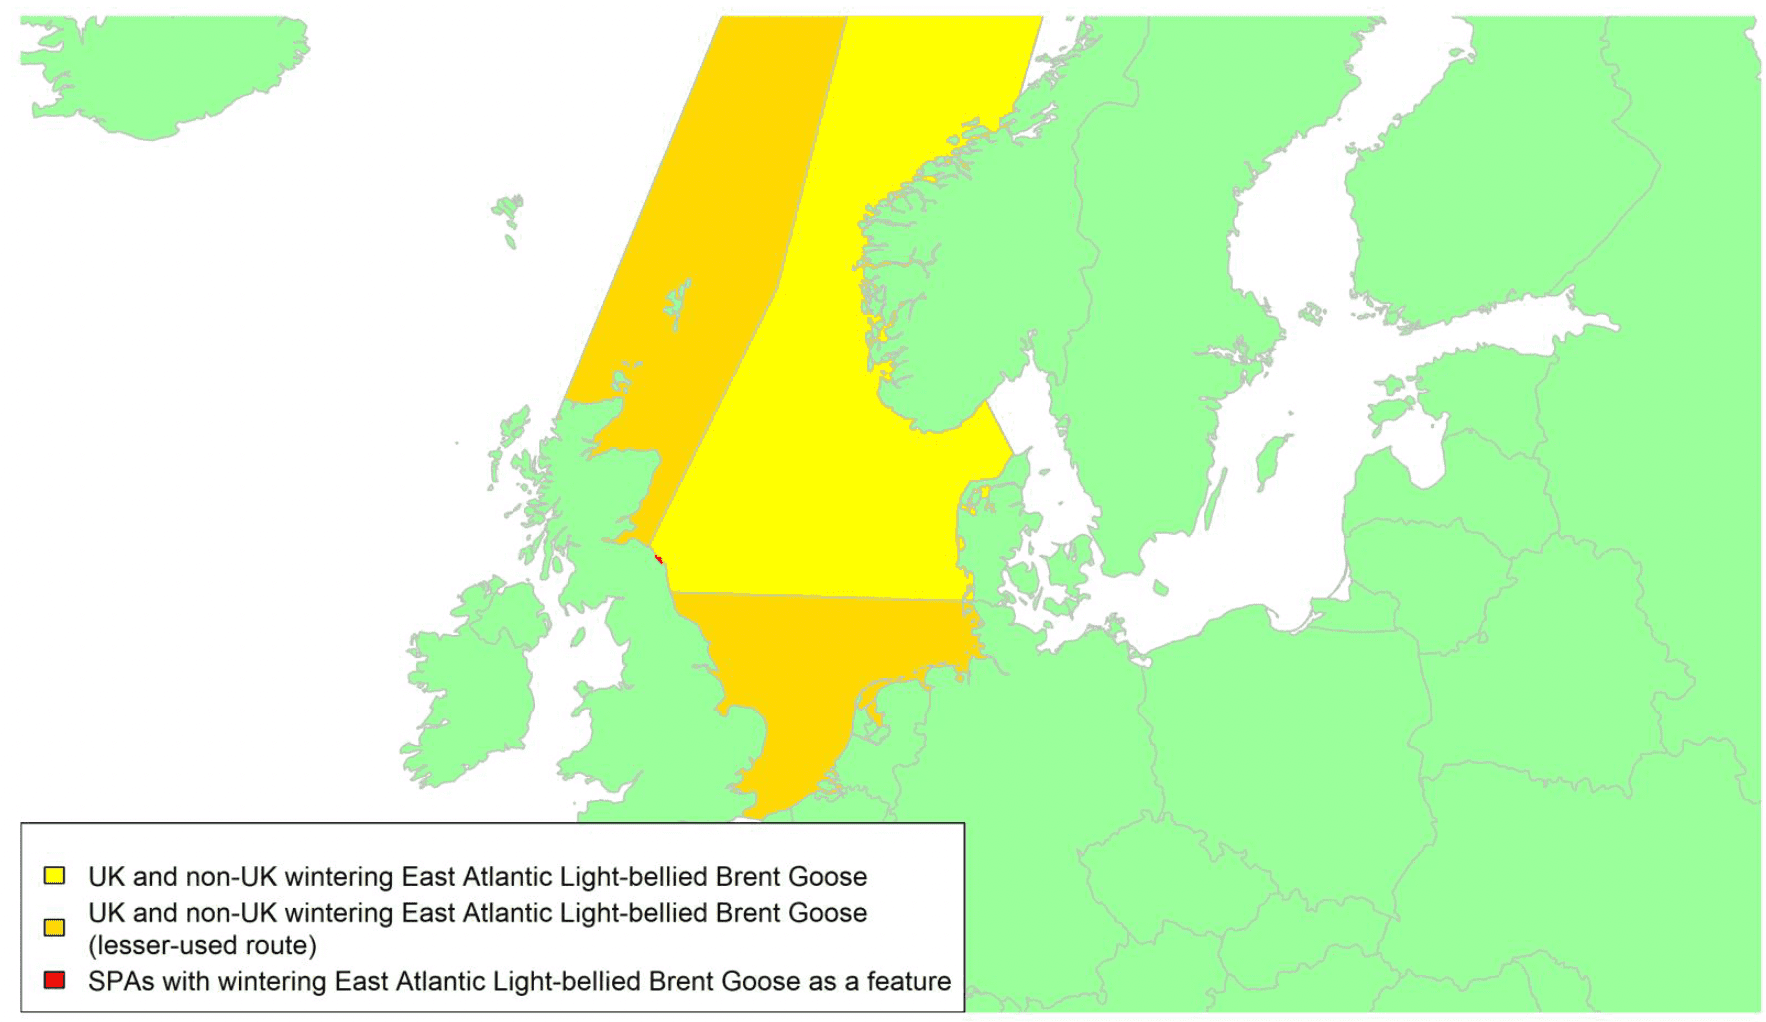
By far the greatest concentration for this population of Brent Geese in the UK is found at Lindisfarne/Budle Bay, Northumberland, where over the period from 2010 to 2020 typically 3-4,000 geese have wintered. These birds may migrate to and from the UK direct or they may pass through estuaries in northern Denmark and the Wadden Sea on migration to and from the breeding grounds in Franz Josef Land, Svalbard and the northeastern tip of Greenland and might thus be susceptible to possible planned infrastructure developments offshore in mid-North Sea UK waters. Such sites are likely to be within the migratory corridor of birds travelling between the UK and Denmark or the UK and south-west Norway. All the birds from this population winter in the UK and could therefore be potentially at risk of collision with wind turbines in UK waters.
In Scotland, small flocks of East Atlantic Light-bellied Brent Geese are recorded regularly, particularly in the autumn, at many east coast estuaries and lochs and in the Northern Isles. The phenology of these records suggests that many birds may be making landfall before filtering down the country to the principal UK wintering site at the Lindisfarne NNR, Northumberland. However, larger numbers have been recorded during cold weather movements.
No locations in Scotland currently support internationally important numbers throughout the winter but WeBS counts record the Eden Estuary holding up to 43 birds and Montrose Basin up to 23 in some recent winters to 2018/19, with other east coast estuaries such as Tyninghame Bay holding less than 20 birds. Fox & Leafloor (2018) report up to 100 in the Outer Moray Firth near Nairn. In most winters it is likely that less than 150 birds from this population are present in Scotland beyond the autumn passage period.
Very little tracking work has been directly conducted on the birds wintering in the UK.
Tags fitted in Denmark have shown the strong linkages with the Lindisfarne site, as have colour ring sightings. Colour rings also confirm the linkages of the Scottish birds with this flyway. It is highly likely that during certain weather events and with southerly winds, birds migrating across the North Sea from Denmark or Norway could encounter existing offshore wind farms around the Firth of Forth or Moray Firth to arrive at the Scottish east coast before then reorientating to fly south along the coast for Lindisfarne. Northerly winds might lead to more birds encountering existing offshore wind farms closer to the Humber and Wash areas.
East Atlantic Light-bellied Brent Geese in the UK either migrate via Denmark or direct to Norway in the spring and then along the Norwegian coast to breed and moult in Svalbard or continue on to northeast Greenland or Franz Josef Land (Fox & Leafloor, 2018). The autumn migration is essentially the reverse of the spring migration but with a greater tendency for the birds to bypass Denmark with the birds arriving in the UK across a much broader front, perhaps depending on wind conditions during the migration from the Arctic. In colder winters some birds will progress to the Netherlands from Denmark, but it is not known if birds in the UK do this. The majority of birds will normally cross the yellow shaded areas on the map above, with the orange areas being used less frequently but more likely to be used in autumn as described above.
Timing of migration
Confidence: High
At Lindisfarne, where numbers are comprehensively followed, the first birds usually arrive in the last few days of August and compared to the Svalbard Barnacle Geese and Pink-footed Geese that also use the site, the Brent Geese are always the first of the Arctic migratory geese to arrive. Numbers build up very quickly and reach a peak by early October. There is a mass exodus in March, with few remaining thereafter.
The BirdTrack graphs (see Appendix 2) cannot be reliably interpreted for this flyway population as separate BirdTrack graphs are not presented for the three Brent Goose populations. The graphs for Scotland will also include records of 'Nearctic' Light-bellied Brent Geese, whereas the graph for northeast England will also include records of Dark-bellied Brent Geese.
Flight heights
Confidence: Medium
Gyimesi et al. 2017 obtained 566 GPS estimates of flight height from nine Svalbard Light-Bellied Brent Geese at distances >5 km from the coast across the southern North Sea, with a median flight height of 2 m. Of these, 73% of measurements were below 25 m, and 98% were below 600 m. Of the remainder, all those above 2000 m were considered to be erroneous, likely attributable to GPS error.
In contrast, Dau (1992) used radar to measure the flight heights of 30 flocks of Pacific Black Brant (B. b. nigricans) during their autumn migration from Alaska to Baja California, generating a mean estimate of 1,149±453 m (min 488 m, max 2,196 m).
Assuming a minimum rotor height of 22 m above highest astronomic tide, data from the North Sea suggest that between 25 and 50% of flights may occur at rotor height. In light of the uncertainty surrounding this estimate, it is recommended that a precautionary estimate of 50% of flights at rotor height are assumed.
Flight speeds
Confidence: High
Groundspeeds for Brent Geese, as for all birds, will depend on wind velocity and direction (Safi et al. 2013), with birds sometimes unable to progress towards their destination if encountering strong headwinds, but travelling rapidly if assisted by tailwinds. The mean groundspeed in the southern North Sea was 17.9 m/s (±SD 6.1 m/s; median speed 17.1 m/s) but can reach speeds of approximately 41.6 m/s (N = 578 GPS data points from 21 Svalbard Light-Bellied Brent Geese; Gyimesi et al. 2017). For two studies mean flight/airspeeds of 16.4±1.77 m/s and 17.7±2.8 m/s were recorded using theodolite (Pennycuick et al. 2013) and radar respectively (Alerstam et al. 2007).
Distance/time calculations carried out for the present study, using tracking data from UK-tagged Canadian (Nearctic) Brent Geese (49 speed estimates from 8 tracks), gave a bimodal distribution. The lower mode was assumed to be caused by position error or birds resting on water; the upper mode was 13-14 m/s.
Flight speed data are available for Brent Geese from multiple studies, and estimates are broadly consistent with one another. The collision risk model should use groundspeed rather than airspeed (Band, 2012; Masden et al. 2021). Given this, and reflecting the sample sizes in the above studies, it is recommended that the estimate of 17.9 m/s ± 6.1 m/s from Gyimesi et al. (2017) is used for the purposes of collision risk modelling.
Avoidance rates and behaviour
Confidence: Very Low
Recommend values for all geese species range from 0.68 to 1, with values of 0.99-1 typically accepted by statutory agencies such as Natural England and NatureScot (0.998; Scottish Natural Heritage, 2017). The lower value of 0.68 was based on panorama scans at Egmond aan Zee Offshore Windfarm in the Netherlands which highlighted a substantial proportion of the flight paths of geese and swans deflecting to avoid entering the windfarm (Krijgsveld et al. 2011).
Previous comparisons of predicted and observed collision rates for geese suggest within-windfarm rates of avoidance are likely to be high. Analysis of these datasets and others collected subsequently reinforces this with a within-windfarm avoidance rate estimated from post-construction monitoring data for all geese of 0.9998 (Table 5). Based on these analyses, an avoidance rate of 0.9998 ± 0.00001 is recommended for use in relation to collision risk modelling.
'Nearctic' Light–bellied Brent Goose (Canada and Greenland/Ireland) Branta bernicla hrota
SPA species? |
Yes (non-breeding population) |
|---|---|
SPA site codes (Introduction, Table 2) |
85:86:87:88:90:93 |
Population size breeding (UK) |
n/a |
Population size non-breeding (UK) |
31,000 individuals (APEP 4, 2020); uncertainty: low |
Population size (Biogeographic flyway, SPA season) |
37,000 individuals (Nearctic, non-breeding); uncertainty: low; (Wetlands International, 2021) |
Percentage of biogeographical population at risk of collision in UK waters (passage / breeding / non-breeding) |
100%; uncertainty: low |
Movement of wintering birds
Migratory routes
Confidence: Medium
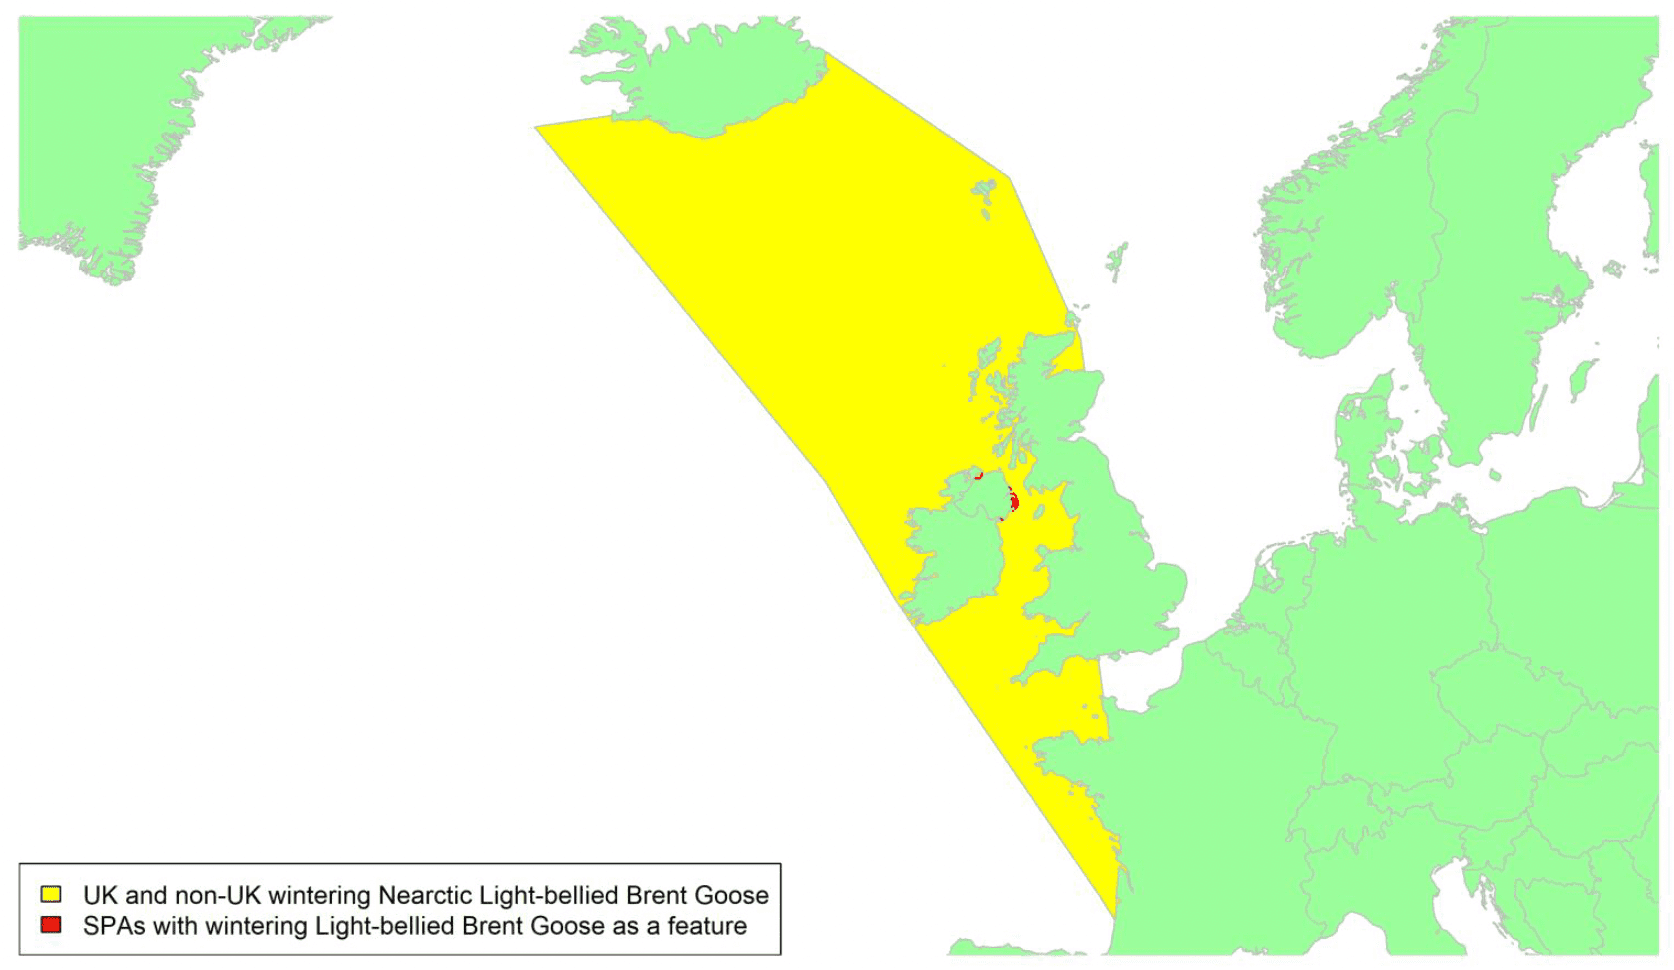
This population of Brent Goose breeds in Canada and Greenland and winters mostly in Ireland. There are no locations in Scotland with internationally important concentrations of Nearctic Light-bellied Brent Geese. Locations on Islay, in the Outer Hebrides / Na h-Eileanan Siar (from Barra to the Sound of Harris), and on the west coast of the mainland (e.g., Loch Ryan near Stranraer, and Wigtown Bay in Galloway) are visited annually by small groups of Nearctic Light-bellied Brent Geese on passage between Iceland and Ireland. Very occasionally, large numbers stop briefly, notably 4,000 at Loch Indaal, Islay in 1971. Colour rings also confirm the linkages of the birds at locations in western Scotland with this flyway (though birds known from this Canadian flyway have also used locations on the east coast such as the Moray Firth).
The Scottish haunts generally serve as temporary staging areas, probably when unfavourable weather conditions develop during migration, or when some geese find themselves under stress (Robinson et al. 2004). However, as the flyway population has grown, small flocks spend the entire winter at these Scottish localities. WeBS counts record the Islay Sea lochs of Indaal/Gruinart holding c.70 birds in most winters and the Wigtown/Garlieston Bay area holding 50-100, with Loch Ryan usually the most important Scottish location with c.150. In most winters it is likely that fewer than 350 birds from the Canada & Greenland population are present in Scotland beyond the autumn passage period.
There are six SPA sites for this flyway population in Northern Ireland and at least 75% of the population stages at Strangford Lough in the autumn before spreading south and west to locations in the Republic of Ireland.
Some limited tracking data are available from nine individuals from the Irish wintering population, covering nine migratory tracks (six spring and three autumn) across three years of study (2005 to 2007). There is an associated low-medium degree of confidence in these data. As shown in Appendix 1, they indicate that migration routes are concentrated in the North Atlantic migratory corridor extending across a front from south-west Ireland and northwest Scotland to the south coast of Iceland for birds moving between their wintering areas in Ireland and staging areas in Iceland with the front tending to be narrower in spring than in autumn when some birds may bypass Iceland on migration south to Ireland from the Canadian breeding grounds. Birds could therefore pass through the areas shown in yellow on the above map, which includes the waters crossed by some birds which pass through UK waters to winter off the coast of France. No tracking work has been conducted on the birds wintering in Scotland.
Nearly all birds heading from or to Ireland are likely to pass through UK waters during both the spring and autumn migrations (Griffin et al. 2011). Hence, all the birds in the biogeographic population could potentially be at risk of collision with wind farms in UK waters whilst migrating.
Timing of migration
Confidence: Medium
The first arrivals into Scotland or Ireland can be in late August with peak numbers by mid-October. The birds start heading north again for western Iceland and then the Canadian High Arctic islands or north-west Greenland to breed and moult in the last few days of March/early April with some stragglers into early May. The limited tracking data available suggest the birds start their migration across the Atlantic direct from Ireland or from staging sites in Scotland during daylight hours or during early evening. The journey across the Atlantic is completed in about 10-30 hours.
The BirdTrack graphs (see Appendix 2) broadly agree with these timings. Note, however, that separate BirdTrack graphs are not presented for the three Brent Goose populations. The graph for Northern Ireland will show the movements of this population as will the graphs for Scotland although some of these will also be influenced by movements of 'East Atlantic' Light-bellied Brent Geese.
Flight heights
Confidence: Medium
Gyimesi et al. 2017 obtained 566 GPS estimates of flight height from nine Svalbard Light-Bellied Brent Geese at distances >5km from the coast across southern North Sea, with a median flight height of 2m. Of these, 73% of measurements were below 25 m, and 98% were below 600 m. Of the remainder, all those above 2000 m were considered to be erroneous, likely attributable to GPS error.
In contrast, Dau (1992) used radar to measure the flight heights of 30 flocks of Pacific Black Brant (B. B. nigricans) during their autumn migration from Alaska to Baja California, generating a mean estimate of 1,149±453 m (min 488 m, max 2,196 m).
Assuming a minimum rotor height of 22 m above highest astronomic tide, data from the North Sea suggest that between 25 and 50% of flights may occur at rotor height. In light of the uncertainty surrounding this estimate, it is recommended that a precautionary estimate of 50% of flights at rotor height are assumed.
Flight speeds
Confidence: High
Groundspeeds for Brent Geese, as for all birds, will depend on wind velocity and direction (Safi et al.2013), with birds sometimes unable to progress towards their destination if encountering strong headwinds, but travelling rapidly if assisted by tailwinds. The mean groundspeed in the southern North Sea was 64.5 k/h (± SD 22.0 k/h; median speed 61.4 k/h) but can reach speeds of approximately 150 k/h (N = 578 GPS data points from 21 Svalbard Light-Bellied Brent Geese; Gyimesi et al. 2017). For two studies mean flight/airspeeds of 16.4 ± 1.77 m/s and 17.7 ± 2.8 m/s were recorded (c.60 k/h) using theodolite (Pennycuick et al. 2013) and radar respectively (Alerstam et al. 2007).
Flight speed data are available for Brent Geese from multiple studies, and estimates are broadly consistent with one another. The collision risk model should use groundspeed rather than airspeed (Band, 2012; Masden et al. 2021). Given this, and reflecting the sample sizes in the above studies, it is recommended that the estimate of 17.9 m/s ± 6.1 m/s from Gyimesi et al. (2017) is used for the purposes of collision risk modelling.
Avoidance rates and behaviour
Confidence: Very Low
Recommend values for all geese species range from 0.68 to 1, with values of 0.99-1 typically accepted by statutory agencies such as Natural England and NatureScot (0.998; Scottish Natural Heritage, 2017). The lower value of 0.68 was based on panorama scans at Egmond aan Zee Offshore Windfarm in the Netherlands which highlighted a substantial proportion of the flight paths of geese and swans deflecting to avoid entering the windfarm (Krijgsveld et al. 2011).
Previous comparisons of predicted and observed collision rates for geese suggest within-windfarm rates of avoidance are likely to be high. Analysis of these datasets and others collected subsequently reinforces this with a within-windfarm avoidance rate estimated from post-construction monitoring data for all geese of 0.9998 (Table 5). Based on these analyses, an avoidance rate of 0.9998 ± 0.00001 is recommended for use in relation to collision risk modelling.
Dark-bellied Brent Goose (Western Siberia/Western Europe) Branta bernicla bernicla
SPA Species? |
Yes (non-breeding population) |
|---|---|
SPA site codes (Introduction, Table 2) |
7:8:15:16:17:18:19:23:24:27:30:37:44:49:53:58:63:69:70 |
Population size breeding (UK) |
n/a |
Population size non-breeding (UK) |
98,500 individuals (APEP4, 2020); uncertainty: low |
Population size (Biogeographic flyway, SPA season) |
211,000 individuals (Western Siberia/Western Europe, non-breeding); uncertainty: low (Wetlands International, 2021) |
Percentage of biogeographical population at risk of collision in UK (passage/breeding/non-breeding) |
c.47%; uncertainty: low |
Movement of wintering birds
Migratory routes
Confidence: Medium
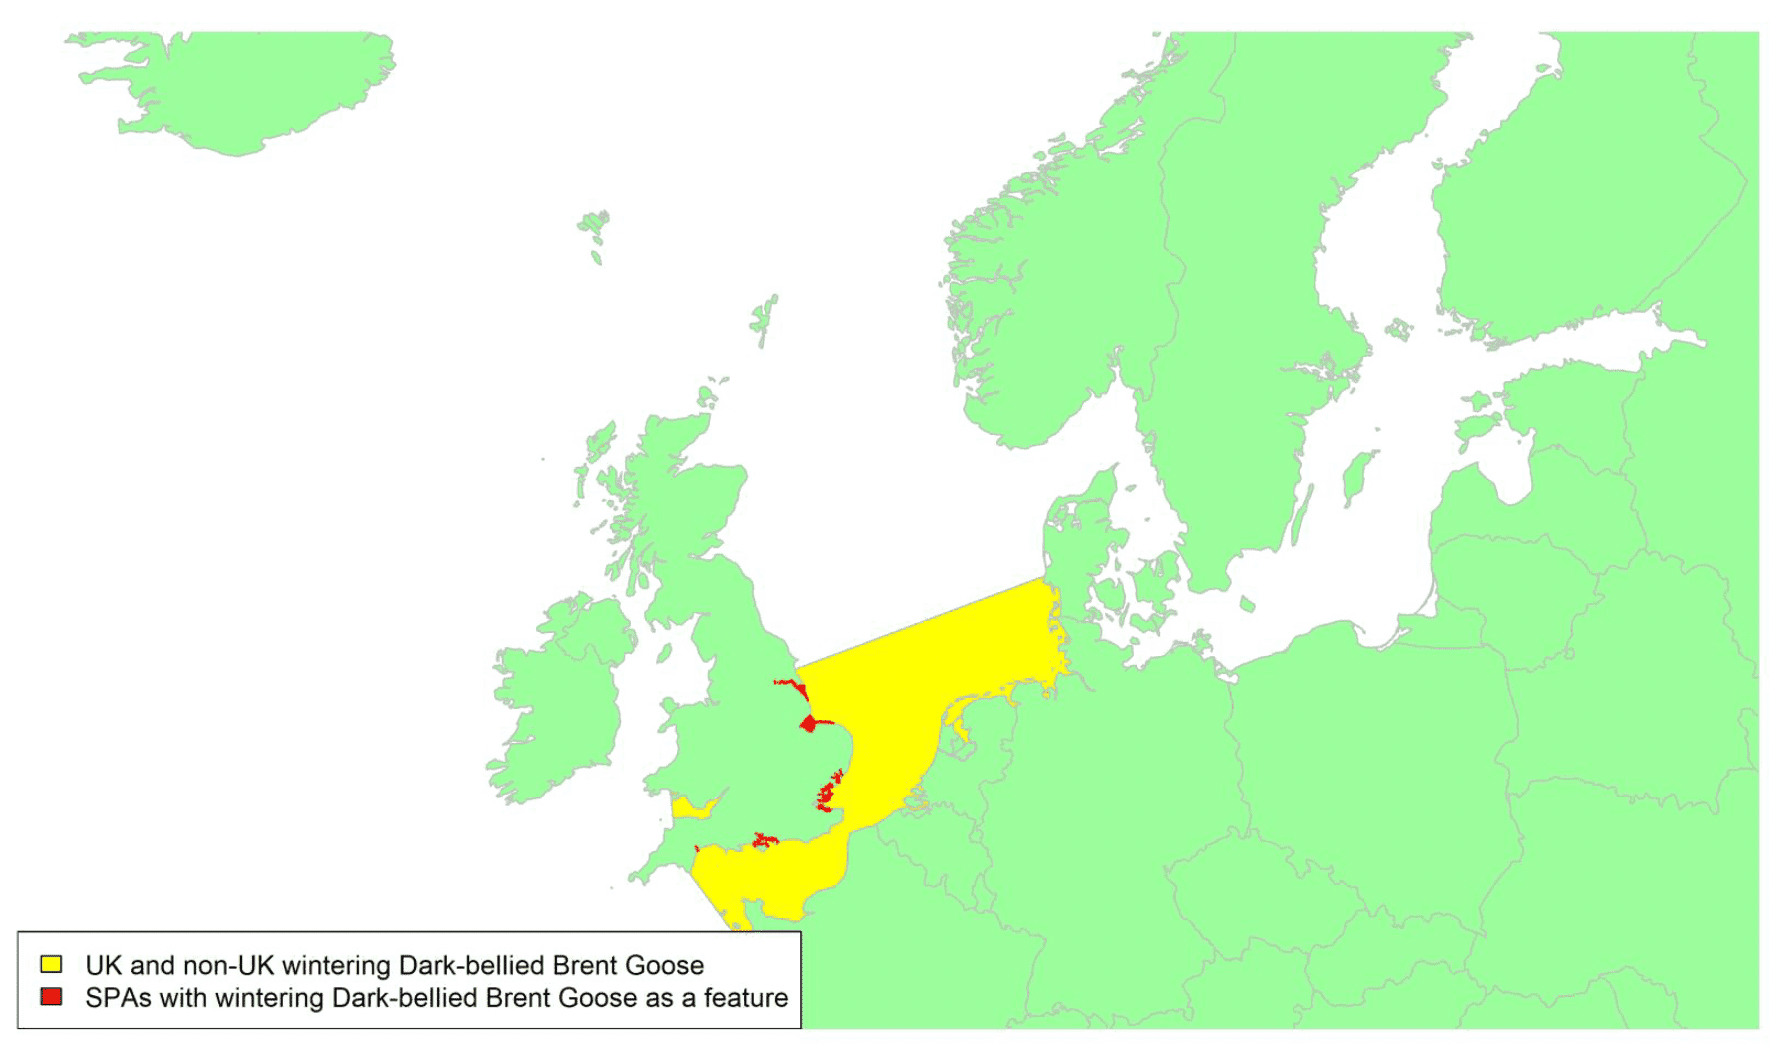
The 'Dark-bellied' form of Brent Goose migrates from breeding sites in the Russian Arctic to spend the winter in western Europe, including the southern and southeastern parts of Britain, via staging areas in the Wadden Sea during both autumn and spring migrations. This means that the majority of migrants visiting Britain probably pass across the central or southern parts of the North Sea, as shown by the yellow shaded areas on the above map. UK wintering birds account for almost half of the entire flyway population; hence 47% of the population could potentially be at risk of collision with wind turbines in UK waters. The most important wintering areas are the Thames Estuary, Chichester Harbour and the Wash (Frost et al. 2021) and there is some interchange between sites during the course of the winter (Wernham et al. 2002). This species is a high priority for further research to improve understanding of the precise timings, locations, and flight heights of movements of this species across the North Sea.
The main movements of Dark-bellied Brent Geese across UK waters occur during their bi-annual migrations from their UK wintering grounds to their staging areas in the Netherlands and Germany. Precise migration routes to the UK are poorly known, but the birds are presumed to cross the sea on a relatively broad front to their main wintering locations. Gyimesi et al. (2017, Figure 5.2.2), shows the migration route of 41 Dark-belled Brent Geese marked in the Netherlands with GPS tags and highlights the broad front to their migratory pathway, with direct flights arriving/departing the east coast of England from north Norfolk to Sussex.
Timing of migration
Confidence: Medium
Autumn migration occurs between late September and November, with large gatherings at Foulness and Leigh, Essex from where they disperse to other parts of England and south Wales. The return migration is between late February and May. Offshore movements occur throughout the winter months as birds move between sites[18].
The BirdTrack graphs (see Appendix 2) broadly agree with these timings. Note, however, that separate BirdTrack graphs are not presented for the three Brent Goose populations. Only the graphs for southern, southeast, eastern and northeast England will relate to the movements of Dark-bellied Brent Goose.
Flight heights
Confidence: Medium
There is limited information on typical flight heights of migratory dark-bellied Brent Geese. A flock of this population was recorded flying at 506 m by radar (Alerstam & Gudmundsson, 2016) and 58 birds were recorded at a mean height of 215 m (± 172 SD) by rangefinder and radar on autumn migration in Sweden (Green & Alerstam, 2000). Also, in Sweden, tracks of 27 birds from this population were recorded flying at 297 m (± 125 SD; range 83-676 m) by radar in spring (Green, 2000).
Gyimesi et al. 2017 obtained 566 GPS estimates of flight height from nine Svalbard Light-Bellied Brent Geese at distances >5 km from the coast across southern North Sea, with a median flight height of 2 m. Of these, 73% of measurements were below 25 m, and 98% were below 600 m. Of the remainder, all those above 2000 m were considered to be erroneous, likely attributable to GPS error.
In contrast, Dau (1992) used radar to measure the flight heights of 30 flocks of Pacific Black Brant (B. B. nigricans) during their autumn migration from Alaska to Baja California, generating a mean estimate of 1,149 ± 453 m (min 488 m, max 2,196 m).
Assuming a minimum rotor height of 22 m above highest astronomic tide, data from the North Sea suggest that between 25 and 50% of flights may occur at rotor height. In considering both Light-Bellied and Dark-bellied Brent Geese, additional data are available for the Dark-bellied Brent Geese. However, these data are broadly consistent with the data already identified for Light-bellied Brent Geese. Consequently, in light of the uncertainty surrounding these estimates, it is recommended that a precautionary estimate of 50% of flights at rotor height are assumed.
Flight speeds
Confidence: High
Birds from this population were recorded at a mean speed of 17.7 m/s (± 2.8 SD) based on 97 tracks using radar in the Arctic and southern Sweden (Alerstam et al. 2007). Green et al. (2002) recorded flight speeds that ranged between 16.1 and 30.3 m/s during migration using satellite transmitters on nine Brent Geese in the Dutch Wadden Sea. Theodolite measurements of 53 runs showed mean flight speed of 16.4 m/s (± 1.8 SD) during autumn migration in the Baltic (Pennycuick et al. 2013). Gyimesi et al. (2017) report 578 data points from 21 individuals showing a mean flight speed of 17.9 m/s (± 6.21 SD; maximum 41.7). Green & Alerstam (2000) recorded average groundspeeds of 19.2 m/s in spring and 16.9 m/s in autumn using radar and range finder. Two adults of a related subspecies (nigricans), showed an average groundspeed over the mid-portion of the Pacific Ocean of 13.9 m/s (Boyd et al. 2013).
Flight speed data are available for Brent Geese from multiple studies, and estimates are broadly consistent with one another. The collision risk model should use groundspeed rather than airspeed (Band, 2012; Masden et al. 2021). Given this, and reflecting the sample sizes in the above studies, it is recommended that the estimate of 17.9 m/s ± 6.1 m/s from Gyimesi et al. (2017) is used for the purposes of collision risk modelling.
Avoidance rates and behaviour
Confidence: Very Low
Recommend values for all geese species range from 0.68 to 1, with values of 0.99-1 typically accepted by statutory agencies such as Natural England and NatureScot (0.998; Scottish Natural Heritage, 2017). The lower value of 0.68 was based on panorama scans at Egmond aan Zee Offshore Windfarm in the Netherlands which highlighted a substantial proportion of the flight paths of geese and swans deflecting to avoid entering the windfarm (Krijgsveld et al. 2011).
Previous comparisons of predicted and observed collision rates for geese suggest within-windfarm rates of avoidance are likely to be high. Analysis of these datasets and others collected subsequently reinforces this with a within-windfarm avoidance rate estimated from post-construction monitoring data for all geese of 0.999 (Table 5). Based on these analyses, an avoidance rate of 0.9998 ± 0.00001 is recommended for use in relation to collision risk modelling.
'Svalbard' Barnacle Goose (Svalbard/South-west Scotland) Branta leucopsis
SPA species? |
Yes (non-breeding population) |
|---|---|
SPA site codes (Introduction, Table 2) |
78:156 |
Population size breeding (UK) |
n/a |
Population size non-breeding (UK) |
43,500 individuals (APEP 4, 2020)[19]; uncertainty: low |
Population size (Biogeographical flyway, SPA season) |
40,000 individuals (Svalbard/South-west Scotland, non-breeding); uncertainty: low (Wetlands International, 2021) |
Percentage of biogeographical population at risk of collision in UK waters (passage/breeding/non-breeding) |
100%; uncertainty: low |
Movement of wintering birds
Migratory routes
Confidence: High
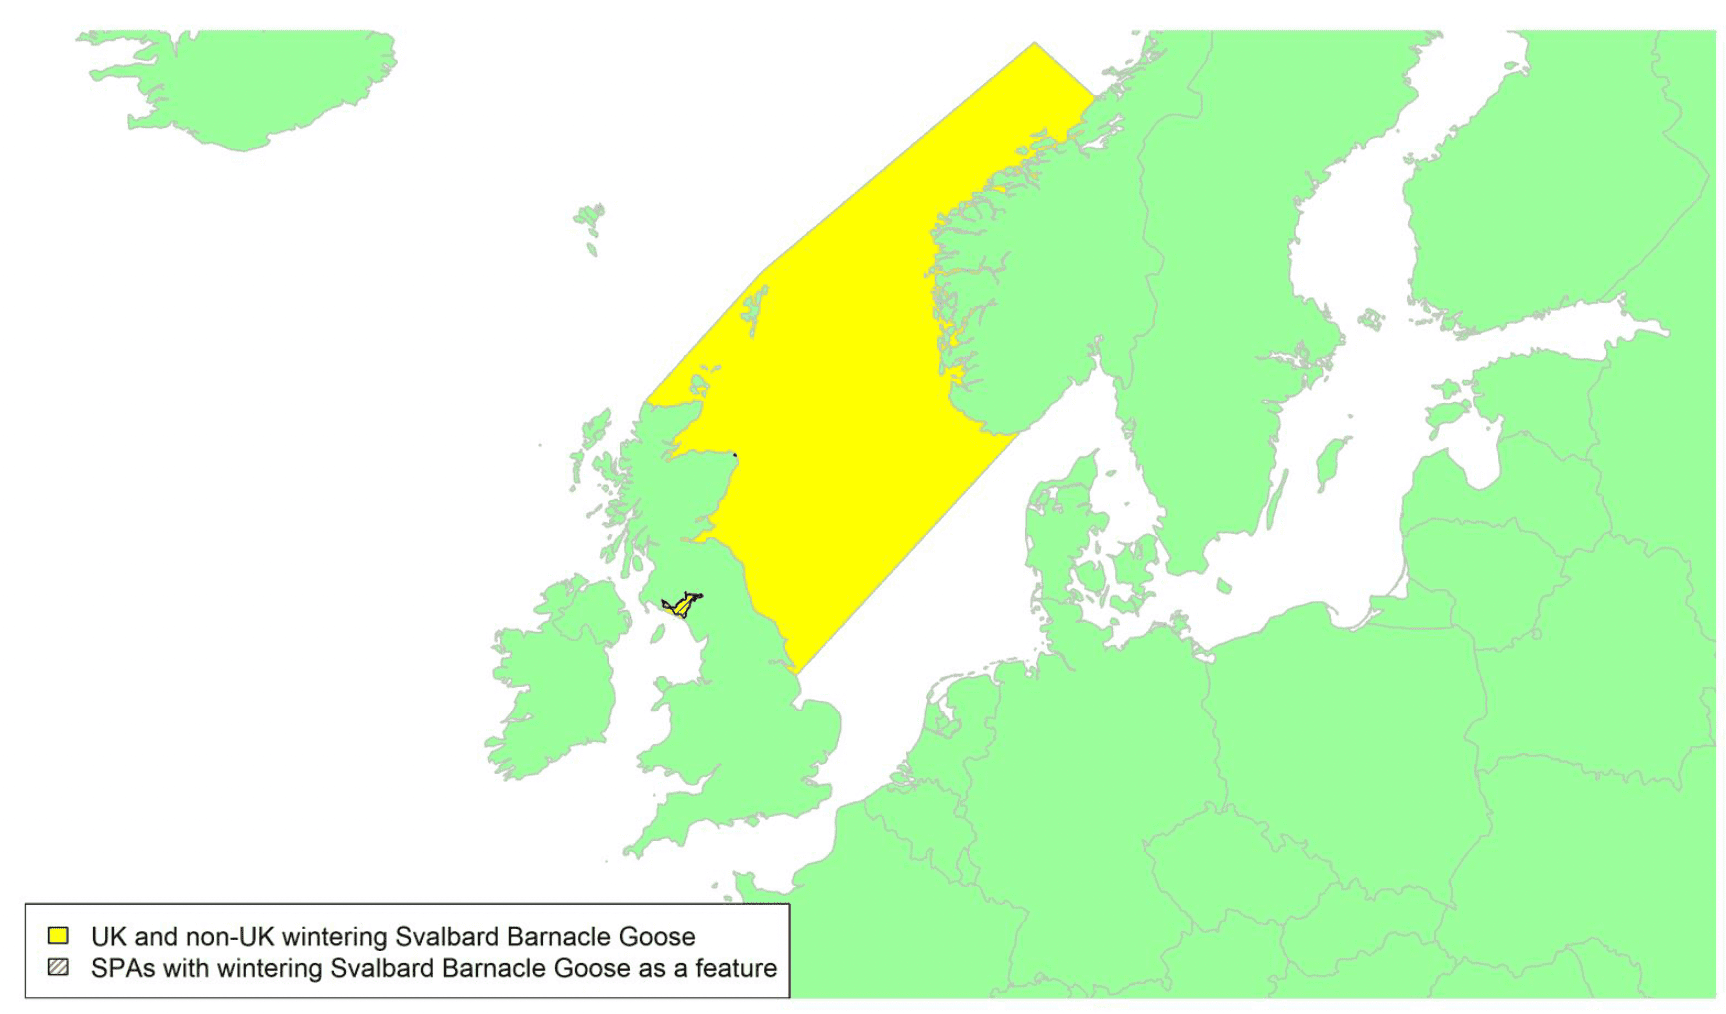
This population of Barnacle Geese breeds on Svalbard and the UK supports the entire wintering population, with the majority wintering on the Solway Firth on the border between Cumbria, England and Dumfries & Galloway, Scotland. Different proportions of the population linger on the east coast after arrival in England (e.g., at Budle Bay/Lindisfarne, Northumberland) and Scotland (e.g., Aberlady Bay and Loch of Strathbeg) in different years. During the mid-winter period from mid-October to mid-April almost 100% of the population can be on the Scottish side of the Solway due to high tides forcing the birds from Cumbrian saltmarshes, but in contrast almost 100% of the population can gather on Rockcliffe Marsh, Cumbria, prior to spring migration from mid-April (Griffin, 2020). Recent tracking data suggest birds staging in the Budle Bay area finally move to the Solway by February or March, prior to spring migration in late April or May.
There have been extensive tracking studies covering 38 individuals from the Solway wintering population and covering 78 migratory tracks (54 spring and 24 autumn) across 9 years (2006 to 2020). There is an associated high degree of confidence in these data and as shown in Appendix 1, they indicate that migration routes are concentrated in the North Sea along a front extending from Bamburgh and North Berwick on the east coast to the SW region of Norway with the front tending to be narrower in spring as some birds can migrate direct from the breeding grounds on Svalbard to NE Scotland in autumn. The birds will therefore cross the areas of water which are shaded yellow on the above map.
Barnacle Geese wintering on the Solway Firth (and Budle Bay, though these move to the Solway in late February/March; Griffin, 2020), UK, are predominantly from the Svalbard breeding population but also include an unknown number of naturalised UK breeding birds from e.g., the Highland Wildlife Park, Kingussie, Loch Leven and possibly the Lake District and elsewhere (tracking data and colour ring re-sighting data; Griffin, 2020; Mitchell et al. 2021).
During spring migration, the birds typically depart Rockcliffe Marsh, Cumbria, and head northeast to arrive along a fairly narrow front between Bamburgh and North Berwick on the east coast. There they may pause for a few hours before heading across the North Sea, and especially the outer Firth of Forth area, heading for the southwestern tip of Norway between Bergen and Stavanger, where they continue to follow the coast northeast to the staging areas of Helgoland or Vesterålen or any of the offshore islands in between (Griffin et al. 2011). If arriving further south in Norway the birds can take the high mountain passes to reach these coastal staging areas (WWT data). From mid-May they progress to Svalbard to breed and moult.
The autumn migration is essentially the reverse of the spring migration but with the birds arriving in the UK across a much broader front, depending on wind conditions during the crossing with birds arriving anywhere along the east coast from the Humber up to the Shetland Isles (Griffin et al. 2011). The geese remain in Svalbard until the first snows or freezing conditions push them out and this can occur at any time between 1 September and 10 October (WWT data). Depending on conditions the birds may continue to the Norwegian coast (where they tend to stop over for one or two days rather than the weeks seen in spring) or the UK direct or they may stage on Bjørnøya, Svalbard, for up to 3 weeks (WWT data). Large congregations of many thousands occur in the Budle Bay area or at sites such as Aberlady Bay and Loch of Strathbeg where foggy conditions can ground the birds for weeks. Usually, these gatherings last less than 24 hours and the geese progress rapidly to the Solway arriving by day or night, sometimes on mass. If the geese are grounded in Norway on uncut silage fields or on stubbles near Budle Bay then the full composite of birds may not arrive back on the Solway until November (from Norway) or even March (from Budle Bay) in exceptional years, though for the last 5 years, short-stopping at the Budle Bay/Lindisfarne NNR area for 2,000 birds or more until late February/March seems to be a developing trend (Griffin, 2020).
Timing of migration
Confidence: High
The geese depart in three or four main migratory pulses from mid-April through until mid-May with some birds lingering into June. The birds mostly depart between 17:00-23:00, crossing over land within two hours, and depending on wind conditions, arriving on the east coast between the Firth of Forth and Lindisfarne area, where they may pause on the sea near to the coast or proceed overnight on migration to south-west Norway. The journey from the Solway to Norway takes 7–24 hours, though typically 8–13, and the North Sea crossing may be completed in 6 hours, mostly in the hours of darkness (Griffin et al. 2011). Birds leaving the Solway after mid-May tend to bypass the staging areas and head straight for Svalbard and may complete the journey in just over 48 hours. The birds mostly depart under dry, high-pressure conditions (mostly high and rising), of good visibility and calm or following winds (Griffin et al. 2011). If persistent sea fog or 'haar' conditions are encountered on the east coast, the birds continue migration by gaining height and migrating over the fogbank or by deviating around it and perhaps heading as far south as the Humber before crossing the North Sea (Griffin et al. 2011).
The BirdTrack graphs for Barnacle Goose (see Appendix 2) cannot be reliably interpreted for this population as they incorporate results from all Barnacle Geese and therefore also include birds from the East Greenland population and naturalised birds resident in the UK.
Flight heights
Confidence: Medium
A mean flight height for Barnacle Goose of 45 m (95% CI 39-52 m) was estimated using a rangefinder during daylight for spring crossings of the Baltic Sea (Kahlert et al. 2012). Griffin et al. (2011) recorded a total of 305 GPS fixes with altitude data (range = -21 – 677 m) for Svalbard Barnacle Geese during their spring and autumn migrations across the North/Norwegian/Barents Sea zones during periods of daylight and darkness. The mean flight height (± S.E.) above sea level, was 81 m (± 8 m), with a median flight height of 16 m and a modal flight height in the 0–20 m band. Seventy-seven "neg alt" values recorded by the MTI tags were replaced with negative height values for calculating the mean and median values (substituted by those drawn at random from a half-normal distribution provided online at www.wessa.net "Free Statistics and Forecasting Software" based on 'R' code routines, where the mean of the distribution was set = 0 with an SD = 10 and the distribution truncated from infinity to ± 22 m). Offshore values had been filtered to be more than 20 km from the UK coastline and more than 20 km from the Norwegian/Svalbard coastline. Despite known limitations in the accuracy of these telemetry height estimates, the data, as with the Kahlert et al. (2012) study suggest that longer passages over open oceans are usually undertaken at relatively low heights.
More recently very high-quality continuous GPS height data have been collected using Ornitela tags for Barnacle Geese migrating from the Solway, but these have not been analysed for the current report.
Reflecting the fact that mean and median flight height estimates estimated using both GPS tags and laser rangefinders place birds within the collision risk window of existing offshore wind farms (assumed to be 22-300 m above sea level), it is recommended that for the purposes of collision risk modelling, 100% of birds are assumed to be at collision risk height.
Flight speeds
Confidence: High
Groundspeeds for Barnacle Geese, as for all birds, will depend on wind velocity and direction (Safi et al.2013), with birds sometimes unable to progress towards their destination if encountering strong headwinds, but travelling rapidly if assisted by tailwinds. Groundspeeds under relatively benign conditions of light to moderate tailwinds are typically 19-25 m/s but can reach 33–36 m/s at times of greater wind-assist (Griffin et al. 2011). Across three studies, flight/airspeeds of barnacle geese of c.16-17 m/s were recorded as mean or median values using radar, theodolite, or instantaneous GPS measures (Alerstam et al. 2007; Pennycuick et al. 2013; Safi et al. 2013).
Distance/time calculations carried out for the present study, using tracking data from UK-tagged Svalbard Barnacle Geese (943 speed estimates from 56 tracks), gave a median groundspeed of 17.46 m/s (min 0.71 m/s, max 41.90 m/s).
Given the consistency of flight speed estimates for Barnacle Geese, it is recommended that the speed of 17.46 m/s ± 2.08 estimates using distance/time calculations carried out as part of this study is used for the purposes of collision risk modelling.
Avoidance rates and behaviour
Confidence: Very Low
Recommend values for all geese species range from 0.68 to 1, with values of 0.99-1 typically accepted by statutory agencies such as Natural England and NatureScot (0.998, Scottish Natural Heritage, 2017). The lower value of 0.68 was based on panorama scans at Egmond aan Zee Offshore Windfarm in the Netherlands which highlighted a substantial proportion of the flight paths of geese and swans deflecting to avoid entering the windfarm (Krijgsveld et al. 2011).
Previous comparisons of predicted and observed collision rates for geese suggest within-windfarm rates of avoidance are likely to be high. Analysis of these datasets and others collected subsequently reinforces this with a within-windfarm avoidance rate estimated from post-construction monitoring data for all geese of 0.999 (Table 5). Based on these analyses, an avoidance rate of 0.9998 ± 0.00001 is recommended for use in relation to collision risk modelling.
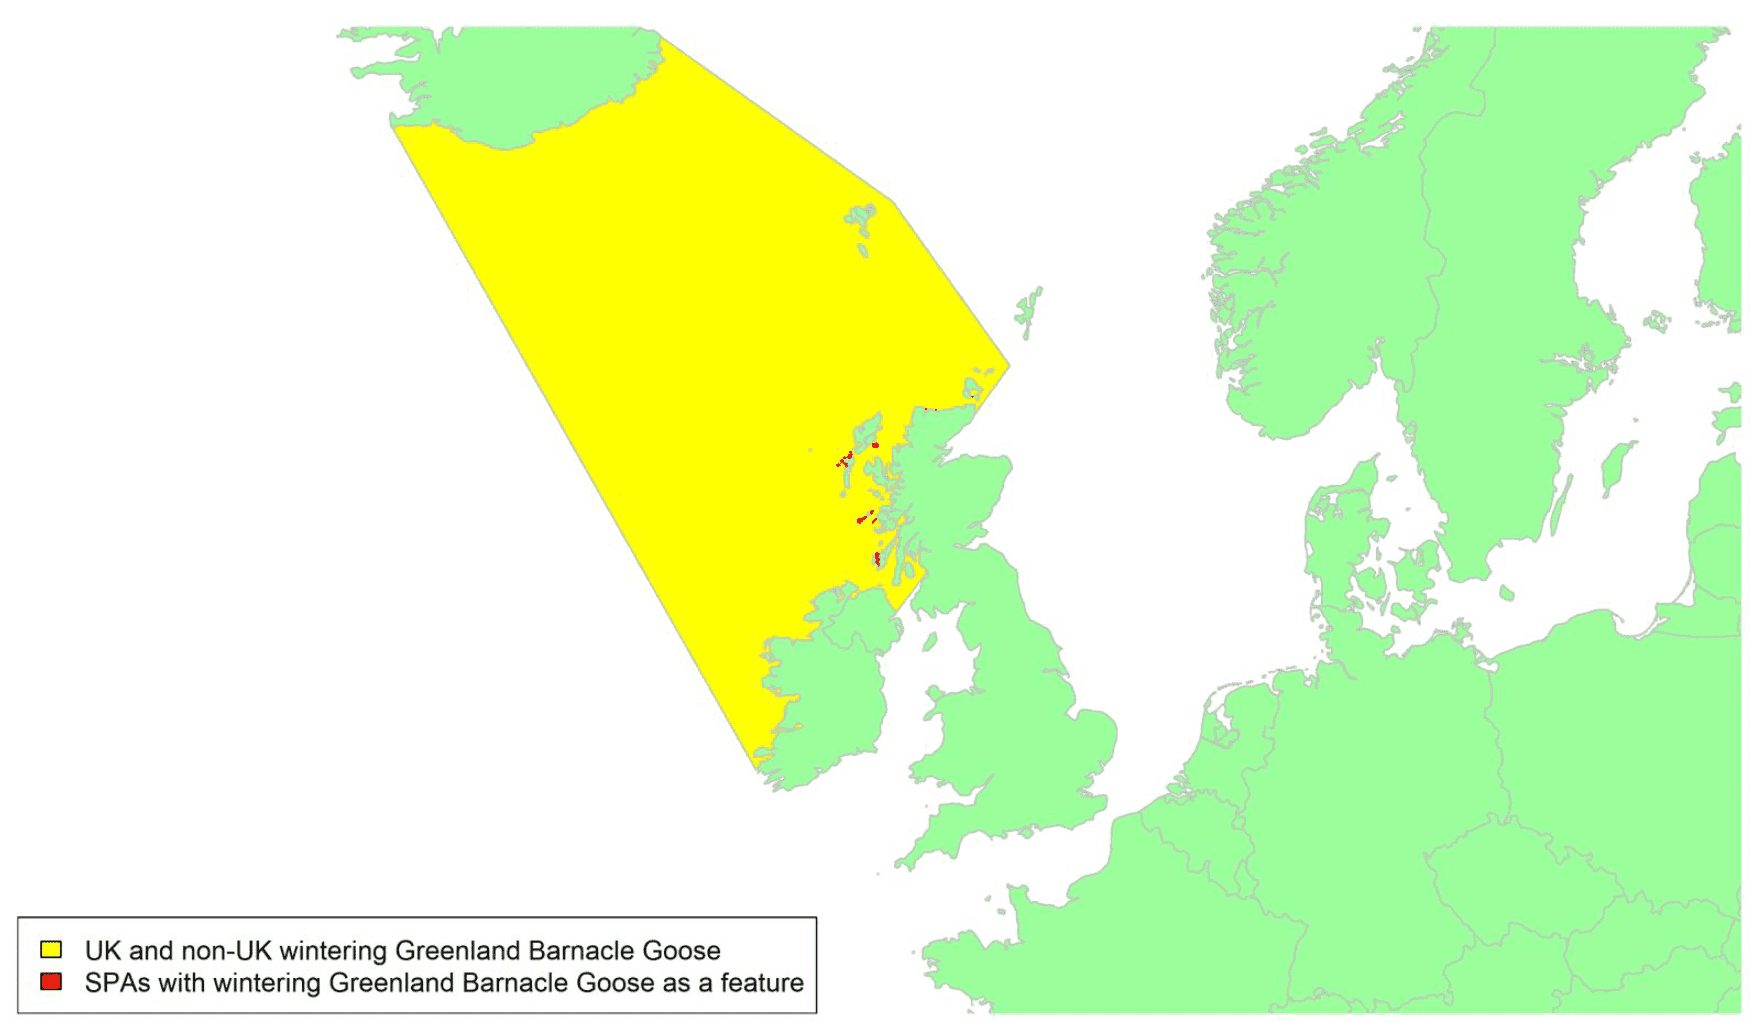
'Greenland' Barnacle Goose (East Greenland/Scotland & Ireland) Branta leucopsis
SPA Species? |
Yes (non-breeding population) |
|---|---|
SPA site codes (Introduction, Table 2) |
104:111:131:140:164:171:172:183:185:189:191 |
Population size breeding (UK) |
n/a |
Population size non-breeding (UK) |
56,000 individuals (APEP 4, 2020); uncertainty: low |
Population size (Biogeographic flyway, SPA season) |
72,000 individuals (East Greenland/Scotland & Ireland, non-breeding); uncertainty: low (Wetlands International, 2021) |
Percentage of biogeographical population at risk of collision in UK waters (passage / breeding / non-breeding) |
100%; uncertainty: low |
Movement of wintering birds
Migratory routes
Confidence: High
This population of Barnacle Goose breeds along the coastal fringe of eastern Greenland. Scotland supports nearly 80% of the wintering population of Greenland Barnacle Geese with the majority wintering on Islay. The c.20% wintering in the Republic of Ireland (Mitchell & Hall 2013) are mostly found on the islands of the northwest coast such as the Inishkeas, and many pass through sites such as the Uists, Coll/Tiree and Islay during autumn migration, and to a lesser extent during spring (WWT data). Consequently, c.100% of the biogeographic population could be potentially at risk of collision with wind turbines in UK waters.
There have been fairly extensive tracking studies covering 28 individuals from the Irish and Scottish wintering populations and covering 43 migratory tracks (25 spring and 18 autumn) across four years (2008 to 2020). There is an associated high degree of confidence in these data and as shown in Appendix 1, they indicate that migration routes are concentrated in the North Atlantic migratory corridor extending across a front from northwest Ireland and northwest Scotland to the south coast of Iceland for birds moving between their wintering areas in Ireland and Scotland and staging areas in Iceland with the front tending to be narrower in spring than in autumn.
Most Irish birds will pass through UK waters during the spring migration to Iceland, tending to arrive on the south-west coast of Iceland. The main focus of the Scottish population on Islay (c.60% of the Scottish population) will often stage on the Uists for up to a week before completing the migration to Iceland, typically arriving on the southeast coast of Iceland. The geese move to northern areas of Iceland as soon as they are snow free before migrating to the breeding and moulting areas in northeast Greenland in early May. Up to 2,000 pairs of barnacle geese now breed in southern Iceland (Mitchell & Hall 2020) and these winter at sites used by the Greenland birds in Scotland and Ireland, the two breeding populations freely intermixing on the wintering grounds. A bird from the naturalised Strathspey population has also been recorded within this flyway in Iceland (Mitchell et al. 2021).
The autumn migration is essentially the reverse of the spring migration but with the birds arriving in the UK across a broader front and starting from a more centrally southern position on the Icelandic coast, with birds sometimes occurring on non-SPA sites on Orkney or at Loch of Strathbeg in small numbers alongside Svalbard birds, depending on wind conditions during the crossing.
Greenland Barnacle Geese will therefore cross the areas shown in yellow on the above map.
Timing of migration
Confidence: High
The geese depart the UK and Ireland in the first and second weeks of April with most of the population arriving in southern Iceland by mid-April though arrivals can occur up to the start of May. In autumn the birds start arriving back in the UK and Ireland from the start of October with the migratory period extending to mid-month. The Islay geese tend to depart in the evening and reach areas such as the Uists within 2-3 hours. The route across the North Atlantic to Iceland typically takes 12-24 hours and may be attempted direct from Islay or Irish island sites such as Inishkeas over a period of 36 hours, often with pauses on the sea for periods of sleep or due to poor weather (WWT data; Pennycuick et al. 2011).
The BirdTrack graphs for Barnacle Goose (see Appendix 2) cannot be reliably interpreted for this population as they incorporate results from all Barnacle Geese and therefore also include birds from the Svalbard population and naturalised birds resident in the UK. The Solway graph is likely to most accurately reflect the movements of this population despite the small numbers of naturalised birds present. This graph supports the timings given above.
Flight heights
Confidence: Medium
A mean flight height for Barnacle Geese of 45 m (95% CI 39-52 m) was estimated using a rangefinder during daylight for spring crossings of the Baltic Sea (Kahlert et al. 2012). Griffin et al. (2011) recorded a total of 305 GPS fixes with altitude data (range = -21 – 677m) for Svalbard Barnacle Geese during their spring and autumn migrations across the North/Norwegian/Barents Sea zones during periods of daylight and darkness. The mean flight height (± SE) above sea level, was 81 m (± 8 m), with a median flight height of 16 m and a modal flight height in the 0–20 m band. Seventy-seven "neg alt" values recorded by the MTI tags were replaced with negative height values for calculating the mean and median values (substituted by those drawn at random from a half-Normal distribution provided online at www.wessa.net "Free Statistics and Forecasting Software" based on 'R' code routines, where the mean of the distribution was set = 0 with an SD = 10 and the distribution truncated from infinity to ± 22 m). Offshore values had been filtered to be more than 20 km from the UK coastline and more than 20 km from the Norwegian/Svalbard coastline. Despite known limitations in the accuracy of these telemetry height estimates, the data, as with the Kahlert et al. (2012) study suggest that longer passages over open oceans are usually undertaken at relatively low heights.
More recently very high-quality continuous GPS height data have been collected using Ornitela tags for barnacle geese migrating from the Solway, but these have not been analysed for the current report.
Reflecting the fact that mean and median flight height estimates estimated using both GPS tags and laser rangefinders place birds within the collision risk window of existing offshore wind farms, it is recommended that for the purposes of collision risk modelling, 100% of birds are assumed to be at collision risk height.
Flight speeds
Confidence: High
Groundspeeds for Barnacle Geese, as for all birds, will depend on wind velocity and direction (Safi et al.2013), with birds sometimes unable to progress towards their destination if encountering strong headwinds, but travelling rapidly if assisted by tailwinds. Groundspeeds under relatively benign conditions of light to moderate tailwinds are typically 70-90 k/h but can reach 120-130 k/h at times of greater wind-assist (Griffin et al. 2011). Across three studies flight/airspeeds of Barnacle Geese of c.16-17 m/s (c.60 k/h) were recorded as mean or median values using radar, theodolite, or instantaneous GPS measures (Alerstam et al. 2007; Pennycuick et al. 2013; Safi et al. 2013).
Distance/time calculations carried out for the present study, using tracking data from UK-tagged Greenland barnacle geese (933 speed estimates from 39 tracks), gave a median groundspeed of 17.29 m/s (min 0.01 m/s, max 31.83 m/s).
Given the consistency of flight speed estimates for Barnacle Geese, it is recommended that the speed of 17.29 m/s ± 2.08 estimates using distance/time calculations carried out as part of this study is used for the purposes of collision risk modelling.
Avoidance rates and behaviour
Confidence: Very Low
Recommend values for all geese species range from 0.68 to 1, with values of 0.99-1 typically accepted by statutory agencies such as Natural England and NatureScot (0.998, Scottish Natural Heritage 2017). The lower value of 0.68 was based on panorama scans at Egmond aan Zee Offshore Windfarm in the Netherlands which highlighted a substantial proportion of the flight paths of geese and swans deflecting to avoid entering the windfarm (Krijgsveld et al. 2011).
Previous comparisons of predicted and observed collision rates for geese suggest within-windfarm rates of avoidance are likely to be high. Analysis of these datasets and others collected subsequently reinforces this with a within-windfarm avoidance rate estimated from post-construction monitoring data for all geese of 0.999 (Table 5). Based on these analyses, an avoidance rate of 0.9998 ± 0.00001 is recommended for use in relation to collision risk modelling.
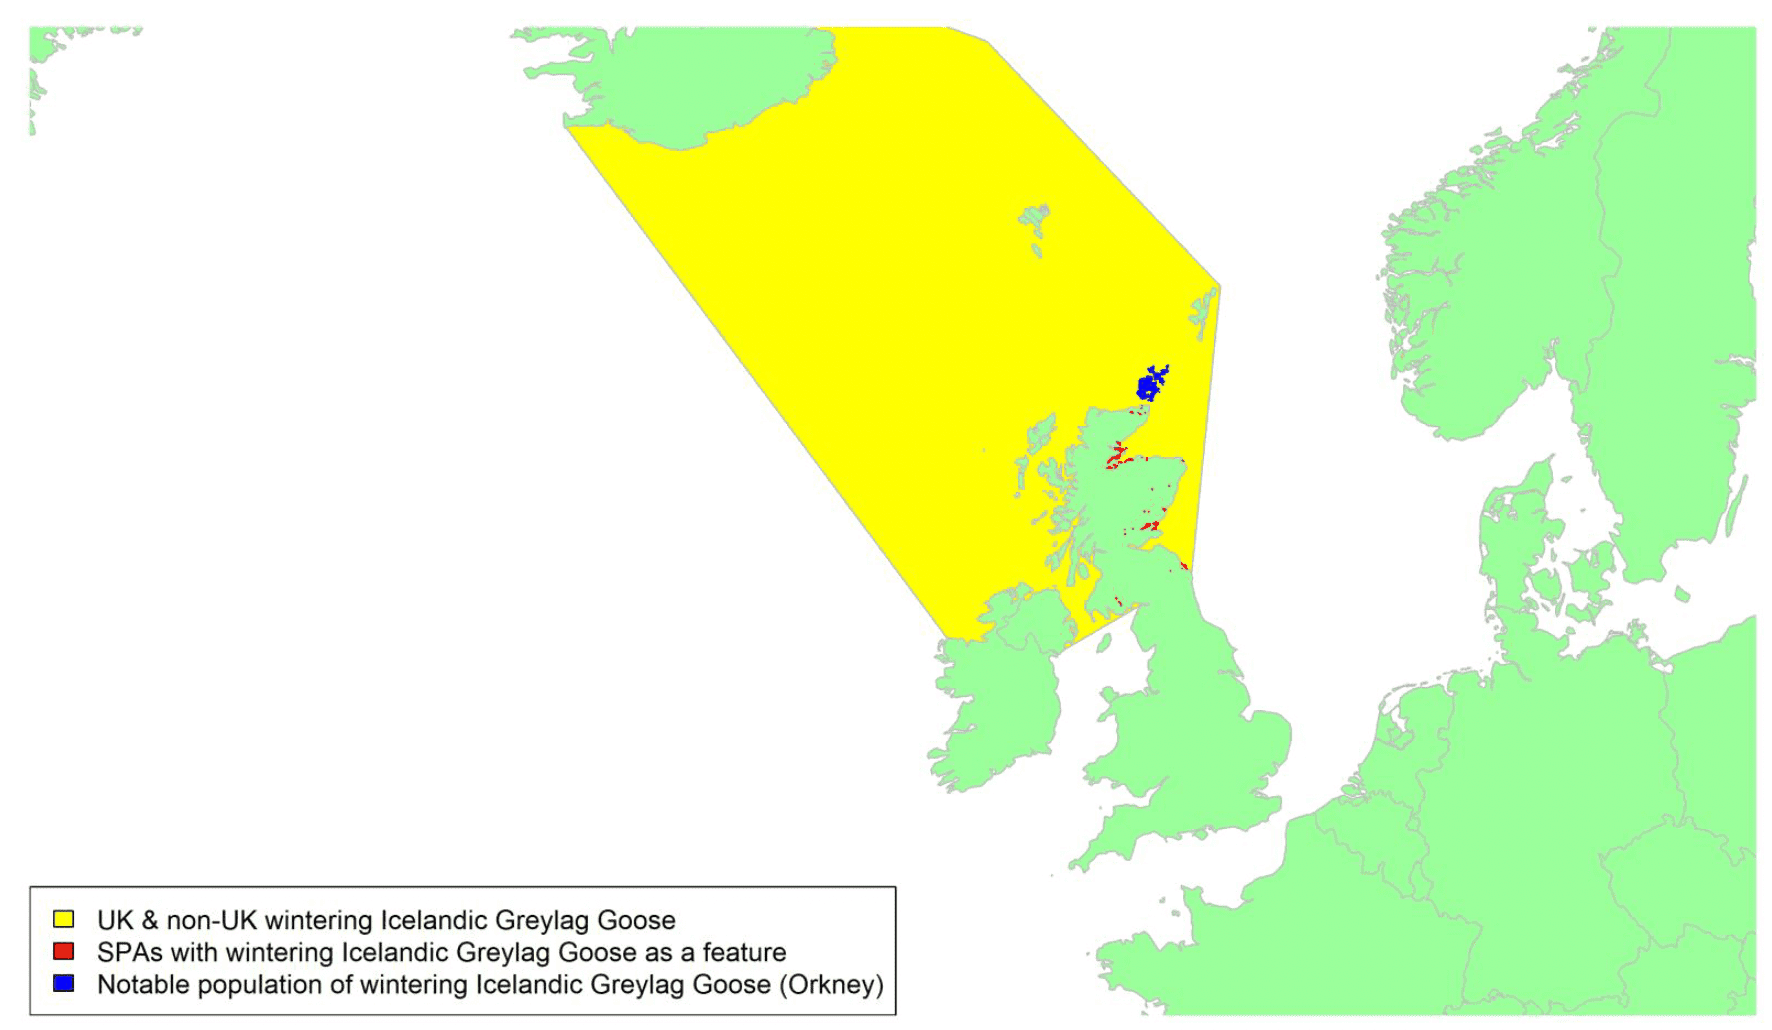
'Icelandic' Greylag Goose (Iceland/UK & Ireland) Anser anser
SPA Species? |
Yes (non-breeding population) |
|---|---|
SPA site codes (Introduction, Table 2) Other Important Aggregations (site codes) |
28:33:108:114:115:116:124:135:145:147:153:154:155:156:159:165:166:167:186 214 |
Population size breeding (UK) |
n/a |
Population size non-breeding (UK) |
60,000 individuals (IGC, 2020); uncertainty: medium |
Population size (Biogeographic flyway, SPA season) |
76,000 individuals (Iceland/UK & Ireland, non-breeding); uncertainty: medium (Wetlands International, 2021) |
Percentage of biogeographical population at risk of collision in UK (passage/breeding/non-breeding) |
90%; uncertainty: low |
Movement of wintering birds
Migratory routes
Confidence: Medium
Greylag Goose breeds across northern Europe and central Asia, with most populations being migratory but some populations in Europe, including part of the UK population, now resident. Resident Greylag Geese in the UK are joined in winter by birds from the Icelandic population which is considered here. Resident Greylag Geese are not considered in this account as they are not designated features of protected sites.
Iceland Greylag Goose numbers have decreased in recent years (Brides et al. 2021), hence the latest British population estimate given above is lower than the international population estimate which pre-dates it. This population winters almost exclusively in Scotland, with small numbers in north England, Ireland, and southwest Norway. There has been a dramatic shift in the wintering distribution of this population in the last twenty years with many former winter sites, including most of the SPAs, now abandoned, and the majority of birds now winter in north Scotland, especially in Orkney (Trinder et al. 2010).
There are a limited number of tracking studies covering 19 individuals from the Iceland population and 13 seasons in the period from 2014 to 2021 (with an ongoing NatureScot tracking study having deployed 19 tags in Iceland autumn 2021 with 33 planned for deployment in all). There is an associated high degree of confidence in these data and, as shown in Appendix 1, they indicate that the autumn migration routes generally take a direct line between Iceland and Scotland with the majority arriving in Orkney, Caithness, and the Moray Firth. Spring departures fly directly from Orkney and Caithness, and from other wintering localities. Note that the migration tracks, based on geese marked with GPS tags, are biased to the locations where the birds were ringed which were mostly in north and east Iceland. Birds breeding in south and west Iceland may well take slightly different routes (presumably to the south of the tracks shown in Appendix 1). The yellow shaded area in the above map shows the areas of water likely to be crossed by migrating Icelandic Greylag Geese (including the birds travelling from and to south and west Iceland).
Timing of migration
Confidence: Medium
Spring migration starts in late March with a peak in early to mid-April. The peak arrival dates in Iceland have gradually become earlier each year at a rate of approximately seven days per decade (1988-2009) (Gunnarsson & Tómasson, 2011). Lack of sufficient tracking data precludes analysis of departure times, although over-sea migration occurs during both night and day.
Autumn migration starts from mid-October through to mid-November, up to a month later than in the 1990s (IGC data). The causes for this change in timing are unknown but may be due to warmer autumns and an increase in the area of barley grown in Iceland, particularly in the southern lowlands, on which the geese feed. Several thousand Greylag Geese no longer pursue a migratory strategy and over-winter in Iceland.
Although BirdTrack graphs are shown for Greylag Goose (see Appendix 2), they include birds from the resident populations and hence the graphs for most regions cannot be interpreted in relation to movements of the Icelandic population. However, the graphs for Orkney, the North Coast and northeast Scotland show patterns which broadly agree with the above timings. Some of the other Scottish regions also show patterns suggesting they are influenced by movements of Icelandic Greylag Geese but are complicated by the presence of resident birds.
Flight heights
Confidence: Low
There is little information on typical flight heights of migratory Icelandic Greylag Geese. Patterson et al. (2012) reported that "long-distance flights" were at heights of over 150 m, but these were recorded over land and do not relate to movements over the sea. Estimations of flying heights from WWT telemetry data showed a mean height of 64 m (± 164 SD, n = 41) over the north Atlantic, although the values were skewed to lower heights with 59% of the heights below 10 m. Despite known limitations in the accuracy of these telemetry height estimates, the data suggest that longer passages over open oceans are usually undertaken at relatively low heights.
Taking into account the height of offshore wind turbines (i.e., >22 m above sea level), the mean reported flight height, and the skewed data, it is recommended that a precautionary assumption of 50% of flights at collision risk height is used for the purposes of collision risk modelling.
Flight speeds
Confidence: Medium
Three studies have recorded flight speeds for this species. A radar study in southern Sweden recorded a groundspeed of 17.1 m/s (± 2.6 SD, n = 21 tracks, Alerstam et al. 2007); a GPS study in Germany recorded groundspeeds of 11.3-15.8 m/s (183 flights of 5 birds, Gatt et al. 2019) and a theodolite study in the Baltic recorded a groundspeed of 19 m/s (± 1.9 SD, 22 runs, Pennycuick et al.2013). Flight speeds for Iceland Greylag Geese are dependent on wind velocity and direction (Safi et al. 2013), with birds sometimes unable to progress if encountering headwinds, but wind-assisted if migrating on tailwinds. In addition, simple calculations of groundspeed based on point-to-point GPS tracking data (>3 m/s, 10-100 km between locations) showed a mean flight speed of 12.0 m/s(± 4.9 SD, n = 116, WWT data), although this may be biased low due to the inability to detect rests between locations.
Flight speed estimates for Icelandic Greylag Geese appear to differ between GPS and other studies. In general, a lower flight speed will result in a higher probability of a bird colliding with a turbine blade (Masden et al. 2021). Consequently, given the available data, it is recommended that a speed of 12 m/s ± 4.9 derived from GPS data is used for the purposes of collision risk modelling.
Avoidance rates and behaviour
Confidence: Very Low
Recommend values for all geese species range from 0.68 to 1, with values of 0.99-1 typically accepted by statutory agencies such as Natural England and NatureScot (0.998, Scottish Natural Heritage 2017). The lower value of 0.68 was based on panorama scans at Egmond aan Zee Offshore Windfarm in the Netherlands which highlighted a substantial proportion of the flight paths of geese and swans deflecting to avoid entering the windfarm (Krijgsveld et al. 2011).
Previous comparisons of predicted and observed collision rates for geese suggest within-windfarm rates of avoidance are likely to be high. Analysis of these datasets and others collected subsequently reinforces this with a within-windfarm avoidance rate estimated from post-construction monitoring data for Greylag Geese of 0.9996 (Table 5). Based on these analyses, an avoidance rate of 0.9996 ± 0.00005 is recommended for use in relation to collision risk modelling.
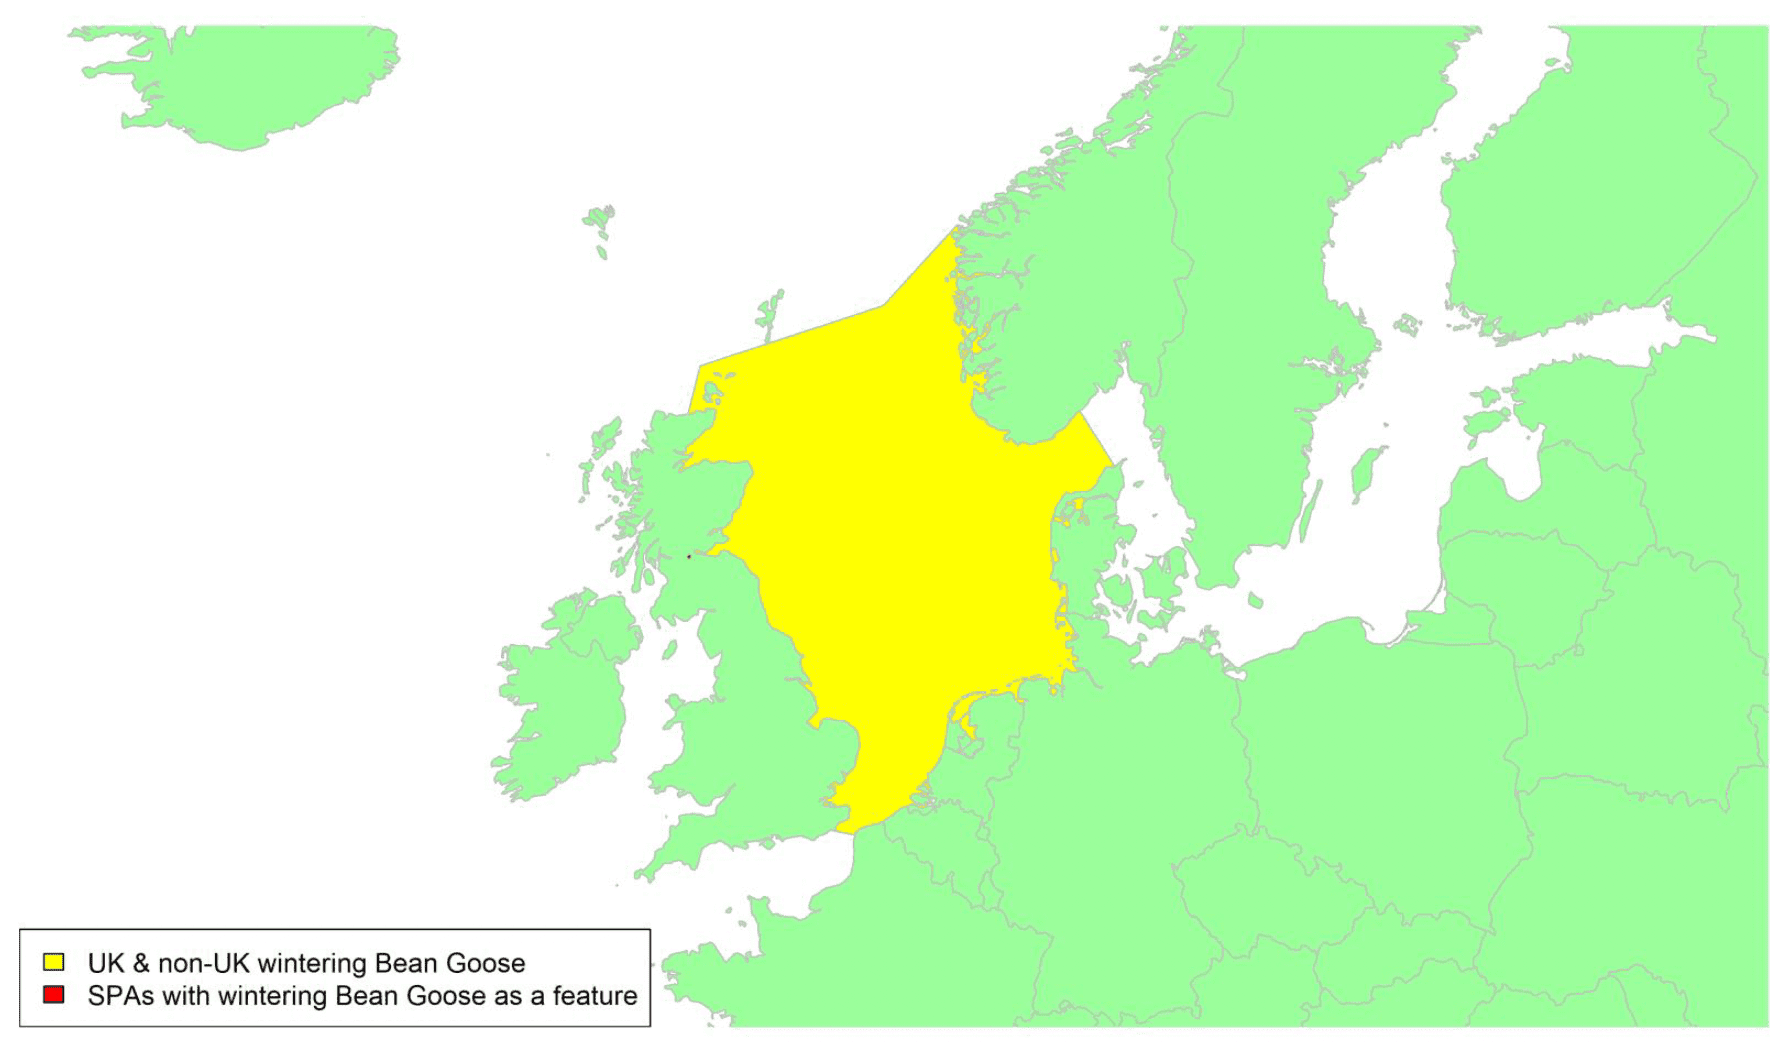
Taiga Bean Goose Anser fabalis
Scottish SPA Species? |
Yes (non-breeding population) |
|---|---|
SPA site codes (Introduction, Table 2) |
184 |
Population size breeding (UK) |
n/a |
Population size non-breeding (GB) |
230 individuals (WeBS); uncertainty: low |
Population size (Biogeographic flyway, SPA season) |
82,000–97,000 individuals (NE Europe/NW Europe, non-breeding); uncertainty: medium (Wetlands International, 2021) |
Percentage of biogeographical population at risk of collision in UK (passage/breeding/non-breeding) |
<1% (NE/NW Europe population, but c.15% of Western Management Unit; uncertainty: low |
Movements of wintering birds
Migratory routes
Confidence: Medium
Taiga Bean Geese breed from Scandinavia eastwards across northern Russia There are two main wintering sites in the UK: a small flock of geese (seven birds in 2019/20) in Norfolk, England, and a larger flock of approximately 220-240 birds at Slamannan, Scotland. These birds make up less than 1% of the NE Europe/NW Europe population of this species. However, Taiga Bean Geese wintering in the UK belong to the Western Management Unit which comprises approximately 1,500 birds and breed in central Sweden and Norway (Marjakangas et al. 2015). Consequently, around 15% of the birds from this management unit, which uses a flyway which is distinct from the rest of the population, could potentially be at risk of collision with wind turbines in UK waters.
A single tracking study provided telemetry data from 16 individuals covering 17 seasons between 2013 and 2021, and there is an associated high degree of confidence in these data, as shown in Appendix 1. In late winter/early spring, Taiga Bean Geese leave the wintering site at Slamannan, Falkirk and move to staging areas in northwest Denmark, southern Sweden, and southern Norway. The main route takes them east out of the Firth of Forth or further south across the northern Borders. The geese breed in central Sweden (Mitchell et al. 2016). In autumn, they leave the same staging areas and fly west across the North Sea. With favourable winds, the route can be relatively direct, but GPS tags have shown that some individuals are sometimes blown off course and arrive in east England, thereafter re-orientating and flying to Slamannan. Similar problems can also occur in spring. In spring 2018, three geese marked with GPS tags (and probably other unmarked birds) flew c.200 km east across the North Sea, but on meeting strong headwinds abandoned the crossing and drifted to Orkney. Two GPS-tagged birds, and probably other unmarked birds, re-orientated and flew back to Slamannan. Another waited ten days and then flew directly to Denmark (Mitchell et al. 2017). With this in mind, a broad migration corridor should be considered for this population, as shown by the yellow shading on the above map.
Timing of migration
Confidence: Medium
The geese leave Scotland from January (earliest 6 January in 2020) with the majority in early to mid-February. The date of departure appears to be earlier in the 2020s than in the 1990s (Bean Goose Action Group data). They return from the same staging areas in late September to mid-October, with some birds occasionally later. Movements are unlikely to occur in November and December. Over-sea migration occurs both during the day and night.
The BirdTrack data (see Appendix 2) include both this species and Tundra Bean Goose Anser serrirostris and hence the graphs for most regions cannot be used to assess movements of this species. The graph for Forth and Tay region, which is likely to relate with this species, broadly agrees with the timings given above, although it suggests that birds arrive in late October or early November.
Flight heights
Confidence: Low
In the absence of any flight height data for this species, it recommended that a precautionary assumption of 100% of flights at collision risk height is used.
Flight speeds
Confidence: Medium
Three studies have recorded flight speeds for this species. A radar study in southern Sweden recorded a groundspeed of 17.3 m/s (+/- 2.7 SD, n = 44 tracks, Alerstam et al. 2007) whilst a GPS study in Scandinavia recorded groundspeeds of 15.3-25.0 m/s (+/- 1.8-6.9 SD, n = 2 to 11, Boer, 2019). In Finland, a groundspeed of 18.9 m/s (n =" thousands of birds," Skyllberg et al. 2009) was estimated based on estimates of the length of time it took for birds to move between two different sites. Flight speeds for Bean Geese are dependent on wind velocity and direction (Safi et al. 2013), with birds sometimes unable to progress if encountering headwinds, but wind-assisted if migrating on tailwinds. In addition, simple groundspeed data based on point-to-point GPS tracking data (>3 m/s, 10-100 km between locations) showed a mean speed of 15.8 m/s(+/- 1.31, n = 32, WWT data), although this may be biased low due to the inability to detect rests between locations.
Given the consistency in flight speeds reported using GPS and the sample size of the studies contributing these data, it is recommended that a value of 15.8 m/s ± 1.31 is used for the purposes of collision risk modelling.
Avoidance rates and behaviour
Confidence: Very Low
Recommend values for all geese species range from 0.68 to 1, with values of 0.99-1 typically accepted by statutory agencies such as Natural England and NatureScot (0.998, Scottish Natural Heritage 2017). The lower value of 0.68 was based on panorama scans at Egmond aan Zee Offshore Windfarm in the Netherlands which highlighted a substantial proportion of the flight paths of geese and swans deflecting to avoid entering the windfarm (Krijgsveld et al. 2011).
Previous comparisons of predicted and observed collision rates for geese suggest within-windfarm rates of avoidance are likely to be high. Analysis of these datasets and others collected subsequently reinforces this with a within-windfarm avoidance rate estimated from post-construction monitoring data for all geese of 0.999 (Table 5). Based on these analyses, an avoidance rate of 0.9998 ± 0.00001 is recommended for use in relation to collision risk modelling.
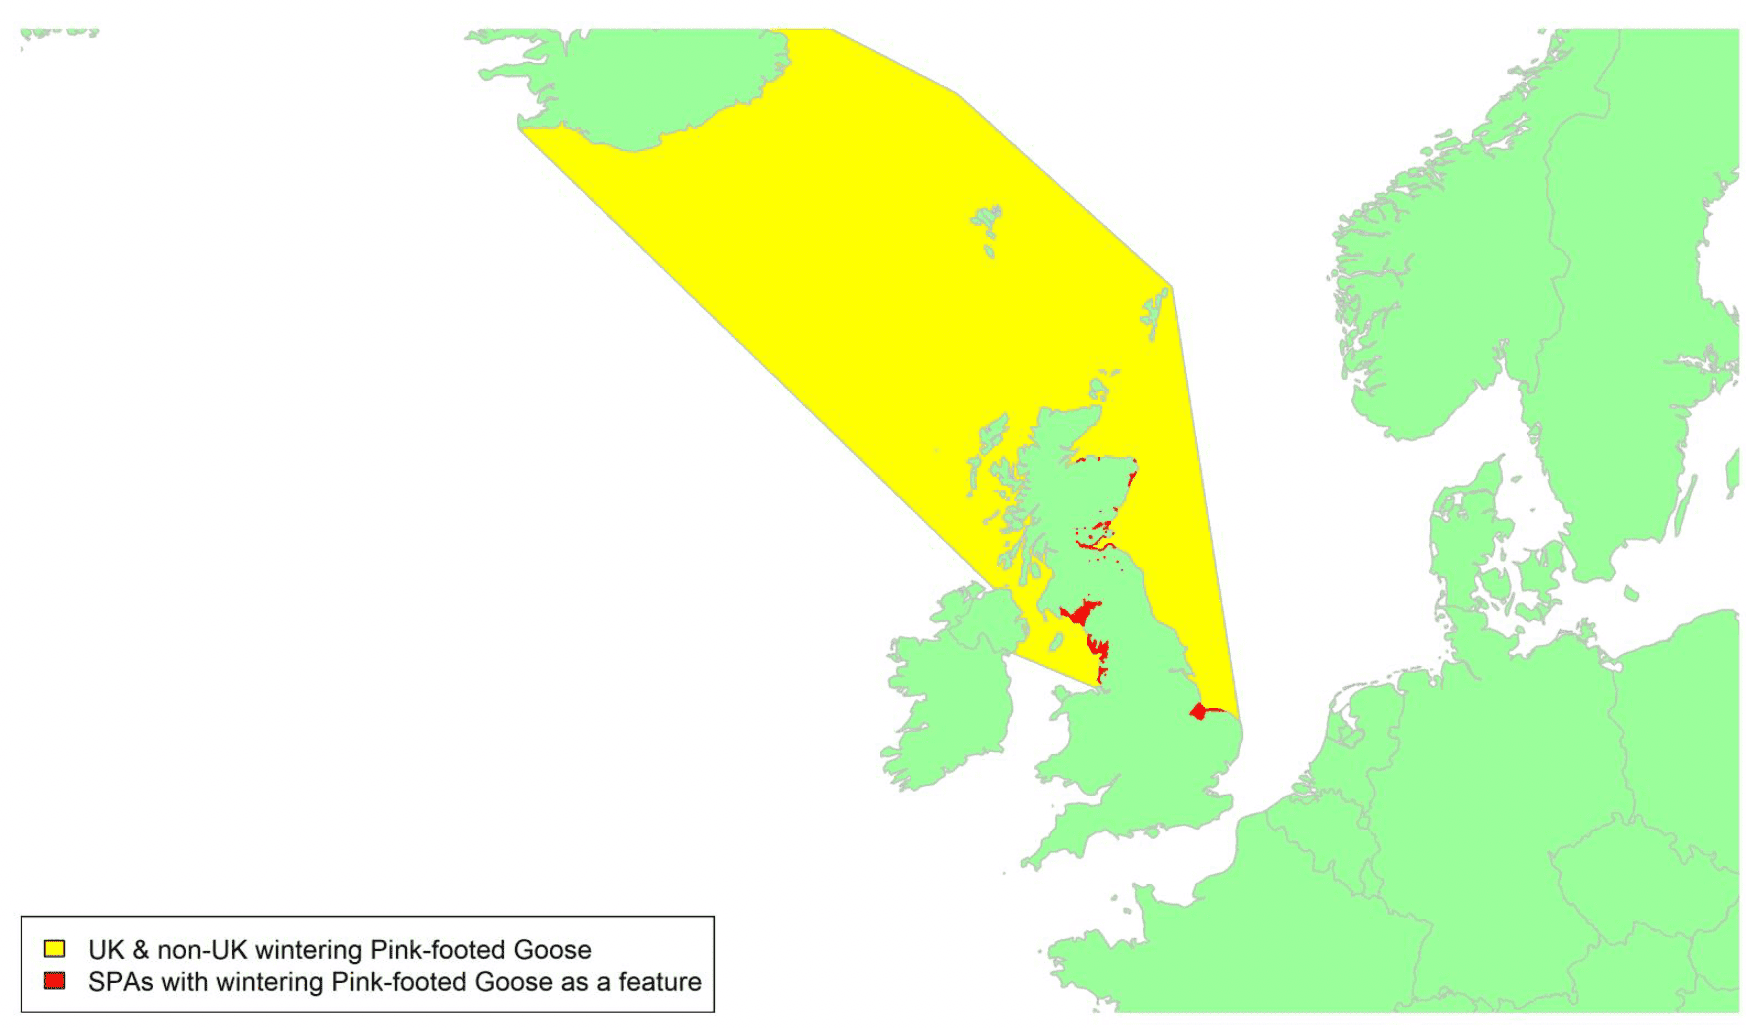
Pink-footed Goose (East Greenland and Iceland/UK) Anser brachyrhynchus
SPA Species? |
Yes (non-breeding population) |
|---|---|
SPA site codes (Introduction, Table 2) |
36:41:44:54:70:78:109:110:115:121:123:124:127:130:149:153:156:165:166:186:194:195 |
Population size breeding (UK) |
n/a |
Population size non-breeding (UK) |
510,000 individuals (APEP4, 2020); uncertainty: low |
Population size non-breeding (Biogeographic flyway, SPA season) |
500,000 individuals (East Greenland and Iceland/UK; CSR8), non-breeding; uncertainty: low |
Percentage of biogeographical population at risk of collision in UK waters (passage/breeding/non-breeding) |
100%; uncertainty: low |
Movement of wintering birds
Migratory routes
Confidence: High
Pink-footed Geese breed in Greenland, Iceland and Svalbard and winter in western Europe. The Svalbard population winter in continental Europe but the UK supports the entire wintering population of Iceland/Greenland Pink-footed Geese, and hence 100% of this population could potentially be at risk of collision with wind turbines during migration. The difference in the international and UK non-breeding population sizes are due to differences in the timing of reporting. The majority of Pink-footed Geese wintering in England stage in Scotland in the autumn and spring.
Pink-footed Geese wintering in the UK are from the Iceland and east Greenland breeding populations. Those breeding and moulting in Greenland stage at sites in Iceland both in spring and autumn. A single tracking study provided telemetry data from 70 individuals covering nine seasons from 2013 to 2021, and there is an associated high degree of confidence in these data, as shown in Appendix 1. The migration routes generally take a direct line between Iceland and Scotland/North England, albeit on a broad front, as shown by the yellow shaded areas on the map above. In autumn, the majority arrive at locations in Scotland, although a small proportion fly directly to locations in north England. After arrival at key staging areas in Scotland (e.g., Moray Firth, Montrose Basin etc.), many geese redistribute during the autumn to sites further south as far as Lancashire, the Humber and Norfolk. In late winter the birds move north again within Britain to sites, notably in north and northeast Scotland, prior to spring migration. Mass departures fly across the north and particularly northwest coasts of Scotland. There are some within-Britain movements across UK waters of larger estuaries and along coasts as birds redistribute.
Timing of migration
Confidence: High
Day length and local temperatures were found to determine departure decisions along a spring flyway on the continent for this species (Bauer et al. 2008); however, there appears to be some individual synchronicity between years in the UK wintering population (WWT data). The spring migration starts in the last week of March with the peak in mid-April and a small number of final departures in early May. Autumn migration from Iceland starts in early September, with peak migration in the last week of that month and the first week of October. The vast majority of Pink-footed Geese have left Iceland by the third week of October. BirdTrack data (see Appendix 2) broadly agree with the timings given above but suggest a more prolonged departure in spring in English regions commencing in January, perhaps indicating some movement north occurs within the UK during winter. However, the BirdTrack graphs are remarkably consistent across all UK regions in autumn, which suggests that most birds fly direct to the wintering areas.
Tracking data indicate that over-sea migration occurs during both night and day. Just under a half of spring departures (46%, n = 112, WWT data) from Scotland were between 04:00 and 07:00, presumably in the hours after first light, although departure occurred throughout the 24-hour period. If wind conditions are favourable, the crossing can be made in approximately nine hours, although several individuals took longer than 24 hours, after resting on the sea (WWT data).
There is considerable movement of this species over UK waters (e.g., Firth of Forth, Moray Firth, Irish Sea, east coast of England etc.) during September to April including both before spring and after autumn migration to/from Iceland. Further study is required to properly quantify this. Diel migration activity was concentrated during the daylight hours with only 15% of 979 flocks recorded during the hours of darkness (19:00 - 07:00) at an offshore site in east England (Plonczkier & Simms, 2012).
Flight heights
Confidence: Low
Two post construction studies used radar to record movements of Pink-footed Geese flying over the North Sea, near Skegness, Lincolnshire, with the identification confirmed by visual observation (Plonczkier & Simms, 2012): Flight heights ranged from 100 to 300 m, although the study site was only 5-8 km from the coast and mostly involved within-UK movements of birds. At Barrow, Cumbria, 98.2% of Pink-footed Geese were observed to gain flight height from approximately 20 m above the sea surface, when approaching a wind farm, suggesting that normal flying height is quite low (see avoidance below). Estimations of flying heights from WWT telemetry data showed a mean height of 12.8 m (+/- 221 m SD, n = 347) over the north Atlantic. Despite known limitations in the accuracy of these telemetry height estimates (dataset includes some negative values), the data suggest that longer passages over open oceans are usually undertaken at relatively low heights.
Taking into account flight height estimates of migrating birds from GPS tracking, it is recommended that a precautionary assumption of 50% of birds at collision risk height is used. However, the potential for birds to increase in altitude as they approach turbines in order to avoid collisions, as noted at Barrow, should also be considered. Such a response will presumably reduce collision risk, as the number of birds at collision risk height will be reduced.
Flight speeds
Confidence: Medium
Flight speeds for Pink-footed Geese are dependent on wind velocity and direction (Safi et al. 2013), with birds sometimes unable to progress if encountering headwinds, but wind-assisted if migrating on tailwinds. Basic groundspeed estimates based on point-to-point GPS tracking data (>3 m/s) showed a mean speed of 16.9 m/s(+/- 0.16 SE, n = 2040, WWT data), although this may be biased low due to the inability to detect rests between locations.
Based on these data, it is recommended that a value of 16.9 m/s ± 0.16 is used for the purposes of collision risk modelling.
Avoidance rates and behaviour
Confidence: Low
Two cases of potential macro-avoidance have been recorded; 97.25% of 571 flocks recorded by radar at Skegness, UK, migrated without any risk of additional mortality by strong horizontal and vertical avoidance behaviour (Plonczkier & Simms, 2012); 98.2% of 503 birds avoided eight turbines at Barrow, UK, with the majority of the geese approaching at a flight height above 20 m gaining height approximately 2-3 km before the wind farm and passing the wind farm well above the turbines (BOWind, 2008).
Previous comparisons of predicted and observed collision rates for geese suggest within-windfarm rates of avoidance are likely to be high. Analysis of these datasets and others collected subsequently reinforces this with a within-windfarm avoidance rate estimated from post-construction monitoring data for Pink-footed Geese of 0.9999 (Table 5). Based on these analyses, an avoidance rate of 0.9999 ± 0.00002 is recommended for use in relation to collision risk modelling.
'Greenland' White-fronted Goose (Greenland/Ireland & UK) Anser albifrons flavirostris
SPA Species? |
Yes (non-breeding population) |
|---|---|
SPA site codes (Introduction, Table 2) |
108:111:119:131:138:140:147:150:152:179:185:206 |
Population size breeding (UK) |
n/a |
Population size non-breeding (UK) |
11,500 individuals (APEP 4, 2020); uncertainty: low |
Population size (Biogeographic flyway, SPA season) |
21,500 individuals (Greenland, non-breeding); uncertainty: low (Wetlands International, 2021) |
Percentage of biogeographical population at risk of collision in UK waters (passage / breeding / non-breeding) |
100%; uncertainty: low |
Movement of wintering birds
Migratory routes
Confidence: High (but lower for some parts of the Scottish range)
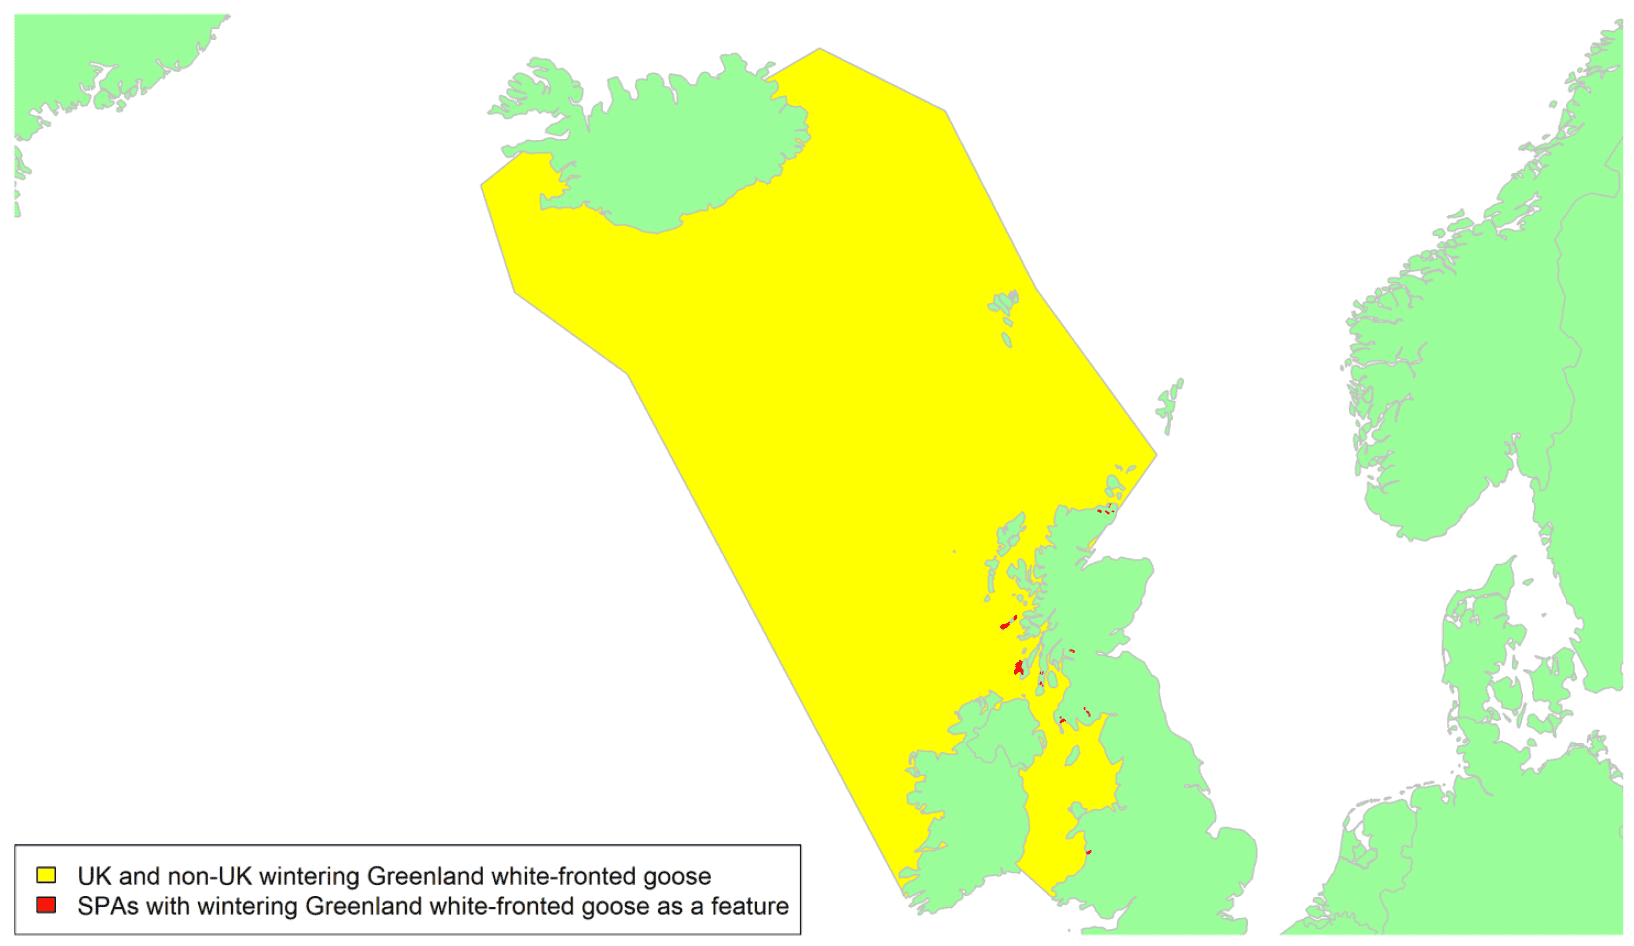
The 'Greenland White-fronted Goose' breeds along the south-west edge of Greenland. Scotland typically supports c.50% of the wintering population with c.50% of those wintering on Islay. The population in Scotland is mainly confined to the west coast and islands being distributed across c.25 traditional wintering locations, with the sub-population on Islay also being faithful to c.25 known roosts and associated home ranges (Griffin et al. 2020). The remaining 50% of the population winter in the Republic of Ireland and are mostly found on the Wexford Slobs in southeast Ireland. These birds will tend to stage at UK localities such as Islay or the Uists and pass through UK waters during migration. Two very small sub-populations each of less than 20 birds exist in northwest Wales near the coast. Consequently, the entire biogeographic population could potentially be at risk of collision with wind turbines in UK waters.
Extensive tracking data are available from 94 individuals from the Scottish (and two for the Welsh) wintering populations, covering 246 migratory tracks (150 spring and 96 autumn) across eight years of study (2013 to 2020). There is an associated high degree of confidence in these data and as shown in Appendix 1, they indicate that migration routes are concentrated in the North Atlantic migratory corridor extending across a front from Northern Ireland to northwest Scotland to the south coast of Iceland for birds moving between their wintering areas in Scotland and staging areas in south-west Iceland with the front tending to be narrower in spring than in autumn. Irish birds tend to migrate further to the west in spring than Scottish birds, unless staging at Scottish sites before progressing to Iceland, where they typically stage at more westerly sites than Scottish birds. The areas crossed by both Scottish and Irish wintering birds are shown in yellow on the map above.
Greenland White-fronted Geese associated with many (c.40%) of the sub-population wintering sites have now been tracked by WWT and others, but there are some smaller more northerly sites within Scotland for which the migratory routes used by the birds remain unknown. However, they are likely to mirror those tracked elsewhere in Scotland. The biggest knowledge gap is with regard to the routes taken by those birds using the cluster of wintering locations in northeast Scotland in Caithness and Orkney.
Most Irish birds will pass through UK waters during the spring migration to Iceland, tending to arrive on the south or east coasts, and often they will stage in areas such as Islay, Tiree or the Uists though sometimes wind patterns will push them further east through mainland Scotland such that they exit the UK at points along the north coast (WWT data). Birds from many of the more southerly Scottish sites and those in Wales will also stage at these west coast island sites if frontal rain or more northerly winds prevent migratory progress.
The birds gain height on the east coast of Greenland before heading over the mile high icecap to breed and moult on the mid-west coast and inland area extending to the ice cap, the Wexford birds breeding further north than the Scottish ones.
In what is essentially a reverse of the spring migration, the birds head back to Iceland from Greenland before returning to the UK, with Scottish birds arriving across a much broader front and sometimes being blown as far east as Norway (WWT data).
Timing of migration
Confidence: High
The Greenland White-fronted Geese depart the UK in the last week of March through to mid-April, with the Wexford birds further south in Ireland having departed 7-10 days earlier. The birds may stage on the Outer Hebrides / Na h-Eileanan Siar for up to a week and then complete the Atlantic crossing to Iceland in 10–48 hours with birds sometimes pausing on the sea for periods of sleep or due to poor weather with the birds seeking refuge on the Faroes, or even being pushed to Denmark, if weather conditions deteriorate (WWT data; Pennycuick et al. 2011). Migrations from the wintering areas tend to be initiated in the evening, with the sea crossing mostly occurring at night or in the early morning within UK waters though it can occur during all hours of the day.
The birds feed up in Iceland for four to six weeks before heading west to Greenland from the start of May with all birds away from Iceland by mid-May. From the final week of August to the first week of September as snow and ice returns to west Greenland the birds start heading back to Iceland though the ice cap crossing can take up to seven days to complete during unfavourable wind conditions. Once in Iceland the birds often stage well into November and sometimes as late as December in relatively warm autumns supported by late or poor agricultural harvests. In autumn, Irish birds will again stage in Scottish parts of the wintering range, such as Islay, before moving to Ireland (WWT data).
The BirdTrack data (see Appendix 2) broadly agree with the timings given above, although they suggest that some birds do start to arrive in the UK in late October or early November. Note that the BirdTrack graphs do not separate data for Greenland and European White-fronted Geese. However, the graphs for the Scottish regions, Northern Ireland, Wales, and northwest England will mostly involve records of Greenland White-fronted Geese.
Flight heights
Confidence: Medium
During spring 2008, four birds tracked using backpack MTI GPS tags recorded flight heights above the sea when moving from Loch Ken to the Outer Hebrides/Na h-Eileanan Siar ranging from c.0 m (tag recorded measure as "neg alt") to 173 m (N = 9 readings). On crossing the open ocean to Iceland only "neg alt" values were recorded suggesting the birds were flying at, or very close, to sea level (Griffin et al. 2011).
Assessments of flight heights have been made by three other studies and range from a mean of 78 ± 39 m (N = 133 flocks assessed via video triangulation) (Sugimoto & Matsuda, 2011) to 96 ± 48 m (N = 20 birds assessed via clinometer and range finder) (Wulff et al. 2016) to 165 m (N = 31 spring GPS tracks) to 323 m (N = 27 autumn GPS tracks) (Kölzsch et al. 2016) for White-fronted Goose subspecies in Japan, the U.S. and Europe respectively but these heights are for flights over land and where potential obstacles existed (e.g. onshore wind turbines between a roost and feeding areas in the Japanese study).
More recently very high-quality continuous GPS height data have been collected using Ornitela tags for Greenland White-fronted Geese migrating from/to Scotland, but these have not been analysed for the current report.
From a sample size of 133 flock movements in Japan, the proportion at potential collision risk height (35-115 m) was estimated as 0.802 (Sugimoto & Matsuda, 2011). From a sample size of 20 in the USA, the proportion at potential collision risk height (32-124 m) was estimated at 0.7 (Wulff et al. 2016).
Given the recorded altitudes of migrating white-fronted geese, and the height of offshore turbines, it is recommended that 100% of birds at collision risk height would reflect a precautionary estimate for collision risk modelling.
Flight speeds
Confidence: High
Groundspeeds for Greenland White-fronted Geese, as for all birds, will depend on wind velocity and direction (Safi et al.2013), with birds sometimes unable to progress towards their destination if encountering strong headwinds, but travelling rapidly if wind-assisted by tailwinds. Groundspeeds recorded for Greenland White-fronted Geese during spring migration from Loch Ken to the Outer Hebrides/Na sh-Eileanan Siar ranged from c.8.3-16.6 m/s as measured by instantaneous GPS for four birds. During the open ocean crossing to Iceland this ranged from 10-15 m/s (wind speed and direction not given for these migratory legs; Griffin et al. 2011). Across three studies of flight/airspeeds for other white-fronted goose subspecies, mean or median speeds of c.16-18 m/s were recorded using radar, theodolite, or instantaneous GPS measures (Alerstam et al. 2007; Pennycuick et al. 2013; Safi et al. 2013).
Distance/time calculations carried out for the present study, using tracking data from UK-tagged Greenland white-fronted geese (2,122 speed estimates from 117 tracks, WWT Data), gave a median groundspeed of 18.75 m/s (SD 7.19, min 0.14 m/s, max 43.51 m/s).
Reflecting the available sample sizes, it is recommended that the GPS flight speed estimates obtained from WWT data of 18.75 m/s (SD 7.19) be used for the purposes of collision risk modelling.
Avoidance rates and behaviour
Confidence: Very Low
Values range from 0.68 to 1, with values of 0.99-1 typically accepted by statutory agencies such as Natural England and NatureScot (0.998, Scottish Natural Heritage, 2017). The lower value of 0.68 was based on panorama scans at Egmond aan Zee Offshore Windfarm in the Netherlands which highlighted a substantial proportion of the flight paths of geese and swans deflecting to avoid entering the windfarm (Krijgsveld et al. 2011).
Previous comparisons of predicted and observed collision rates for geese suggest within-windfarm rates of avoidance are likely to be high. Analysis of these datasets and others collected subsequently reinforces this with a within-windfarm avoidance rate estimated from post-construction monitoring data for all geese of 0.999 (Table 5). Based on these analyses, an avoidance rate of 0.9998 ± 0.00001 is recommended for use in relation to collision risk modelling.
'European' White-fronted Goose (NW Siberia & NE/NW Europe) Anser albifrons albifrons
SPA Species? |
Yes (non-breeding population) |
|---|---|
SPA site codes (Introduction, Table 2) |
40:62:79 |
Population size breeding (UK) |
n/a |
Population size non-breeding (UK) |
2,100 individuals (APEP4, 2020) |
Population size (Biogeographic flyway, SPA season) |
1,000,000–1,200,000 individuals (NW Siberia & NE/NW Europe population, non-breeding); uncertainty: medium (Wetlands International, 2021) |
Percentage of biogeographical population at risk of collision in UK waters (passage/breeding/non-breeding) |
<1%; uncertainty: low |
Movement of wintering birds
Migratory routes
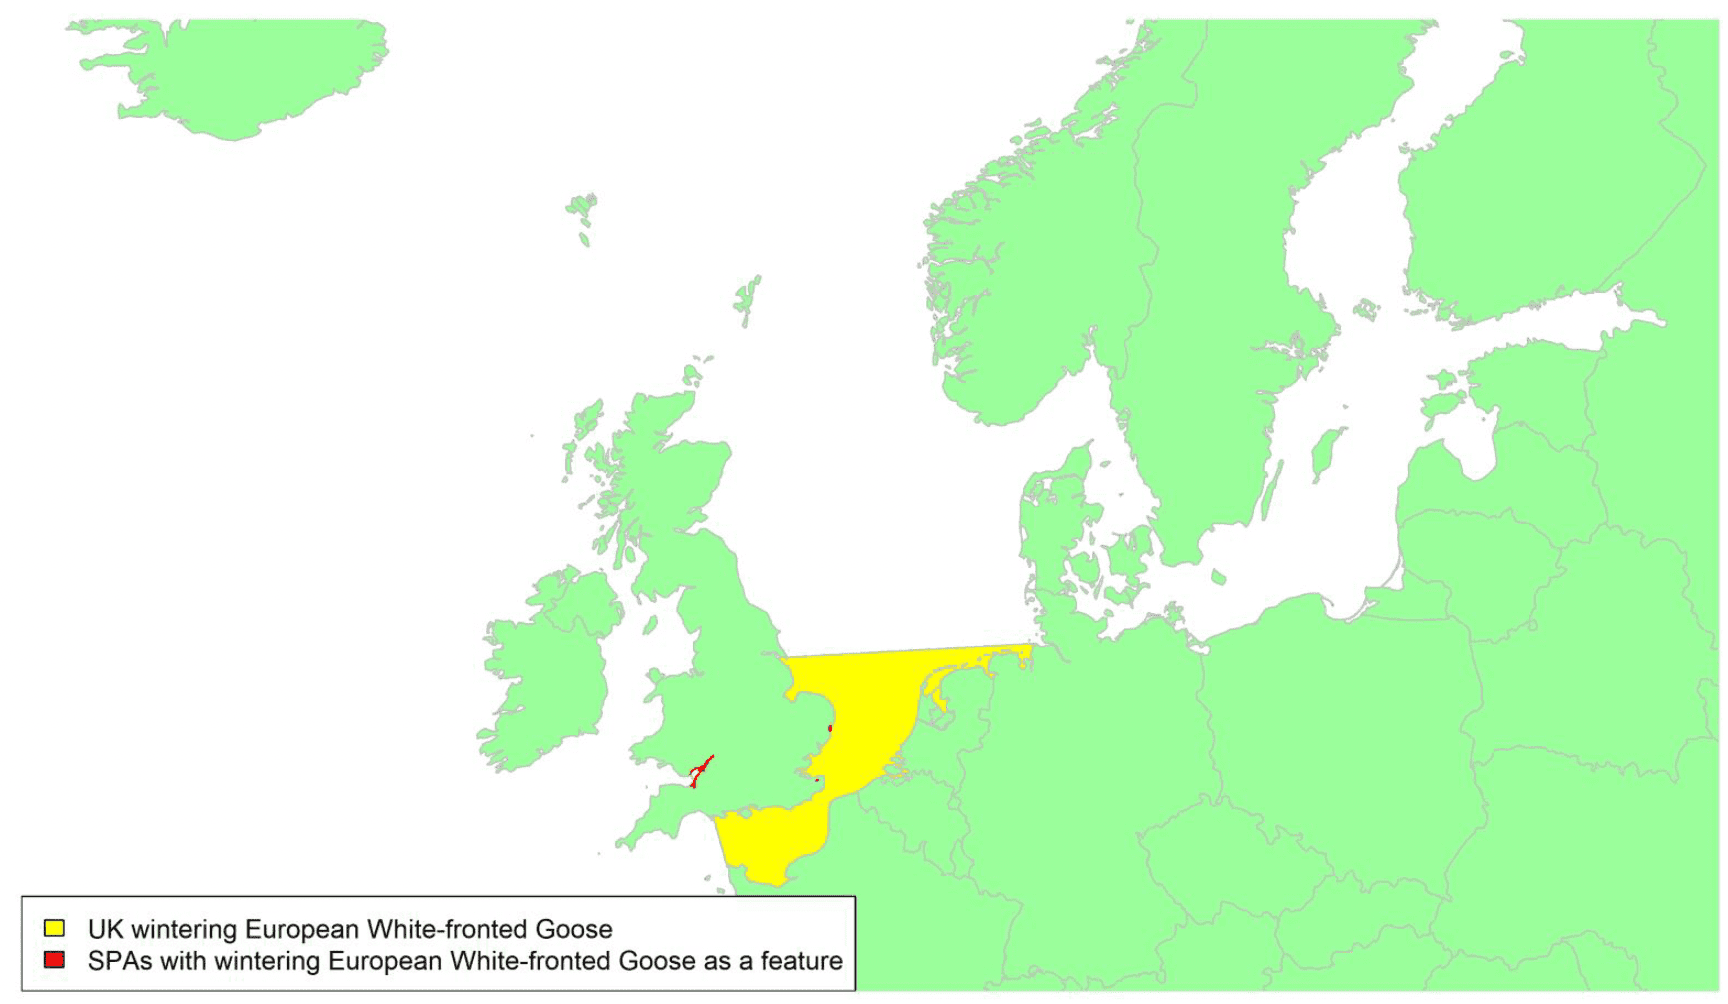
Confidence: Low
The 'European White-fronted Goose' nests in western and central Siberia and migrates to northwest and central Europe to winter. The principal wintering areas are the Netherlands, Germany, and Belgium, with the UK forming the most westerly part of the range. Numbers wintering in the UK in the early 2020s (c.2,100 birds) are fewer than in the 1960s, when a peak of 13,000 was recorded in 1969 (Owen et al. 1986). Consequently, the UK now accounts for a small fraction of the flyway population with less than 1% of the population potentially at risk of collision with wind turbines in UK waters. The most important sites in the UK for this population in 2015/16 – 2019/20 were Heigham Holmes, the North Norfolk Coast and the Swale Estuary in Essex.
Their migration route to Britain is across the southern North Sea between the Netherlands and eastern England, as shown by the yellow shaded area on the above map. Although over one hundred European White-fronted Geese from this population in northwest Europe have been fitted with telemetry devices, only one has crossed the southern North Sea to winter in the UK (H. Kruckenberg, pers. comm.). Information on flight speed and height whilst crossing maritime waters in northwest Europe are not available for this individual.
Timing of migration
Confidence: Medium
European White-fronted Geese arrive between November and early February and return to staging areas in the Netherlands in March. Observations at coastal sites indicate that movements peak between mid-December and mid-January (Trektellen). However, there is probably little or no movement of European White-fronted Geese within UK waters once the geese have arrived at their wintering grounds.
The BirdTrack data (see appendix 2) broadly agree with the timings given above, although they suggest that some birds may start to arrive in the UK from early October. Note that the BirdTrack graphs do not separate data for Greenland and European White-fronted Geese. However, the graphs for the east, southeast and south of England will mostly involve European White-fronted Geese.
Flight heights
Confidence: Low
Kölzsch et al. (2017) reported a mean flight height of 165 m (maximum 1,237 m) for 31 tracks of geese from this population on spring migration and a mean flight height of 323m (maximum 2,768 m) for 27 tracks on autumn migration. In Japan, a mean flight height of 78 m (± 38.9 SD) was recorded for 133 flock movements, although these were over land (Li et al. 2020). A clinometer and rangefinder study in America found a mean flight height of 96.1 m (± 47.9 SD; range 26-189.4 m) for the closely related frontalis population (Wulff et al 2016).
Estimated mean flight heights for European White-fronted Geese are well within the rotor sweep of planned and existing offshore wind turbines. For this reason, it is recommended that a precautionary assumption of 100% of flights at collision risk height is used for the purposes of collision risk modelling.
Flight speeds
Confidence: Medium
There are several studies on typical flight speeds of migratory European White-fronted Geese. Five radar tracks recorded a mean groundspeed of 16.1 m/s (± 2 SD) in southern Sweden (Alerstam et al. 2007). Kölzsch et al. (2017), found a mean groundspeed of 19 m/s for 53 tracks of geese marked with GPS units from this population on spring migration and a mean groundspeed of 19.8 m/s for 49 tracks on autumn migration. A theodolite study recorded groundspeeds of 17.8 m/s (± 2.4 SD) based on 10 runs over the Baltic (Pennycuick et al. 2013) and four birds were tracked using GPS units recorded median groundspeeds of 16 m/s (Safi et al. 2013).
Reflecting the relative sample sizes of these studies and the fact they reflect the whole migration zone, rather than being limited to coastal regions, it is recommended that an estimate of 19 m/s is used for the purposes of collision risk modelling. However, this study does not report any measure of variation surrounding the estimated mean flight speed. Given estimates from other species, we suggest a standard deviation of 2 m/s is considered for European White-fronted Geese.
Avoidance rates and behaviour
Confidence: Very Low
Recommend values for all geese species of 0.99-1 typically accepted by statutory agencies such as Natural England and NatureScot (0.998, Scottish Natural Heritage, 2017). Panorama scans at Egmond aan Zee Offshore Windfarm in the Netherlands highlighted a substantial proportion of the flight paths of geese deflecting to avoid entering the windfarm (Krijgsveld et al. 2011).
Previous comparisons of predicted and observed collision rates for geese suggest within-windfarm rates of avoidance are likely to be high. Analysis of these datasets and others collected subsequently reinforces this with a within-windfarm avoidance rate estimated from post-construction monitoring data for all geese of 0.999 (Table 5). Based on these analyses, an avoidance rate of 0.9998 ± 0.00001 is recommended for use in relation to collision risk modelling.
Bewick's Swan Cygnus columbianus bewickii
SPA Species? |
Yes (non-breeding population) |
|---|---|
SPA site codes (Introduction, Table 2) |
3:5:11:12:21:34:36:37:42:48:54:59:70:74:79:89 |
Population size breeding (UK) |
0 pairs (APEP4, 2020); uncertainty: low |
Population size non-breeding (UK) |
4,317 individuals (Beekman et al. 2019); uncertainty: low |
Population size (Biogeographic flyway, SPA season) |
20,100 individuals (Beekman et al. 2019, non-breeding) ; uncertainty : low |
Percentage of biogeographic population at risk of collision in UK waters (passage / breeding / non-breeding) |
21.8%; uncertainty: low |
Movement of wintering birds
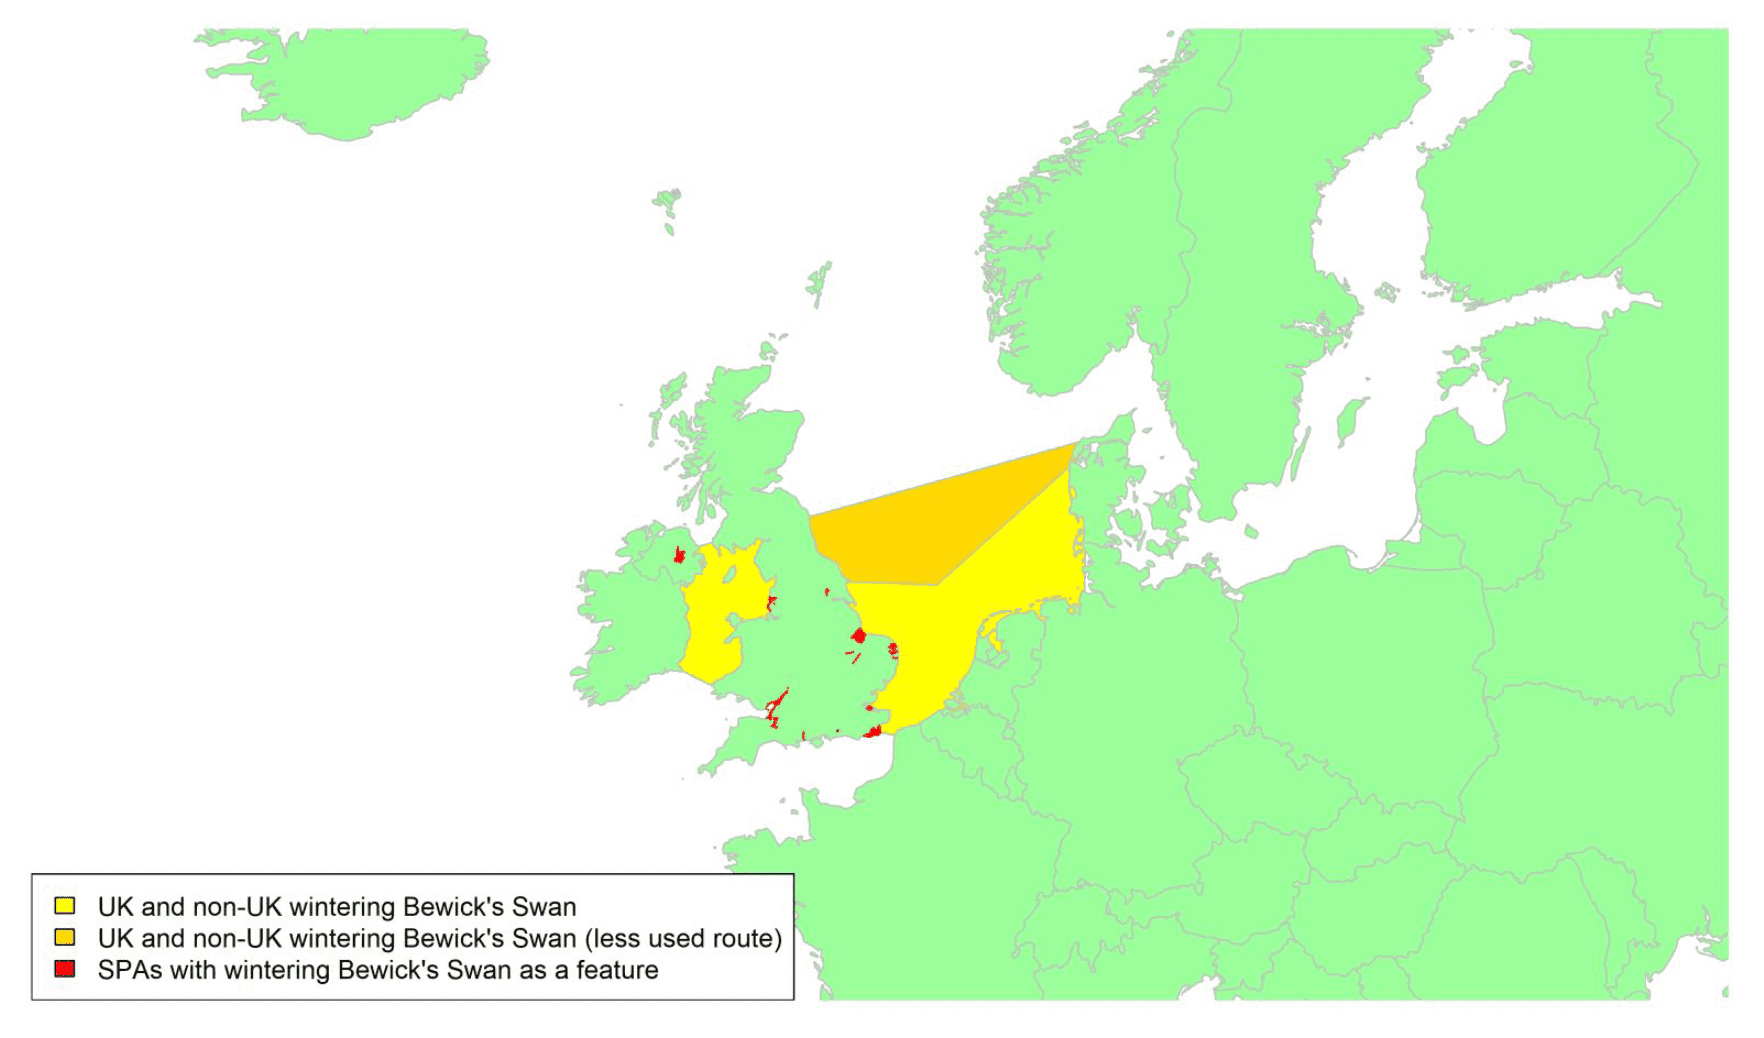
Migratory routes
Confidence: High
The Bewick's Swan is considered a subspecies of Tundra Swan C. columbianus and breeds on the tundra across the north of Russia. The NW European Bewick's Swan population migrates from breeding grounds in the Russian Arctic to winter in temperate western Europe, mostly in Britain, the Netherlands and Germany, with some birds continuing to wintering locations in Ireland. The effects of climate change are particularly evident in this species, with a higher proportion of the population now remaining in more easterly parts of the wintering range (e.g., in Germany) during mid-winter ('short-stopping'), and only a handful of birds now reach Ireland compared to more than 1,000 wintering there during the 1980s. The percentage of the population wintering in the UK has likewise declined over the past decade, to 21.5% in the January 2015 swan census (Beekman et al. 2019). Including the small numbers of swans wintering in Ireland, around 22% of the biogeographic population could therefore be potentially at risk from collision with wind turbines in UK waters. Preliminary information from the January 2020 swan census suggest that the short-stopping trend is continuing (IUCN-SSC Swan Specialist Group unpubl. data) and hence the proportion at potential risk may now be lower. Analysis of resighting data has provided further insight into the range shift, with Bewick's Swans found to frequent areas where air temperatures are c. 5.5° (Nuijten, Vriend, et al. 2020).
Distribution within the UK is also more southerly than it was historically (Rees, 2006; Robinson et al. 2004); consequently, movement between Britain and mainland Europe is thought to be mainly between the Low Countries and southeast England, although migration direct from staging areas in Denmark may also occur. Some SPAs which include Bewick's Swans as a qualifying species (e.g. Martin Mere, and Loughs Neagh & Beg) have not received internationally important numbers of Bewick's Swans during the 21st century (Worden et al. 2013).
Given that Bewick's Swans migrating to the UK now mostly winter in southern England, it is likely that the main migration route is between the Netherlands and East Anglia, as shown by the yellow shaded area on the above map, although some birds may cross the North Sea slightly further to the north, as shown by the orange area. Twenty tracks across the North Sea (18 spring; two autumn) provided by individuals fitted with Ecotone GPS-GSM loggers in south-west and southeast England during winters 2013/14–2014/15, and a further three spring tracks for birds fitted with Ornitela GPS-GSM loggers in winter 2018/19, all show that birds depart over the East Anglia coast (Griffin et al. 2016; Rees et al. 2019)( Appendix 1). Only one individual took a slightly different route during autumn 2015, when it came in over the Thames estuary (on heading briefly to the Dungeness SPA) before returning to the Netherlands (Griffin et al. 2016).
The tracking data show that the swans may fly not only in the vicinity of UK wind farms but also those in Dutch and German coastal waters (Griffin et al. 2016), emphasising the importance of taking an international perspective during cumulative impact assessments for a declining species, classed as Endangered in NW Europe (Birdlife International, 2017; Nagy et al. 2012).
Timing of migration
Confidence: High
The first Bewick's Swans of the winter usually reach the UK in mid-October, but the main migration period is from November to December, with the swans utilising northeasterly tail winds to facilitate migration (Evans, 1979). Departure on spring migration is from mid-February to mid-March, and is also influenced by wind direction with the swans generally not migrating into headwinds (Evans, 1979; Rees, 1982). Onset of migration tends to occur at the start and end of the day, with tagged birds departing from 06:43-09:49 and from 18:15-00:24 in both spring and autumn (Griffin et al. 2016). The BirdTrack data (see Appendix 2) broadly agree with the timings above and show similar arrival and departure patterns across all the English regions in which this species occurs. Occasional records in Scottish regions are likely to relate to misplaced birds.
In addition to the range shift (short-stopping) noted in association with climate change, the timing of arrival and departure in the wintering area has changed markedly in recent decades, with the time spent by Bewick's Swans at the wintering grounds having reduced ("short-staying") by c.38 days since 1989 (Nuitjen et al. 2020). Individuals tended to be consistent in their migratory timing in winter, indicating a generational shift in migration phenology, whereas for short-stopping there was evidence both for individual plasticity (individuals decreasing their migration distances over their lifetime) and a generational shift (Nuitjen et al. 2020).
Flight heights
Confidence: Medium
Flight height data recorded for 5 Bewick's Swans with Ecotone GPS-GSM tags, whose loggers were programmed to record altitude and have accuracy ± 22 m, indicated that the birds fly at low altitudes: 89.2% of 323 data points over land and 93.0% of 201 over sea were at < 150 m. Both mean and modal flight heights were in the 0–50 m band, with altitude data considered accurate to ± 22 m (Griffin et al. 2016).
For two individuals fitted with Ornitela loggers (accuracy ± 5 m), flight heights ranged from 5–12 m a.s.l. (± 5 m for data recorded at 1 sec intervals) when in the vicinity of the Sheringham Shoal wind farm site (Rees et al. 2019).
Offshore turbines must have a minimum clearance of 22 m a.s.l. Given the low flight altitudes recorded for this species during migration, and the precision of the GPS flight height estimates, it is suggested that 50% of flights at collision risk height is a reasonable precautionary estimate for the purposes of collision risk modelling.
Flight speeds
Confidence: Medium
Average flight speeds recorded for swans fitted with Ecotone collars crossing the North Sea, derived from speed data recorded by the UHF-GPS tags, gave flight speeds ranging from 8–36 m/s (mean ± SD = 24 ± 7.6 m/s, n = 16 crossings), with the timing of the crossing influenced by wind conditions (Griffin et al. 2016). These calculations did not include periods that the birds spent loafing on the North Sea, with four birds pausing there for c. 1.5–5 h. For the two birds fitted with Ornitela collars which provided flight speed data, overall flight speeds were of 15.3 and 18.6 m/s (55 and 67 km/h) for migration across the North Sea (Rees et al. 2019).
Based on these data, and reflecting the sample sizes of the two studies, it is recommended a flight speed estimate of 24 m/s ± 7.6 be used for the purposes of collision risk modelling.
Avoidance rates and behaviour
Confidence: Low
Avoidance rates remain poorly known, but two different strategies were seen for swans fitted with Ornitela tags on crossing the North Sea. One individual, on approaching the Butendiek (German) wind farm at 70 km/h, diverted to fly around the turbines. Two others (migrating together) passed between the outermost turbines of the Sheringham Shoal (UK) offshore wind farm at 55–67 km/h, with flight heights of 5–12 m a.s.l. (± 5 m for data recorded at 1 sec intervals) recorded at this time (Rees et al. 2019). Radar/visual observations made in good weather over a 10-day period, combined with all-winter carcass searches for Bewick's Swans wintering near a 9-turbine wind farm in the Netherlands, gave the likelihood of a single Bewick's Swan passing through the wind farm colliding with a turbine at 0–0.04% (Fijn et al. 2012).Further analysis of detailed GPS data, in relation to terrestrial as well as offshore wind farms, therefore, is warranted to provide supplementary information on swan movements within and around wind farms.
Previous comparisons of predicted and observed collision rates for swans suggest within-windfarm rates of avoidance are likely to be high. Analysis of these datasets and others collected subsequently reinforces this with a within-windfarm avoidance rate estimated from post-construction monitoring data for all swan species of 0.988 (Table 5). Based on these analyses, an avoidance rate of 0.9885 ± 0.00091 is recommended for use in relation to collision risk modelling.
Whooper Swan Cygnus cygnus
SPA Species? |
Yes (non-breeding population) |
|---|---|
SPA site codes (Introduction, Table 2) |
12:33:36:41:48:54:78:88:89:94:103:108:114:145:149:156:162:179:180 |
Population size breeding (UK) |
28 pairs (APEP4, 2020); uncertainty: low |
Population size non-breeding (UK) |
25,800 individuals (Brides et al. 2021); uncertainty: low |
Population size (Biogeographic flyway, SPA season) |
43,000 individuals (Icelandic population, non-breeding; Brides et al. 2021); uncertainty: low |
Percentage of biogeographic population at risk of collision in UK waters (passage / breeding / non-breeding) |
93%; uncertainty: low |
Movement of wintering birds
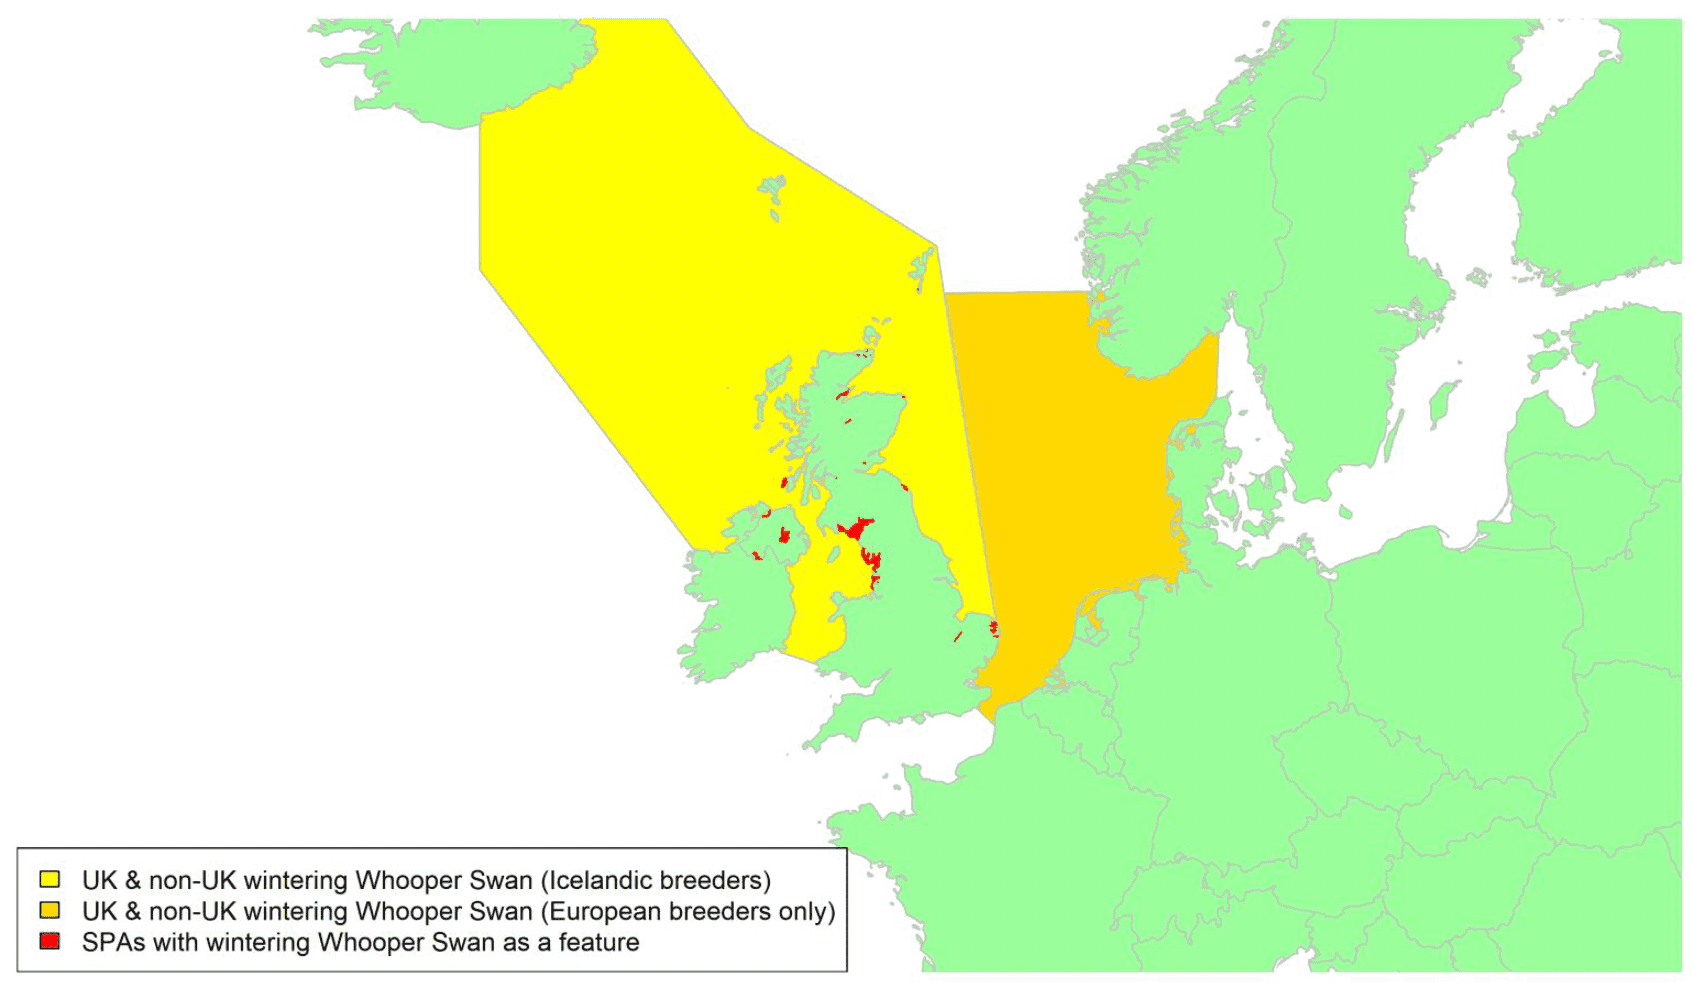
Migratory routes
Confidence: High
Whooper Swans breed in Iceland and across northern Eurasia and are fully migratory. Whooper Swans wintering in Britain and Ireland are primarily from the Icelandic-breeding population, and their overseas migration generally takes the most direct route between these countries, as shown by the yellow area on the above map. Thus, swans wintering in western Britain tend to follow the west coast of Scotland in both autumn and spring, and to arrive/depart via the Inner Hebrides and Outer Hebrides / Na h-Eileanan Siar , which provide important departure and landfall sites even if used only for a few days (Griffin et al. 2010, Bowler et al. 2021). Those wintering in eastern Britain (as far south as the Ouse Washes SPA in SE England) seem more likely to arrive/depart over northern Scotland, and then to migrate along the eastern coastline, although some do fly across Scotland in spring to depart via the Hebrides.
Less is known about the routes taken by Whooper Swans wintering in Ireland, but a proportion of birds migrate direct from Iceland to reach Northern Ireland, while others follow the western coast of Scotland en route to Ireland (Griffin et al. 2010, 2011; Appendix 1). Movement from Northern Ireland to Scotland (over Rathlin Island and the Mull of Kintyre) also occurs when the swans land apparently too far west of their winter quarters during autumn migration (Griffin et al. 2010).
There is some limited interchange of individuals between the Icelandic and the northwest Mainland European (NWME) populations, but the routes taken by these individuals and the extent to which they are cold weather movements is unclear (Hall et al. 2016). The majority of Whooper Swans colour-marked in continental Europe and subsequently seen in the UK were reported from southeast England, and it is considered these birds arrive primarily via the Low Countries, but sightings of ringed individuals from the NWME population suggest that migration from Norway or Denmark to Scotland may also occur (Hall et al. 2016, K. Brides pers. comm.). Consequently, it should be assumed that birds could cross the North Sea on a broad front, as shown by the orange area on the map above.
Around 93% of the biogeographic population could be potentially at risk of collision with wind turbines in UK waters, assuming that all Whooper Swans wintering in the Republic of Ireland and the Isle of Man migrate via UK waters and a small proportion remain in Iceland.
Timing of migration
Confidence: High
Autumn migration to the UK commences in late September, with peak migration occurring in October and into November. Some Whooper Swans remain in Iceland overwinter; the extent to which mid-winter movement from Iceland to Britain/Ireland occurs (e.g., in response to adverse weather conditions) is not known, but the proportion of the population overwintering in Iceland is relatively constant at c. 5–8% (Hall et al. 2016; Brides et al. 2021). Although staging areas in Scotland may be used for several weeks during autumn before onward movement (Bowler, 2021; Rees et al. 1997, 2000), many birds migrate directly to wintering grounds further south, with increased reporting rates for England from late September to late October (BirdTrack data; see Appendix 2). Counts at the relatively southerly Martin Mere (northwest England) and Ouse Washes (southeast England) SPAs generally peak in December to February (Robinson et al. 2004). Spring migration mostly occurs in March to early April, although the swans start leaving in February in milder winters. BirdTrack records during the summer may reflect the presence of small numbers of non-migratory individuals, e.g., injured birds unable to migrate.
Tracking data indicate that over-sea migration occurs during both night and day. If wind conditions are favourable the swans can make the crossing from Iceland to Britain in eight hours (Griffin et al. 2011), or the direct flight from Iceland to Ireland in 36 hours including resting on the ocean (Pennycuick et al. 1999), but one individual which encountered strong headwinds spent 4 days at sea (Pennycuick et al. 1996, 1999).
Flight heights
Confidence: Medium
Whooper Swan flight heights have been recorded in both tracking and observational studies, with most finding that the swans migrate at low altitudes. When migrating overland, tracking data recorded mean flight height (± SD) at 8 m ± 9 m above ground level (although note the data quality of ± 22 m for the loggers), with a median flight height of 42 m and a modal value of 10 m (Griffin et al. 2011). Behavioural studies gave similar results, with observations at wintering sites both in Scotland and in Denmark finding that the vast majority of flights were at < 30 m (Rees et al. 2000, Larsen & Clausen, 2002). Elsewhere, Therkildsen & Elmeros (2015) found at the terrestrial Østerild wind turbine test centre in Denmark, that 13.6% and 18.3% of individuals and flocks, respectively, occurred at rotor height (between 45–222 m), whereas 86.4% individuals and 81.7% of the flocks were below rotor height. Moreover, the swans' flight height in the vicinity of the turbines did not differ significantly between the pre-construction and post-construction studies phases.
Mean flight height when migrating over UK waters was higher at 27 m ± 50.7 m a.s.l. (n = 700), median flight height was 9 m and the modal value was again in the 0-10 m band (Griffin et al. 2010, 2011). Altitude of flight tended to be lower when the swans were migrating along the British coast (mean ± SD = 9 m ± 16.2 m, n = 140 locations) than when crossing from Britain to Iceland (32 m ± 55.1 m, n = 560 locations), but again with an additional margin of error of ± 22 m attributable to the accuracy of the satellite tags (Griffin et al. 2010). Altitude of flight increased as the swans started crossing from Britain to Iceland but decreased again on approaching the Icelandic coast (Griffin et al. 2010).
Although the swans occasionally reach higher altitudes (e.g. flight heights of up to 500 m and 1,700 m a.s.l. have been recorded when crossing between Iceland and Scotland; Pennycuick et al. 1996), there is no recent evidence in line with Stewart's (1978) report of migrating Whooper Swans flying at 8,200 m.
Offshore turbines must have a minimum clearance of 22 m a.s.l. Given the low flight altitudes recorded for this species during migration, and the precision of the GPS flight height estimates, it is suggested that 50% of flights at collision risk height is a reasonable precautionary estimate for the purposes of collision risk modelling.
Flight speeds
Confidence: High
Flight speeds for Whooper Swans and other species are dependent on environmental conditions, particularly wind velocity and direction (Safi et al. 2013), with birds sometimes unable to progress if encountering headwinds but wind-assisted if migrating on tailwinds. Although flight speed data are available from Whooper Swan tracking studies, they have received relatively little attention, perhaps because of the need to take wind speed into account. Nonetheless, the commonest airspeeds recorded during migration for birds tracked during the 1990s were estimated at 21 m/s, and one bird was thought to have reached 27 m/s on approaching the south tip of Iceland (Pennycuick et al. 1996).
More recently, mean groundspeeds of 17.5 ± 4.4 m/s (63 km/h ± 16 km/h, n = 203) have been recorded for Whooper Swans making overland flights across the UK during spring migration in 2009. Mean groundspeeds of 16.9 ± 4.2 m/s (61 km/h ± 15 km/h, n = 14) were recorded in spring 2010, with an overall mean across both years of 17.5 ± 4.2 m/s (63 km/h ± 15 km/h, max speed = 99 km/h, n = 217) and a maximum speed of 27.5 m/s (99 km/h; Griffin et al. 2011). Mean groundspeeds were similar in autumn, at 16.9 ± 5.6 m/s (61 km/h ± 20 km/h, n = 12) with a max speed of 24.4 m/s (88 km/h), for overland autumn migration in the UK (Griffin et al. 2011).
Two birds have completed the c. 800 km overseas crossing from NW Scotland to Iceland in just eight hours, with consistent flight speeds of 25.0–27.8 m/s (90–100 km/h) (Griffin et al. 2010).
Based on these data, it is recommended that a flight speed of 17.5 m/s ± 4.2 measured using GPS and including all samples from the 2009 and 2010 study, is used for the purposes of collision risk modelling.
Avoidance rates and behaviour
Confidence: Low
Only two cases of potential macro avoidance have been recorded; in both cases a Whooper Swan apparently gained height to fly over an operational wind farm (Griffin et al. 2011). Location and altitude data were recorded at 1-hour intervals, however, so more accurate assessments of avoidance rates are required. A literature review in 2012 found that two Whooper Swans had been reported as colliding with wind turbines, plus four cases where the swan species was not identified (Rees, 2012). Given that flying accidents (particularly collisions) with powerlines are a major cause of the death in the species (e.g., Rees et al. 2002), macro and micro avoidance rates should be updated to include data from the fine-grained tracking opportunities now available.
Previous comparisons of predicted and observed collision rates for swans suggest within-windfarm rates of avoidance are likely to be high (Whitfield & Urquhart 2015). Analysis of these datasets and others collected subsequently reinforces this with a within-windfarm avoidance rate estimated from post-construction monitoring data for Whooper Swans of 0.987 (Table 5). For the purpose of the current study, pending further data and analyses, an avoidance rate of 0.9874 ± 0.00138 is recommended for Whooper Swans in collision risk modelling.
Shelduck Tadorna tadorna
SPA Species? |
Yes (non-breeding population) |
|---|---|
SPA site codes (Introduction, Table 2) |
15:27:30:33:37:38:41:51:54:63:70:78:79:80:123:124:165:205 |
Population size breeding (UK) |
7,850 pairs (APEP4, 2020); uncertainty: high |
Population size non-breeding (UK) |
51,000 individuals (APEP4, 2020); uncertainty: low |
Population size (Biogeographic flyway, SPA season) |
310,000 individuals (NW European non-breeding). uncertainty: low (Wetlands International, 2021) |
Percentage of biogeographic population at risk of collision in UK waters (passage / breeding / non-breeding) |
c.25%; uncertainty: high |
Movement of wintering birds
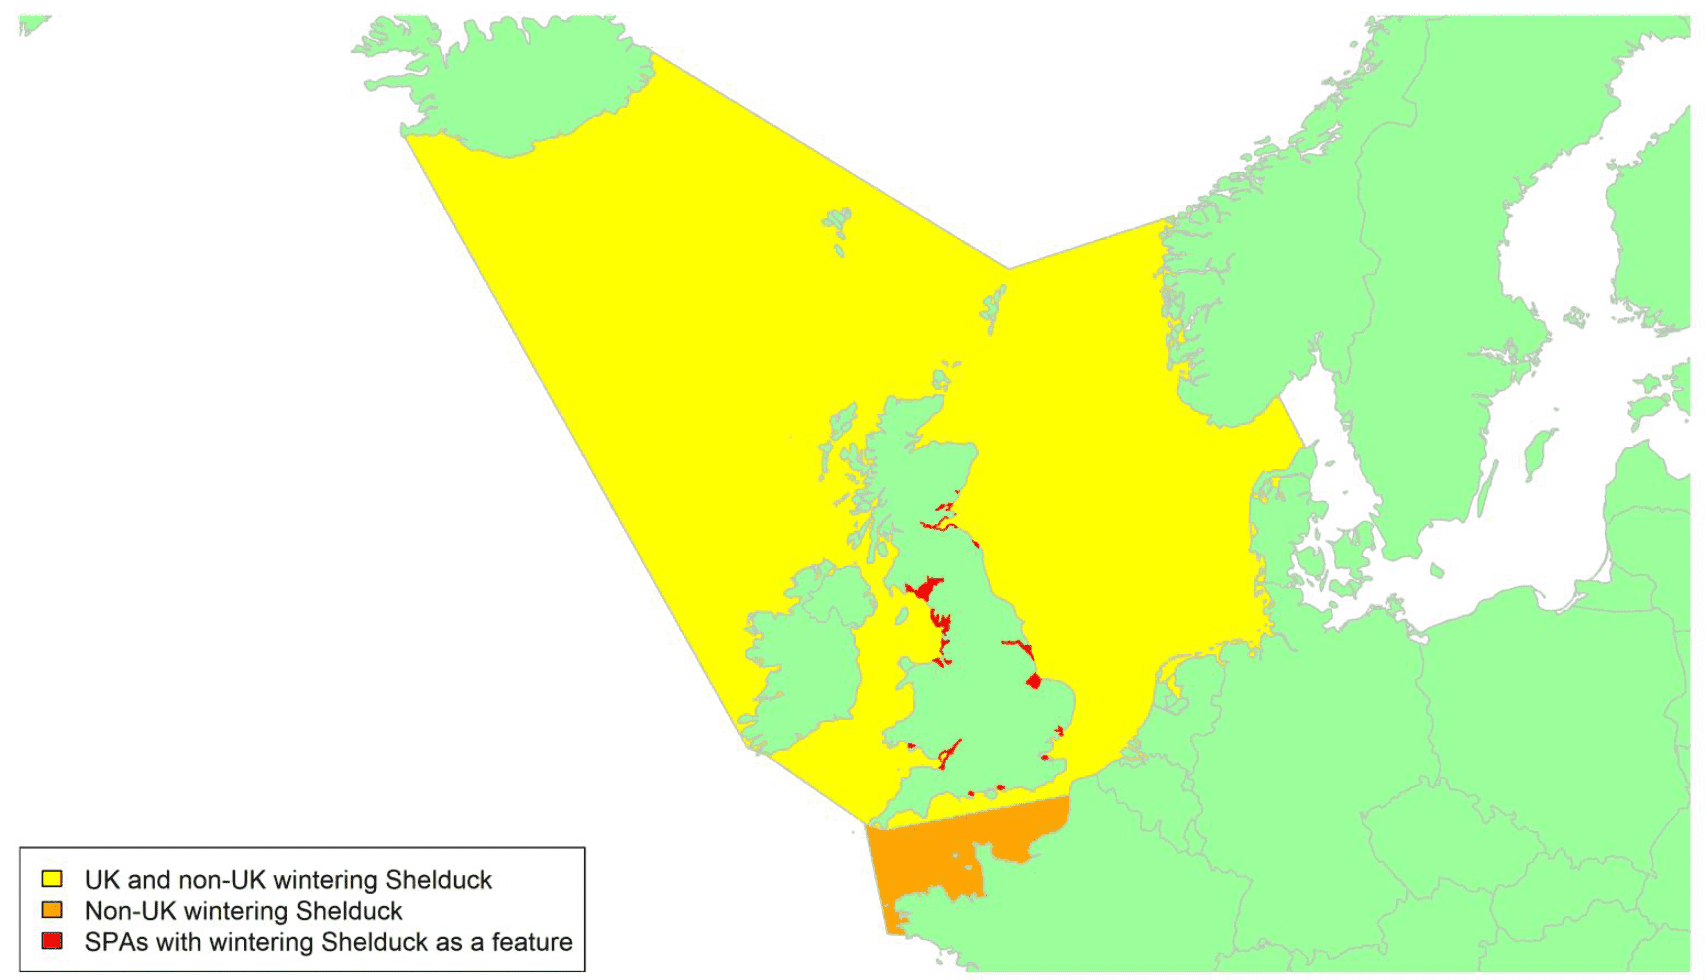
Migratory routes
Confidence: Low
Shelduck breed in Iceland and across central and northern Eurasia with those in the UK coming from the NW European population. The main movements of Shelduck across UK waters occur during their moult migration to and from the Wadden Sea, and also during cold weather movements to and from the continent. Ringing recovery data demonstrate that Shelduck from all over the UK have links to the Wadden Sea, but no data are available on the specific routes taken through UK waters, so a broad corridor must be assumed (Green et al. 2019). There is a breeding population of Shelduck in Iceland, but it is not known where these go in the winter; it is reasonable to assume some connectivity between Iceland and the UK may occur.
The Firth of Forth, Bridgwater Bay, the Humber and Mersey Estuaries and The Wash are known moulting areas for Shelduck in the UK (Green et al. 2019), so there will be an accumulation of Shelduck in these areas during the moulting season. The breeding origin of the Shelduck utilising these sites for moulting are unknown, so it is hard to judge what routes birds may take to reach these areas. However, it is likely these areas will form a focus for passage movements of birds during the moult migration.
Around 25% of the biogeographic population of Shelduck could be potentially at risk of collision with wind turbines in the UK. The proportion at potential risk may be lower depending on how many UK breeding Shelduck moult in the UK, and the route that they take.
Four Shelduck tagged together on the Suffolk coast have been tracked crossing the southern North Sea to the Dutch coast. Each took a slightly different route, despite starting and ending the crossing in roughly the same location (see map in Appendix 1). This again suggests a broad corridor is the safest assumption (Green et al. 2021). Hence Shelduck wintering in the UK could cross almost all UK waters, as shown by the yellow area on the map. It seems likely that most birds crossing the English Channel (shown by the orange area on the map) will be either British breeding Shelduck or birds from further north passing through British waters on route to wintering sites further south, although further data would help to confirm this.
Further tagging is planned for 2021 and 2022, in Suffolk, Lancashire, Yorkshire and Northern Ireland, as part of a PhD to study the migratory movement patterns of UK Shelduck in relation to offshore wind farms. The results of this PhD should help inform whether this broad migratory corridor can be refined. Further data to inform understanding of migratory timing, flight speed, flight height and avoidance rates will also be collected.
Timing of migration
Confidence: Medium
It is thought that the majority of the British breeding population migrates from the UK to the Wadden Sea between mid-June and late-August on moult migration (Green et al. 2019). They then remain in the Wadden Sea for a few months to complete their moult, before returning to the UK for the remainder of the winter. The BirdTrack data broadly agree with this timing, with the lowest reporting rates being between mid-July and early December. The most concentrated period of migration is between the end of the breeding period and the moulting period, reflected in the strong decreases in reporting rates shown by the BirdTrack data in all regions between mid-May and the end of August (see Appendix 2). After moulting, UK breeding birds may cross UK waters as they return from the continent at any time between August and December. Many birds that breed on the continent will also come to the UK in the winter, to avoid cold weather systems. There is therefore likely to be movements of Shelduck between the UK and the continent between June and February. It is only the breeding period (from March to May) when movements are unlikely to occur.
The Firth of Forth is a known moulting site for Shelduck. The BirdTrack reporting rate graph for Forth and Tay shows a clear increase in sightings during the moulting period (late July to early October; see Appendix 2). There is no strong effect apparent in the BirdTrack graphs for the four English regions with known moulting sites. This may indicate that the English moulting areas are relatively concentrated, whereas the Scottish moulting birds may be spread across a larger proportion of BirdTrack sites.
It is likely that most over-sea migration occurs at night, due to the overall lack of observational data from day time offshore studies, and the results of the one successful tracking study (Green et al. 2021).
Flight heights
Confidence: Low
Only a few observational studies of Shelduck flight heights have been reported, and only one tracking study has directly recorded flight heights from four birds. The studies were based on visual estimatations of species flight heights, and conducted on the coast and from offshore platforms (both during daylight hours). They suggested that migrating Shelduck fly below 30 m above sea level (Green et al. 2019). The tracking study collected data from nocturnal migrations and found that Shelduck, on average, flew at 36.7 ± 66.3 m above sea level, with heights of between 100 - 354 m recorded in the periods immediately after coastal departure and arrival (Green et al. 2021). In light of these data, and accounting for offshore turbines with a minimum rotor height of 22 m a.s.l., it is recommended that a precautionary assumption of 50% of flights at collision risk height is used.
Flight speeds
Confidence: Low
Shelduck flight speeds have been recorded by one observational study (of 7 individuals), one tracking study (of 4 individuals), and one radar study (one track). The observational study reported a 26.7 m/s average based on a visual assessment the time taken to travel between two known points in Bridgewater Bay (Morley 1966), the tracking study an average migration speed of 18.2 ± 4.3 m/s (Green et al. 2021), and the radar study an average airspeed of 15.4 m/s. Based on the sample sizes and methodologies underpinning these data, it is recommended that a flight speed of 18.2 ± 4.3 m/s should be assumed for the purposes of collision risk modelling.
Avoidance rates and behaviour
Confidence: Very Low
No data on Shelduck avoidance rates are currently available. The analysis of post-construction monitoring data collected for all duck species at onshore wind farm sites suggests that within-windfarm avoidance rates are likely to be high (Table 5). For the purposes of collision risk modelling, it is recommended that an avoidance rate of 0.9851 ± 0.00088 is used.
Shoveler Spatula clypeata
SPA Species? |
Yes (breeding and non-breeding populations) |
|---|---|
SPA site codes (Introduction, Table 2) |
1:12:14:15:21:31:34:37:40:42:48:55:61:62:73:78:149:205 |
Population size breeding (UK) |
1,100 pairs (APEP4, 2020); uncertainty: medium |
Population size non-breeding (UK) |
19,500 individuals (APEP4, 2020); uncertainty: low |
Population size (Biogeographical flyway, SPA season) |
70,000–80,000 individuals (NW & C European population, non-breeding); uncertainty: medium (Wetlands International, 2021) |
Percentage of biogeographical population at risk of collision in UK waters (passage/breeding/non-breeding) |
>28.7%; uncertainty: high |
Movement of wintering birds
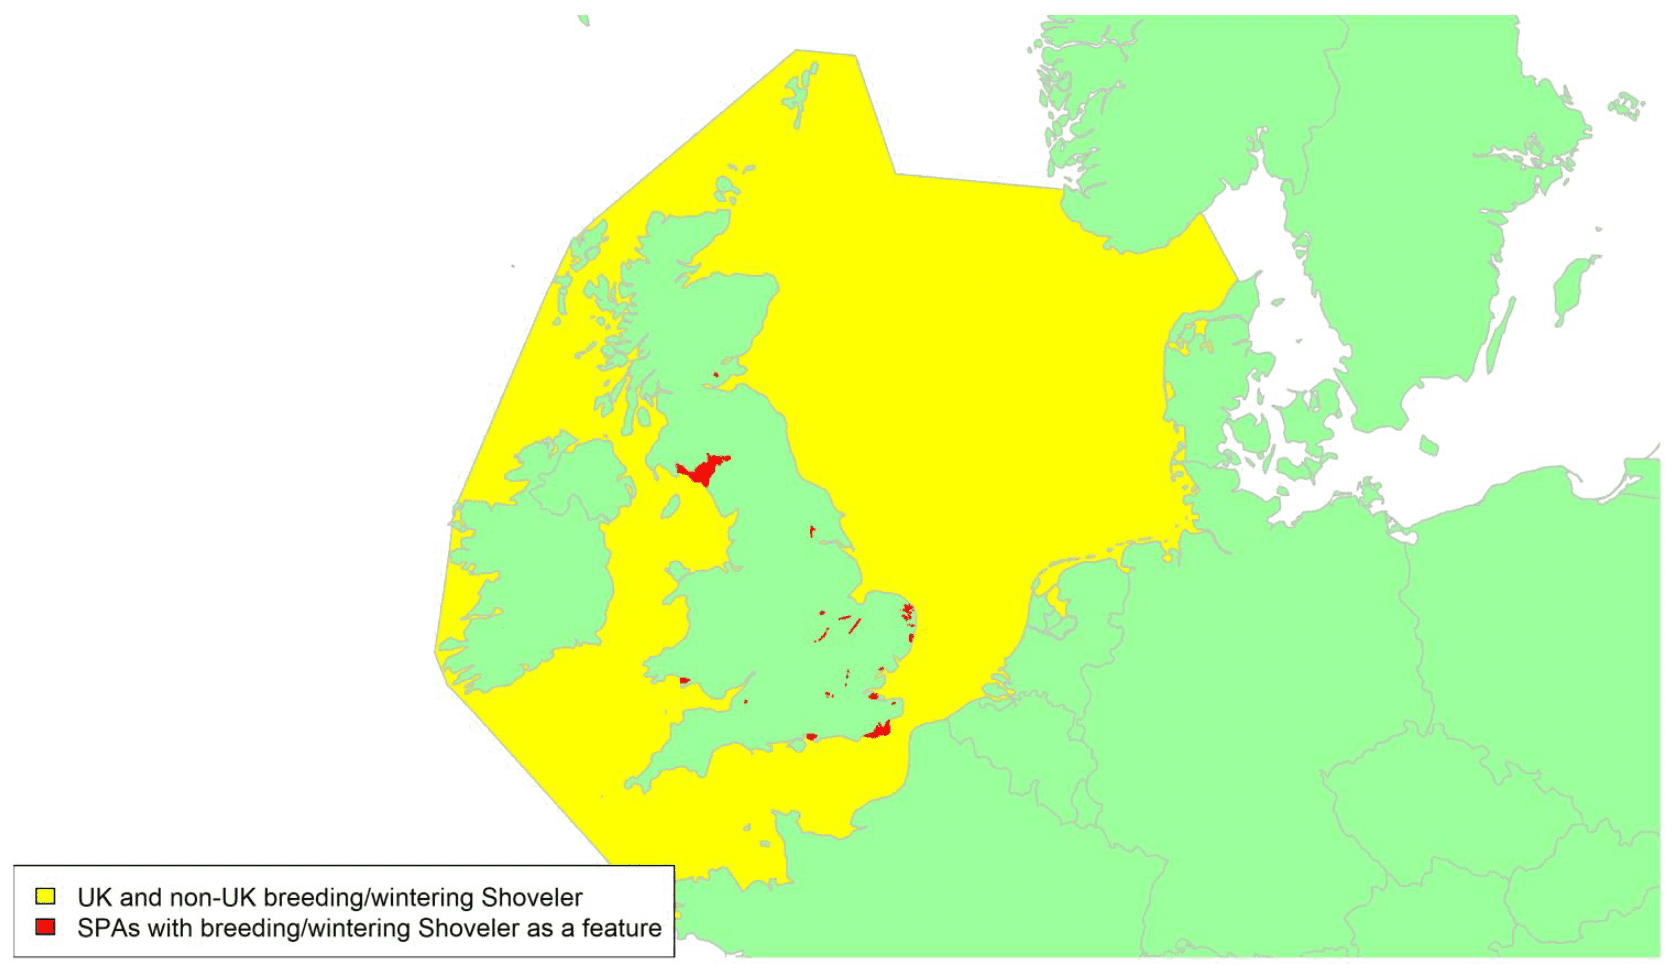
Migratory routes
Confidence: Low
Shoveler has a widespread distribution across the northern hemisphere with most birds being migratory. Although some Shoveler breed in the UK, much larger numbers winter here. The Shoveler has a relatively southerly wintering distribution in the UK. Just two of 16 SPAs listed because of their importance for migratory birds wintering in the UK are located in Scotland, at Loch Leven and the Solway Firth, with one in Wales and most of the remaining 12 sites in the south and east of England. Four of the English sites are listed as important breeding sites: the Lower Derwent Valley, Minsmere-Walberswick, Nene Washes and Ouse Washes, with the last three of these all located in East Anglia. The species Is also resident in Ireland, where small numbers of breeding birds (centred around Lough Neagh and the mid-Shannon basin) are joined by migratory birds each autumn, to bring the winter totals to around 2,000 birds including c. 150 individuals in Northern Ireland (Burke et al. 2018).
The c. 1,100 pairs of Shoveler which breed in the UK are augmented by c. 17,000 migratory birds for the winter, and those wintering in Ireland migrate there via the Irish Sea and hence cross UK waters. The estimate above that at least 29% of the biogeographic population could potentially be at risk of collision in UK waters is based on the numbers wintering in Britain and Ireland. However, with birds also passing through the UK (when moving from breeding areas in northwest mainland Europe to wintering locations in France and the Iberian peninsula), numbers using UK waters could be much higher. Those arriving from northern parts of Europe will mostly migrate across the North Sea, and a large proportion of these subsequently continue south into France, Spain, and southern Europe, probably crossing the English Channel. Southwards movement out of the UK is more pronounced during cold weather periods (Wernham et al. 2002), but the precise migration routes remain poorly understood. UK wintering birds could therefore pass through waters all around the UK, as shown by the yellow area on the map.
Timing of migration
Confidence: Low
Numbers of Shoveler in Britain are thought to peak in October, when birds from northwest continental Europe (from eastern Fennoscandia, western Russia and the Baltic countries) join those breeding in the UK , after which there is a steady emigration as both local and continental breeding birds continue south into France, the Iberian Peninsula and the Mediterranean regions to winter (Kirby & Mitchell, 2009; Wernham et al. 2002). Fluctuations in the BirdTrack reporting rates (see Appendix 2) therefore likely reflect waves of movements, particularly in Scotland. Increases along the Scottish coast in July and August may be of moulting resident birds. A further 'pulse' movement in several of the Scottish regions (excepting the Solway) from late September to the end of the year, likely corresponds with the arrival of migrants followed by a southward shift in the Shoveler's distribution during the mid-winter period, the latter involving local breeders as well as passage birds. Spring return to or through Scotland is evident with decreasing numbers of sightings from mid-March until June, as birds return to their UK and more northerly breeding areas.
In England, the increase in BirdTrack reporting rates in the second half of the year commences slightly later but is more prolonged (from late July until November), with less of a mid-winter dip than in Scotland, as UK-breeders move south and some of those arriving from the continent remain in the southern part of the country overwinter. The drop-in reporting rates from April to June inclusive indicates the departure of birds for northern continental nesting areas at this time. The lack of a clear movement to or from Northern Ireland probably reflects the relatively small numbers of birds involved.
Flight heights
Confidence: Low
A mean flight height of 61.7 ± 49.98 m (range = 13.7–111.7 m, n = 10 observations) was recorded by clinometer and rangefinder during daylight, for pre-construction monitoring at two wind farms in Texas, USA. Some 60% of flights were within the rotor sweep zone, but confidence intervals were quite high (Wulff et al. 2016).
Given the lack of altitude data, and that mean flight height is in the rotor sweep zone (n = 1 study), it is recommended that 100% of birds are assumed to be at collision risk height in collision risk models.
Flight speeds
Confidence: Low
There are very few flight speed records for Shoveler, although one very historic record for two individuals followed by car gave speeds of 43 and 57 mi/h (i.e. 19.2 and 25.5 m/s) respectively for birds in "easy flight" (Cooke, 1933). More recently, median groundspeed of 18.3 m/s (95%CI = 15.6–20.9 m/s, n = 34 flights) during migration was recorded for a single individual fitted with an Ecotone GPS-GSM transmitter in the East Pacific region, USA, between two separate locations mostly at 30 min intervals (McDuie et al. 2019). For most of the 6 duck species included in the McDuie et al. (2019) study, flight speed was found to be faster during migration than in non-migration periods, but there were insufficient data to assess this for the Northern Shoveler. Flights recorded for two individuals however gave a median flight speed of 15.6 m/s (95% CI = 6.5–24.7 m/s, n = 3 flights) for Shoveler during the non-migratory season (McDuie et al. 2019).
Whilst based on data from a single individual, as the data relate to the migration period and have been directly measured using GPS, it is recommended that the speed of 18.3 m/s (with 95% CI = 15.6–20.9 m/s) reported by McDuie et al. (2019) be used for the purposes of collision risk modelling.
Avoidance rates and behaviour
Confidence: Very Low.
No species-specific avoidance rates were found during the literature review. However, for "other ducks" (i.e., not sea ducks) in general (including Scaup, Red-breasted Merganser and Northern Pintail, but not Common Pochard), 71% were found to fly through the OWEZ wind farm with 56% diverting their flight to avoid it (Krijgsveld et al. 2011). In that study overall horizontal avoidance was estimated at 0.983 (i.e., for micro- and macro-avoidance combined) for this "other ducks" group.The analysis of post-construction monitoring data collected for all duck species at onshore wind farm sites suggests that within-windfarm avoidance rates are likely to be in the order of 0.9851 (SD 0.00081) (Table 5).
Gadwall Mareca strepera
SPA Species? |
Yes (breeding and non-breeding populations) |
|---|---|
SPA site codes (Introduction, Table 2) |
1:5:12:29:31:40:42:48:55:61:62:63:69:70:73:79:149 |
Population size breeding (UK) |
1,250-3,200 pairs (APEP4, 2020); uncertainty: medium |
Population size non-breeding (UK) |
31,000 individuals (APEP4, 2020); uncertainty: low |
Population size (Biogeographic flyway, SPA season) |
140,000 individuals (NW European population, non-breeding); uncertainty: high (Wetlands International, 2021) |
Percentage of biogeographic population at risk of collision in UK waters (passage / breeding / non-breeding) |
≥22.1% (non-breeding); uncertainty: medium |
Movement of breeding birds
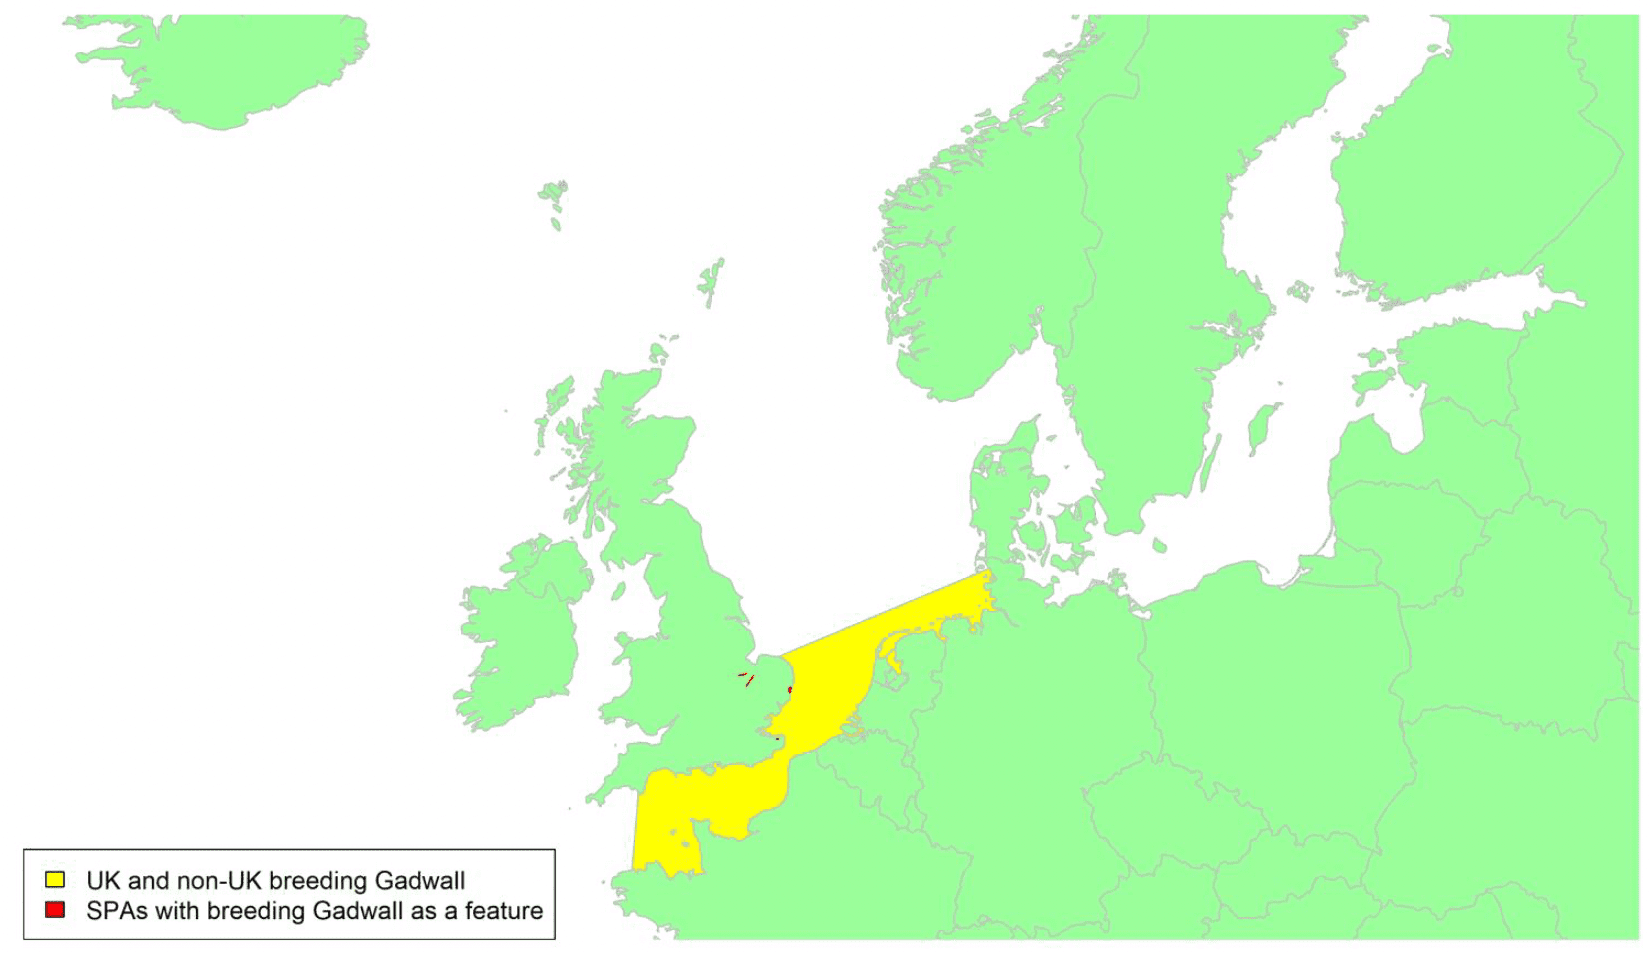
Movement of wintering birds
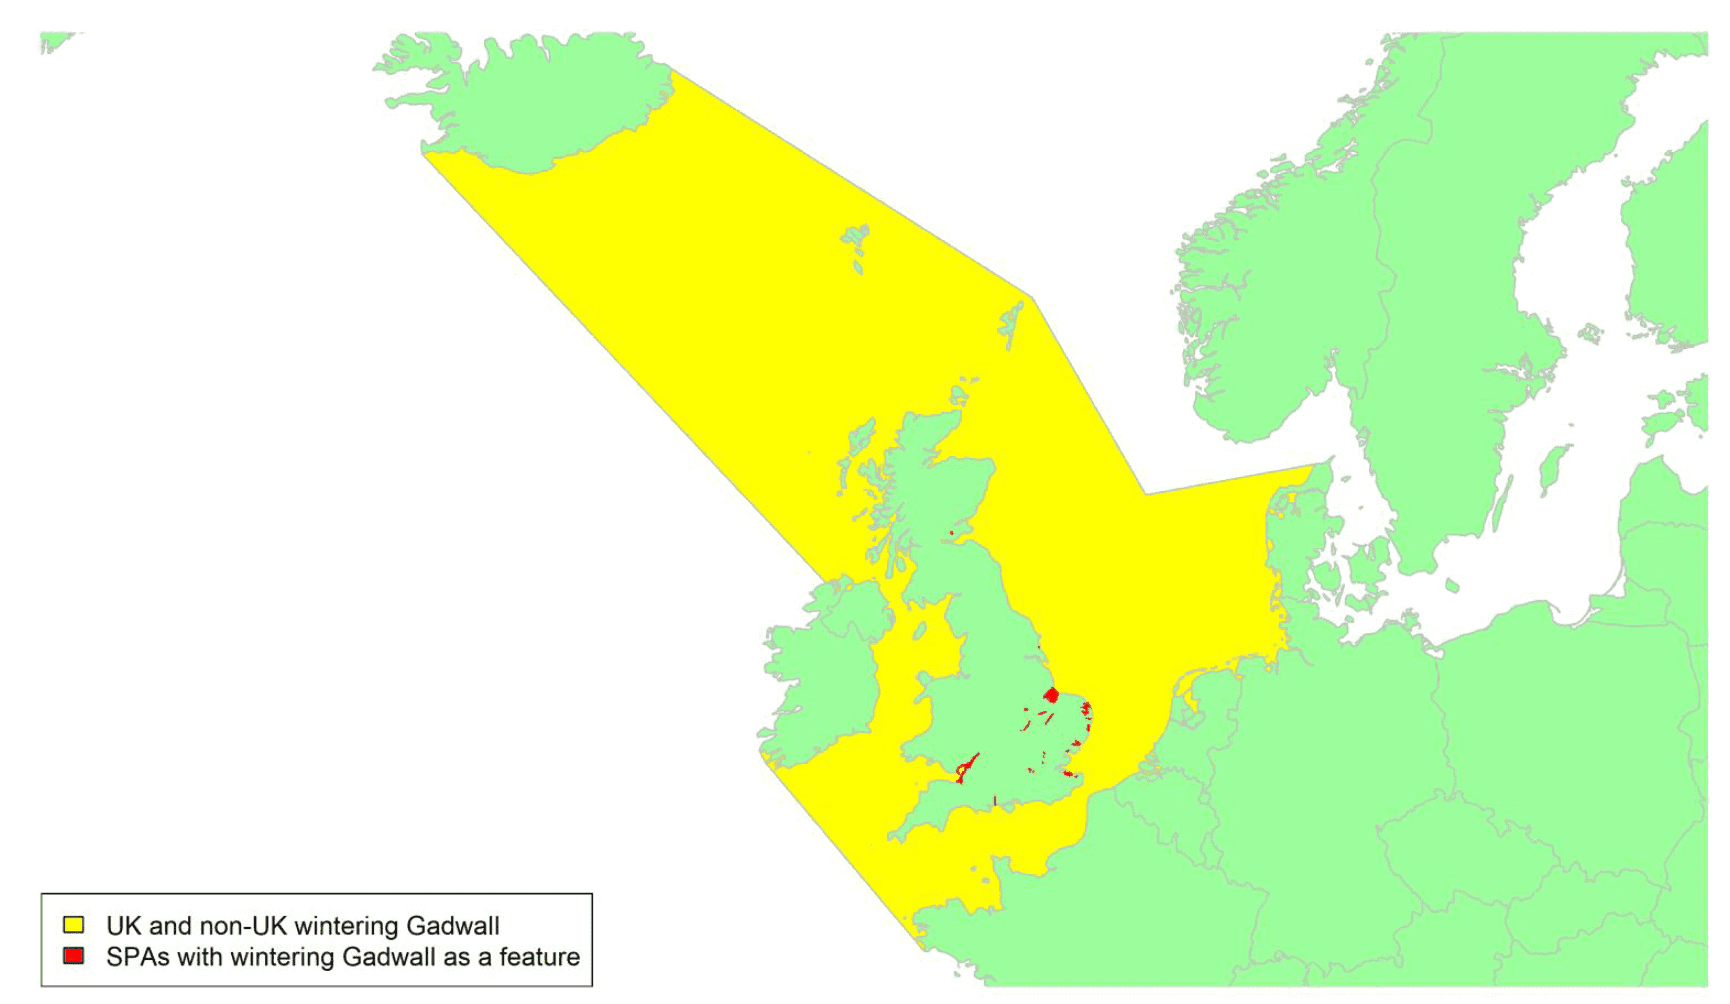
Migratory routes
Confidence: Low
The Gadwall is widely distributed across the northern hemisphere and highly migratory in the northern part of its range, reflecting its preference for shallow freshwater locations prone to freezing in cold weather (Fox & Mitchell, 1988). A proportion of the birds which breed in the UK, mostly in southern and eastern England (where Minsmere-Walberswick, Nene Washes, Ouse Washes and Stodmarsh are SPAs for breeding as well as wintering Gadwall), are thought to move south to France or the Iberian Peninsula to winter, with some UK Gadwall also moving east to the continent, as shown by the yellow areas on the breeding map. Although others are resident, ring recoveries indicate that only c. 13% of Gadwall ringed in Britain or Ireland in summer remained until late February, suggesting that they can't be considered a sedentary population (Wernham et al. 2002). In autumn, dispersing resident birds are supplemented by birds originating from the east and northeast (Fox & Salmon, 1988; Wernham et al. 2002). The much larger number of birds wintering in Britain come from countries of northern and eastern Europe, including Iceland, Scandinavia, the Netherlands, and the Baltic States. They are mostly absent from Norway and northern Sweden, and only small numbers breed in Iceland (Keller et al. 2020). Ringing recoveries suggest that few or no birds will cross the northern part of the North Sea, and hence that most birds will cross UK waters within the yellow shaded areas on the wintering map above.
Relatively little is known about the wintering areas for birds breeding Scotland although ring recoveries indicate that they tend to winter in Ireland, along with birds originating from Iceland (Fox & Mitchell 1988, Fox 2002). The long-established, still extant, group breeding at Loch Leven (Lauder, 2007) tends to disperse during autumn, although some birds remain in the area for the winter depending on weather conditions (Fox & Salmon 1989). Gadwall both breed and winter in Orkney, the latter perhaps also originating from Iceland.
Around 22% of the biogeographic population could potentially be at risk of collision with wind farms in UK waters, although it should be noted that this may be an underestimate as it assumes that few birds pass through Britain on route from Scandinavia to wintering areas further south.
Timing of migration
Confidence: Low
BirdTrack data suggest that movement through Scottish coastal waters increases from mid-August, with a peak in reports from along the north coast during early September to the first half of October, and in the Hebrides and Shetland from October to early November (see Appendix 2), perhaps reflecting arrival of small numbers of birds originating from Iceland. The build-up in England is slightly later, from early September onwards. Spring movements in Scotland occur mainly from mid-March to late June, which may include the return to Scotland of birds wintering further south within Britain as well as birds departing for other breeding areas, hence the lack of a clear overall pattern. Reporting rates for English coastal areas indicate a decline in numbers from early March until late June, evident in most English regions and also in Wales during this period. The timing of movement to and from Northern Ireland is not well defined (Appendix 2).
Although Gadwall move by both night and day (Guillemain et al. 2002), the extent to which they migrate nocturnally is not known.
Flight heights
Confidence: Low
Few studies have been made of Gadwall flight patterns, but Wulff et al. (2016) give a mean flight height of 71.6 m (SD ± 47.91 m, range = 13.7–130.4 m, n = 4 observations), measured by clinometer and rangefinder in Texas, USA.
Given the lack of altitude data, and the range of heights recorded in the one study, it is recommended that 100% of birds are assumed to be at collision risk height in collision risk models
Flight speeds
Confidence: Low
Flight (ground) speeds for Gadwall in the East Pacific region have been estimated at 19.6 m/s (95%CI 18.5-20.7) in 61 flights of just 4 individuals (McDuie et al. 2019).
Based on the limited data available, it is recommended that a speed of 19.6 m/s (95%CI 18.5-20.7) be used for the purposes of collision risk modelling
Avoidance rates and behaviour
Confidence: Very Low.
No species-specific avoidance rates were found during the literature review. The analysis of post-construction monitoring data collected for all duck species at onshore wind farm sites suggests that within-windfarm avoidance rates are likely to be in the order of 0.9851 (SD 0.00088) (Table 5).
Wigeon Mareca penelope
SPA Species? |
Yes (breeding and non-breeding population) |
|---|---|
SPA site codes (Introduction, Table 2) |
1:12:13:15:30:33:34:36:37:38:42:44:48:54:55:62:63: 70:73:107:114:116:123:135:165:166:180:186:205 |
Population size breeding (UK) |
200 pairs (APEP4, 2020); uncertainty: medium |
Population size non-breeding (UK) |
450,000 individuals (APEP4, 2020); uncertainty: high |
Population size non-breeding (Biogeographic flyway, SPA season) |
1,300,000–1,600,000 individuals (NW & C European population, non-breeding); uncertainty: medium (Wetlands International, 2021) |
Percentage of biogeographical population at risk of collision in UK (passage/breeding/non-breeding) |
c.34% (passage and non-breeding); uncertainty: medium |
Movement of wintering birds
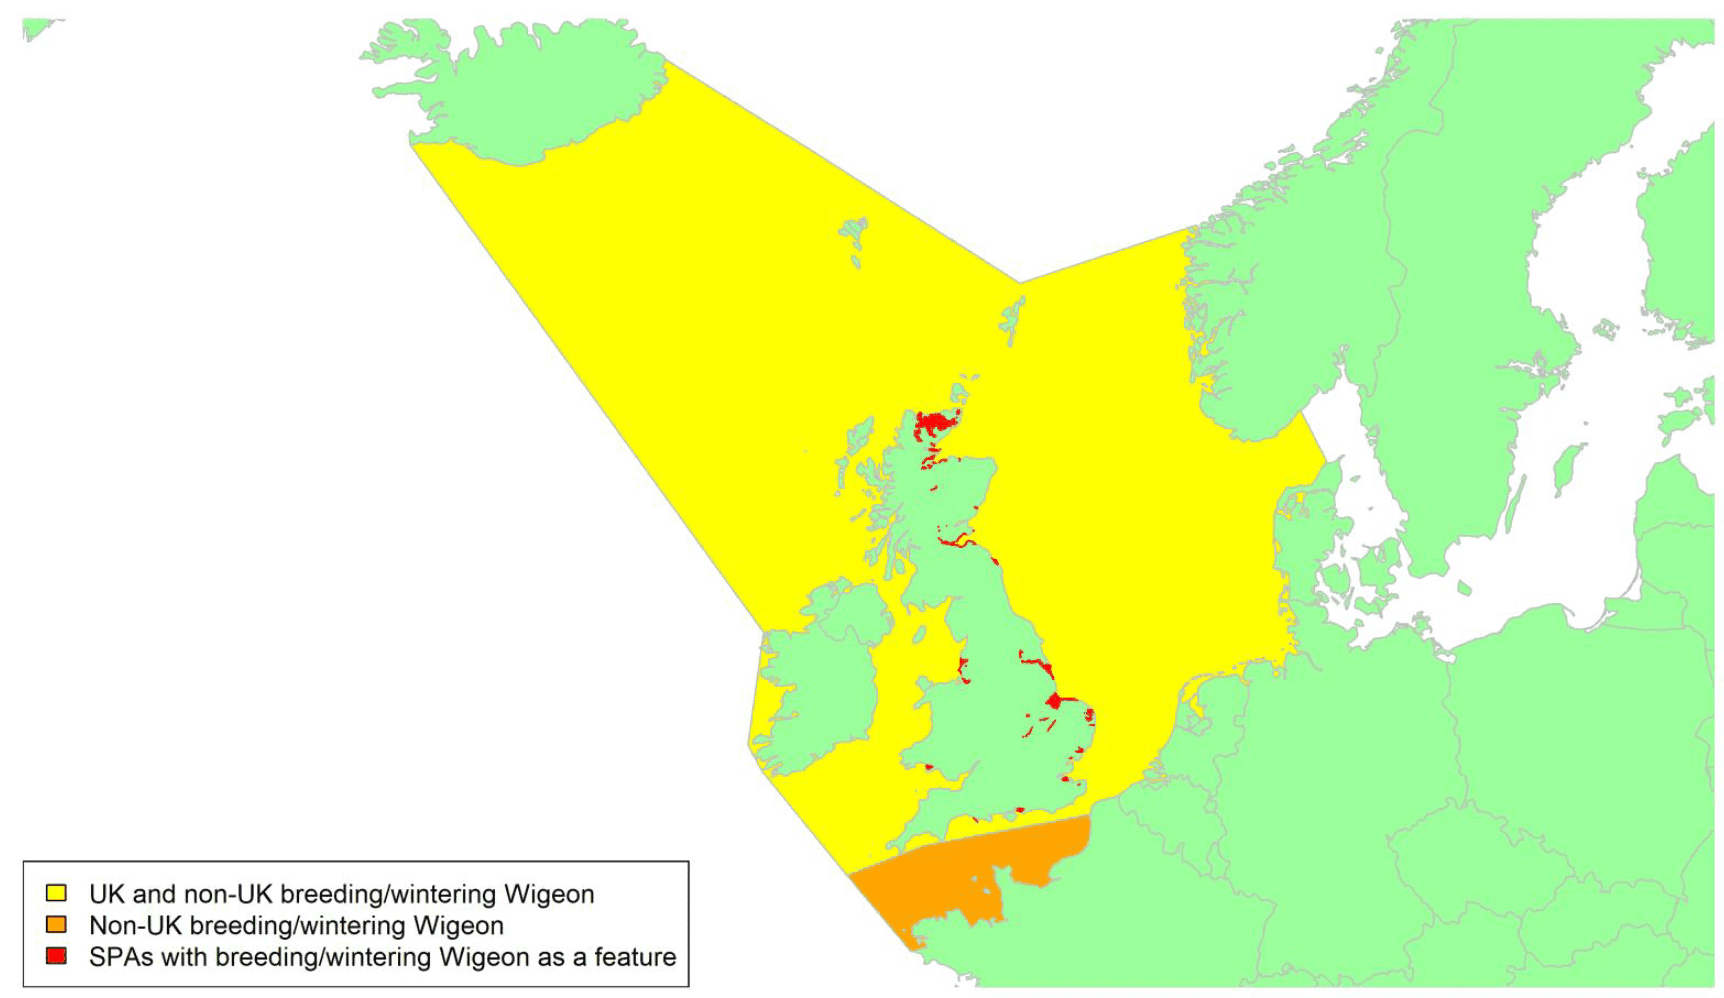
Migratory routes
Confidence: Low
Wigeon is found across Eurasia and is highly migratory. Although a small number of Wigeon breed in Scotland and northern England, including those at three SPAs designated for the species, a far greater number visit the country during the winter, migrating from breeding areas in Scandinavia and northern Russia, with some also coming from Iceland. Wigeon is the most numerous duck wintering in the UK and there are 26 SPAs in the UK for wintering birds. The most important non-breeding areas are the Ribble Estuary, Breydon Water and Berney marshes and the Ouse Washes which each support a mean of over 20,000 birds (Frost et al. 2021).
There are an estimated 445,000 Wigeon wintering in Britain and some of those wintering in Ireland (a further 55,700 birds; Burke et al. 2018) cross UK waters on migration. Therefore, around 34% of the biogeographic population could potentially be at risk of collision with wind farms in UK waters. However, this estimate only takes birds wintering in Britain and Ireland into account and could exclude some birds which may pass through the UK on route to wintering areas further south. The numbers/proportions coming from each direction (Iceland vs. continental Europe) are not known, making it difficult to estimate the number following each route. However, an estimated 4,000-6,000 pairs of Wigeon breed in Iceland (INCA, 2021) and, together with any young (potentially an additional 10,000 birds), the majority winter in Britain and Ireland (some winter in North America). It is suggested that assessments for wind farms should assume that 5% of the UK wintering population of 450,000 birds could cross UK waters from Iceland and 95% cross the North Sea from mainland Europe.
Precise migration routes of Wigeon over the seas around the UK are not known, but as they are widespread in lowland areas in winter, their migration routes probably take birds across most parts of UK waters (the areas shown in yellow on the above map), though with the highest concentrations of migrating birds in the North Sea, which the majority of UK wintering birds (except those migrating from Iceland) must cross. Birds crossing the English Channel (the orange areas on the map) will be predominantly those from the unknown numbers which move through the UK on passage. Further research to improve understanding of Wigeon migration routes (especially across the North Sea) would be valuable.
Little is known about the movements of Wigeon breeding at the three SPAs designated for the species, although, based on ring recoveries, birds breeding or hatched in Scotland move south and south-west to winter in England and Ireland (Wernham et al. 2002).
Timing of migration
Confidence: Medium
Autumn migration takes place between August and November, with peaks in mid-September to early October (Trektellen) and birds depart on spring migration in late March and April (Wernham et al. 2002). In addition to the main migration periods, there are movements of Wigeon within and through UK waters throughout the winter, and further influxes from Europe occur during periods of cold weather. The migration timings are supported by the BirdTrack data (see Appendix 2) which suggest more prolonged movements occur in most Scottish regions compared to the rest of the UK, which may be due to both the movements of Scottish breeding birds and passage birds moving through Scotland. Over-sea migration can occur during daylight hours but appears to be mostly at night. Of 242 GPS location points from 27 individually marked birds, 76% were between 18:00 and 04:00 (Waldenström & van Toor, pers. comm.).
Flight heights
Confidence: Low
GPS tracking has revealed a median flying height of 57 m (Q1–- 6.0 m–- Q3 229 m) above the sea, with a groundspeed of > 5 m/s as a threshold (see below) (Waldenström & van Toor, pers. comm.).
Given the height of offshore wind turbines, and the fact that this median value is within the likely range of the rotor swept area of these turbines, it is recommended that a precautionary assumption of 100% of birds at collision risk height is used.
Flight speeds
Confidence: High
Four studies have recorded flight speeds for this species and revealed some degree of consistency. A radar study in southern Sweden recorded a groundspeed of 20.6 m/s (± 2.1 SD, n = 36, Alerstam et al. 2007); an observation study in Scandinavia recorded a groundspeed of 18.5 m/s (n = 86, Pennycuick et al. 2013) and a theodolite study in the Baltic recorded a groundspeed of 17.1 m/s (± 2.28 SD, n = 7, Pennycuick et al. 2001). More recently, GPS tracking has revealed a median groundspeed of 15.8 m/s (Q1 12.78 m–- Q3 19.17 m) in flight above the sea, with a groundspeed of > 5 m/s as a threshold (Waldenström & van Toor, pers. comm.).
With the exception of the unpublished GPS study, these data have been collected using theodolite. Consequently, the value 18.5 m/s (SD 2.28), presented in Pennycuick et al. (2013), is recommended for the purposes of collision risk modelling as this reflects the study with the largest sample size.
Avoidance rates and behaviour
Confidence: Very Low
No species-specific avoidance rates were found during the literature review. The analysis of post-construction monitoring data collected for all duck species at onshore wind farm sites suggests that within-windfarm avoidance rates are likely to be in the order of 0.9851 (SD 0.00088) (Table 5).
Mallard Anas platyrhynchos
SPA Species? |
Yes (non-breeding population) |
|---|---|
SPA site codes (Introduction, Table 2) |
30:37:48:62:73:123 |
Population size breeding (UK) |
61,000–145,000 pairs (APEP4, 2020); uncertainty: high |
Population size non-breeding (UK) |
675,000 individuals (APEP4, 2020); uncertainty: high |
Population size (Biogeographical flyway, SPA season) |
4,500,000–7,100,000 individuals (NW European population, non-breeding); uncertainty: high (Wetlands International, 2021) |
Percentage of biogeographical population at risk of collision in UK waters (passage/breeding/non-breeding) |
≥11.6%; uncertainty: high |
Movement of wintering birds
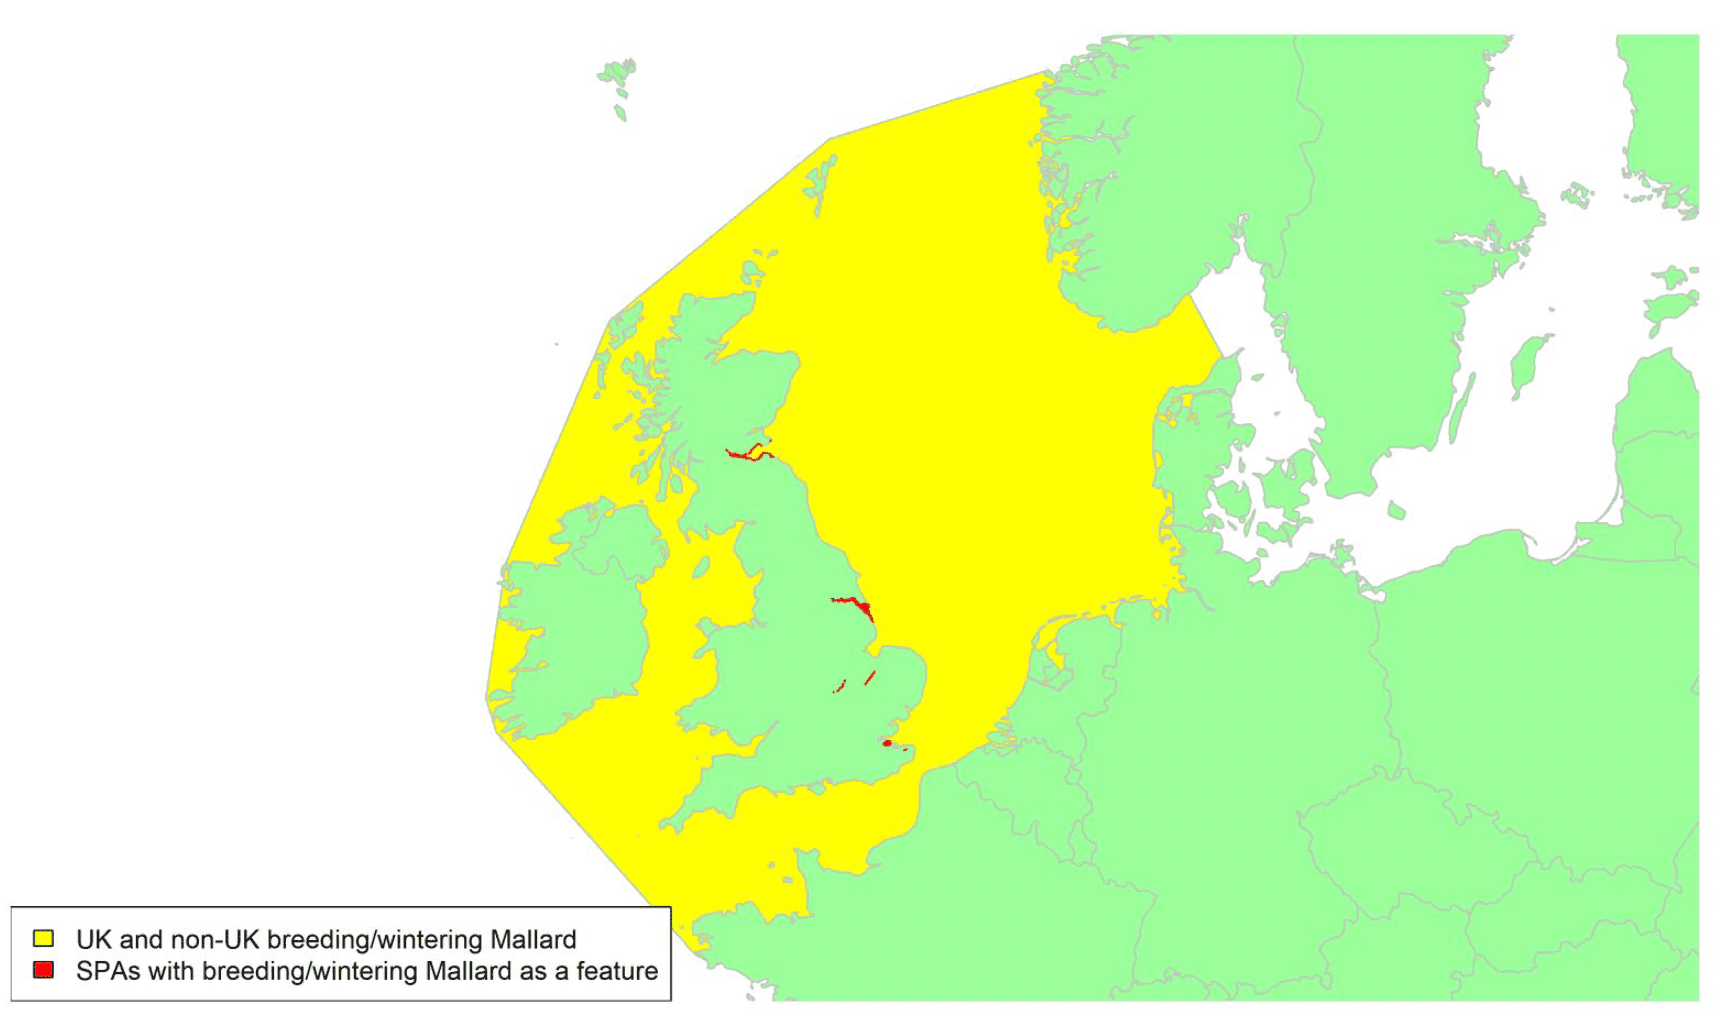
Migratory routes
Confidence: Low
Mallard is found as a native across the northern hemisphere with the more northerly populations being migratory. Mallard breeding in Britain and Ireland are relatively sedentary and dispersive, tending not travel long distances even during cold weather (Ridgill & Fox, 1990). Some 82% of recoveries for Mallard ringed in Britain and Ireland were within the two islands, although some head south and east to France and the Netherlands to winter (Wernham et al. 2002). Numbers wintering in the UK are augmented tenfold by migratory birds, which arrive from areas to the north and east in continental Europe each autumn. Those ringed in Britain in winter have been recovered from a wide area including Fennoscandia, Russia, Poland, Denmark, and Germany, as well as the Netherlands, Belgium, and France, though the number of continental-breeding birds wintering in the UK is thought to have declined over the second half of the 20th century (Wernham et al. 2002) and this trend may be continuing. The precise migration routes are not known, but it is likely that wintering Mallard could move through almost all UK waters, as shown by the yellow areas on the above map.
Most Icelandic breeders remain in Iceland throughout the year, and therefore a link to Iceland has not been shown on the above map as numbers will be negligible compared to those arriving from Fennoscandia and mainland Europe. However, those that do migrate to winter in Britain and Ireland will pass through UK waters to the north and west of the area shown.
Around 12% of the biogeographic population are potentially at risk of collision with wind farms in UK waters. However, this may be an under-estimate as it assumes that the unknown numbers passing through the UK en route to wintering sites elsewhere are negligible.
Timing of migration
Confidence Low
BirdTrack reports of Mallard along the Scottish and English coastlines (see Appendix 2) are relatively high throughout the year in comparison with other dabbling duck species, but peak in mid-March in England and early to mid-April in Scotland, with a dip in occurrence during summer when the birds are mostly dispersed across freshwater habitats away from the coast. Autumn influxes are prolonged, with reporting rates in Scotland increasing between mid-September and late October, extending into the New Year. A pulse in movement registered over the north coast of Scotland in January could perhaps be a cold weather movement, but given the small numbers involved is more likely to be within-Scotland movements.
Sightings decrease between mid-April and mid-June in Scotland and from the end of April to late June in England (Appendix 2), as wintering birds return to their breeding grounds, and the resident Mallard move elsewhere within the UK to breed. Reporting frequency therefore is relatively low during the breeding season (mid-June to mid-September), when the birds are inland of the BirdTrack monitoring locations included in this study, albeit the species is still regularly recorded in coastal areas.
Flight heights
Confidence: Low
Flight height data are somewhat limited, and available only for inland areas. Nonetheless observations made at the Buffalo Ridge Wind Resource Area in Minnesota, USA, recorded modal flight heights of 61m (range = 0–305m, n = 1,072) for Mallard (Osborn et al. 1998), whilst clinometer and rangefinder measures at two proposed wind farms in Texas gave a similar mean flight height of 51.6m (s.d. ± 13.31, range = 2–329m, n = 57; Wulf et al. 2016). There was no evidence for consistent seasonal variation in Mallard flight heights at the Texas sites, although it was found for some other species (Wulf et al. 2016).
Noting that both modal and mean flight heights reported are within the collision risk zone (i.e., greater than the minimum rotor height for offshore turbines of 22m a.s.l.), and that the data are for inland sites, it is recommended that 100% of birds are assumed to be at collision risk height for the purposes of collision risk modelling
Flight speeds
Confidence: High
Radar studies have given mean (± SD) airspeeds for Mallard of 18.5 ± 2.3 m/s (n = 22 tracks; flapping flight only) in the Arctic and southern Sweden (Alerstam et al. 2007) and 21.4 ± 2.4 m/s (n = 7 tracks) in Europe and the Mediterranean region (Bruderer & Boldt 2001). GPS tracking provided similar estimates, with a median airspeed of 15.86 m/s (n = 108 birds; Safi et al. 2013) and groundspeed of 22.9 m/s (95% CI = 21.6-24.2 m/s; n = 14 flights by 2 birds; McDuie et al. 2019). Airspeeds recorded using a theodolite concurred with estimates using other methods, with a mean flight speed of 19.7 ± 1.55 m/s (n = 21 runs) for Mallard on autumn migration along the Baltic (Pennycuick et al. 2013). Collision risk models generally make use of groundspeed rather than airspeed. However, the data presented in Safi et al. (2013) were collected over a range of wind conditions, meaning the impact of head and tail winds would cancel each other out, and the reported median airspeed would be similar to the groundspeed. Given this, and the relative sample sizes of the studies in which GPS data were collected, it is recommended that a speed of 15.86 m/s is assumed for the purposes of collision risk modelling. Whilst Safi et al. (2013) do not report variation around this figure, drawing from data for other species, it is suggested that a standard deviation of 2 m/s may be a reasonable reflection of variability in this species.
Avoidance rates and behaviour
Confidence: Very Low.
No species-specific avoidance rates were found during the literature review. The analysis of post-construction monitoring data collected for all duck species at onshore wind farm sites suggests that within-windfarm avoidance rates are likely to be in the order of 0.9851 (SD 0.00088) (Table 5).
Pintail Anas acuta
SPA Species? |
Yes (non-breeding population) |
|---|---|
SPA site codes (Introduction, Table 2) |
15:36:37:38:41:42:48:54:63:70:78:80:114:205 |
Population size breeding (UK) |
27 pairs (APEP4, 2020); uncertainty: low |
Population size non-breeding (UK) |
20,000 individuals (APEP4, 2020); uncertainty: low |
Population size (Biogeographical flyway, SPA season) |
74,000 individuals (NW European population, non-breeding); uncertainty: medium (Wetlands International, 2021) |
Percentage of biogeographical population at risk of collision in UK waters (passage/breeding/non-breeding) |
28.3% (non-breeding, including c. 1,000 wintering in the Republic of Ireland); uncertainty: medium |
Movement of wintering birds
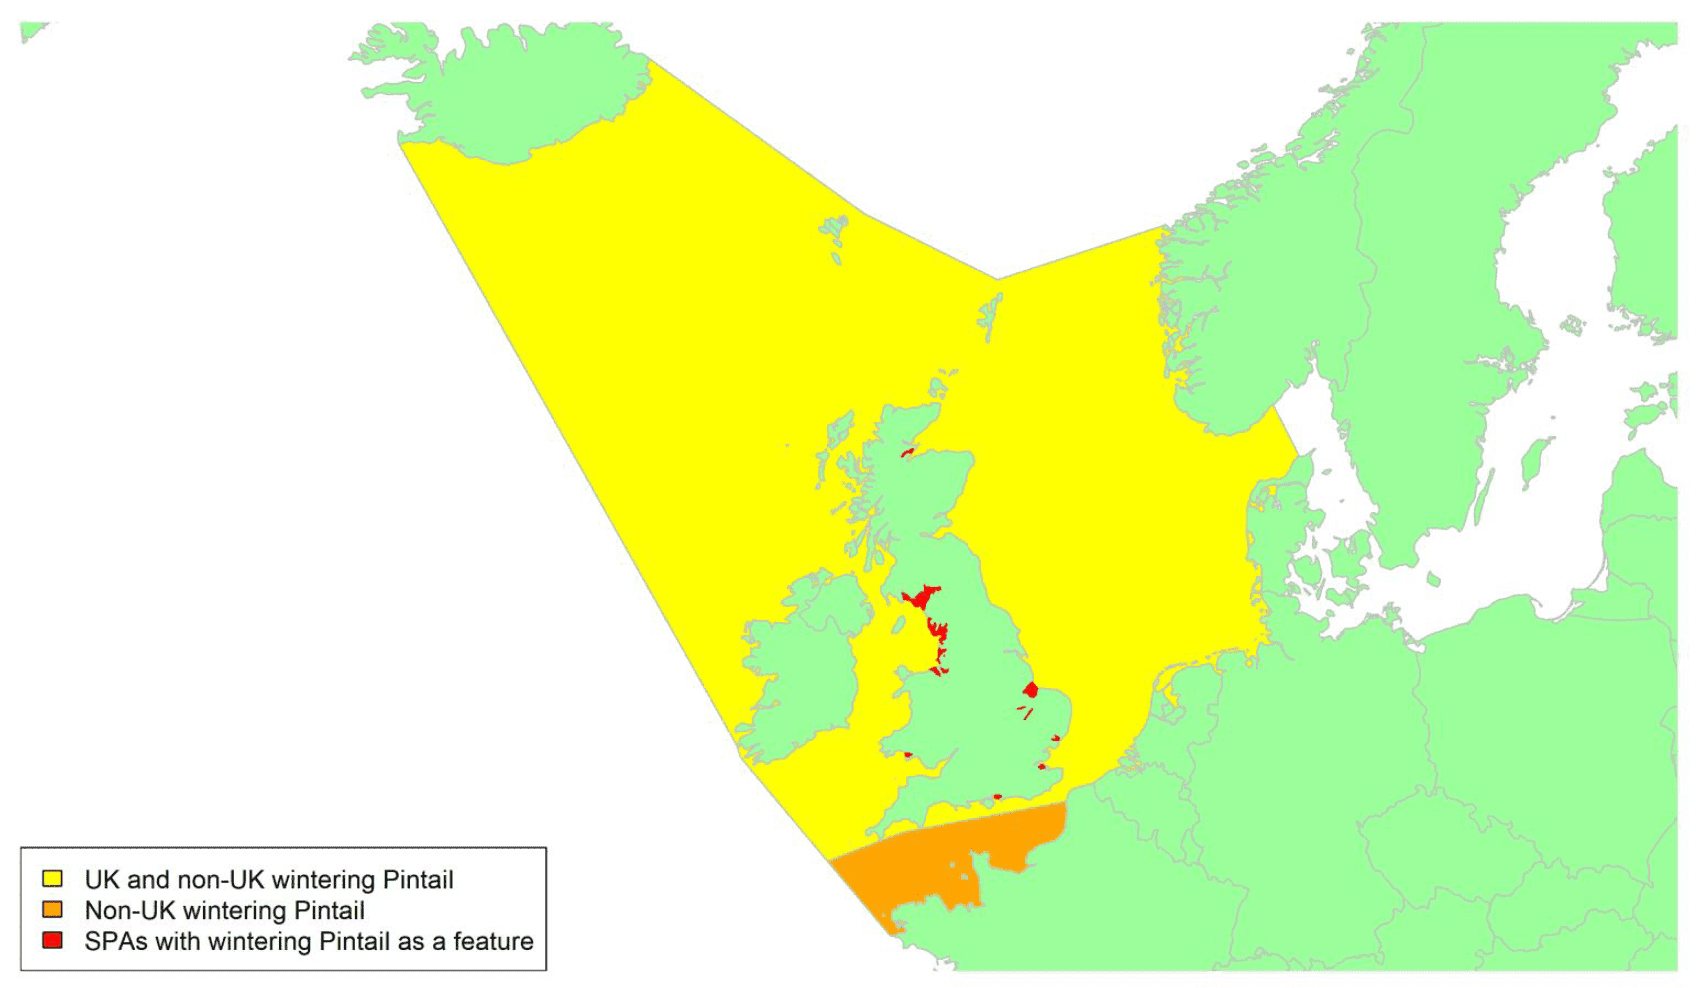
Migratory routes
Confidence: Low
Pintail has a wide range across the northern hemisphere and is highly migratory. Britain has a very small breeding population of Pintail and there are only a handful of breeding records from Ireland (APEP4). Around 20,000 individuals winter in the UK, including 500–600 birds in Northern Ireland, two-thirds of which are at Strangford Lough, and c. 1,000 winter in the Republic of Ireland (Lewis et al. 2019). Consequently, around 28% of the biogeographic population are potentially at risk of collision with wind farms in UK waters, although this assumes that the numbers passing through the UK en route to wintering grounds further south are negligible. Pintail wintering in Britain and Ireland have migrated here from widely dispersed breeding grounds which extend from Iceland across Fennoscandia and the Baltic States to Russia, where most of the ringed birds are recovered (Ogilvie, 1983). In Britain, the main concentrations are found in England, with just two sites listed as SPAs for the species in Scotland (Cromarty Firth; Solway Firth) and one in Wales (Burry Inlet).
The extent of mid-winter movement between Britain and Ireland remains unclear, as is the number of passage birds that winter further south along the Mediterranean and in North Africa passing through British coastal waters during autumn and spring migration. These passage birds will cross the English Channel en route from Iceland and Scandinavia to wintering grounds further south (shown by the orange area on the above map). Although precise migration routes are not known, Pintail are considered likely to migrate on a broad front, with birds breeding in Iceland likely arriving through north or northwest Scotland and Northern Ireland, and those from northern Fennoscandia also reaching the UK via Scotland but by a more easterly route. Pintail wintering in the Netherlands may cross the North Sea more directly, e.g., from the Netherlands, but again their migration route is not known. Hence Pintail wintering in Britain and Ireland could cross almost any UK waters, as shown by the yellow areas on the above map.
Timing of migration
Confidence Low
Being primarily a winter visitor to the UK, Pintail migration through the coastal waters of England, Scotland and Wales is evident during spring and autumn, but with a less marked movement to Northern Ireland where only c. 500–600 birds occur during winter (Burke et al. 2018). Reporting rates increase during late August to mid-November from along the Scottish coast (BirdTrack data, see Appendix 2), and at much the same time (from late August to late September) in England and Wales, extending to mid-October and late November in the more southerly regions of England. It has been suggested that a double peak in monthly WeBS indices (in October and December), noted in some but not all years, may reflect differences in the timing of migration for different subpopulations, e.g., with birds from Iceland perhaps arriving earlier than those from continental Europe (Wernham et al. 2002).
The main spring migration described by the BirdTrack data (see Appendix 2) is from mid-March to the end of May in England and from late February to mid-May in Wales. Departure from Scotland is over a longer period, from mid-February to early June (weeks 7-23), with the decrease in reporting rates from more south-westerly regions (Solway, Argyll, and the Clyde) commencing in early–mid February. Last departure records are over Moray and the north and northeast coasts in early June. Movements up to late June on Orkney suggested by the BirdTrack data may reflect the presence of small numbers of breeding birds here. Icelandic-breeding birds, which likely reach the rest of Britain via Scotland, may differ in the timing of their migration to Pintail from other parts of Europe, and this in turn can vary with weather conditions. Cold-weather influxes from Denmark, Germany and the Netherlands to Britain and Ireland occur in severe winters (Ogilvie, 1983; Ridgill & Fox, 1990).
Flight heights
Confidence: Low
There have been very few flight height records to date, but one flock was observed flying at 238 m over the North Sea in autumn (Christensen et al. 2006) and a clinometer and rangefinder study found flight heights (mean ± SD) of 48.1 ± 37 m for Pintail in Texas, USA (n = 15, Wulff et al. 2016).
Given the general lack of flight height data for the species, and that the one precise measure was of birds within the rotor sweep zone, it is recommended that 100% of birds are assumed to be at collision risk height for the purposes of collision risk modelling.
Flight speeds
Confidence: Medium
Satellite telemetry of female Pintail fitted with back-mounted 26 g PTTs has recorded mean ± SD flight speeds of 21.4 ± 1.1 m/s (77 km/h) for individual flight paths (range = 11.2–33.9 m/s; 40–122 km/h) for 17 tagged birds along 21 migration routes in North America, where groundspeed averaged 14.7 m/s (53 km/h) in headwinds and 22.8 m/s (82 km/h) in tailwinds (Miller et al. 2005). The same study estimated average airspeed at 15.3 m/s in tailwinds (55 km/h, n = 17 flights), and 19.7 m/s in headwinds (71 km/h, n = 4 flights).
McDuie et al. (2019) recorded similar median groundspeeds of 21.9 m/s (95%CI = 21.3–22.6 m/s), for 16 individuals (473 flights) fitted with 17 g GPS-GSM back-mounted Ecotone transmitters in North America. Earlier radar studies recorded mean ± s.d. airspeeds of 20.6 ± 2.6 m/s (n = 6 tracks, flapping flight only; Alerstam et al. 2007) for Pintail in Europe. A slightly slower estimate of 13.3 ± 0.9 m/s was based on a smaller sample size (n = 2 tracks; Bruderer & Boldt 2001).
Based on the sample sizes underpinning these data and noting that groundspeed data are preferred for the models it is recommended that the mean groundspeeds of 21.9 (95%CI = 21.3–22.6 m/s) be used for the purposes of collision risk modelling. It should also be noted that airspeeds can be quite variable, depending on location and weather conditions.
Avoidance rates and behaviour
Confidence: Very Low.
No species-specific avoidance rates were found during the literature review. However, 71% of "other ducks" (i.e., excluding sea ducks, but including Scaup, Red-breasted Merganser and Northern Pintail) were found to fly through the OWEZ wind farm by Krijgsveld et al. (2011), with 56% showing deflection, who put overall horizontal avoidance at 0.983 (i.e., for micro- and macro-avoidance combined) for the "other ducks" group. The analysis of post-construction monitoring data collected for all duck species at onshore wind farm sites suggests that within-windfarm avoidance rates are likely to be in the order of 0.9851 (SD 0.00088) (Table 5).
Teal Anas crecca
SPA Species? |
Yes (breeding and non-breeding populations) |
|---|---|
SPA site codes (Introduction, Table 2) |
1:15:27:30:34:37:38:40:42:48:54:55:58:59:69:78:80:116:135:149:156:205 |
Population size breeding (UK) |
2,700-4,750 pairs (APEP4, 2020); uncertainty: high |
Population size non-breeding (UK) |
435,000 individuals (APEP4, 2020); uncertainty: medium |
Population size (Biogeographic flyway, SPA season) |
670,000 individuals (NW European population, non-breeding); uncertainty: medium |
Percentage of biogeographic population at risk of collision in UK waters (passage / breeding / non-breeding) |
>65% (non-breeding); uncertainty: medium |
Movement of breeding birds
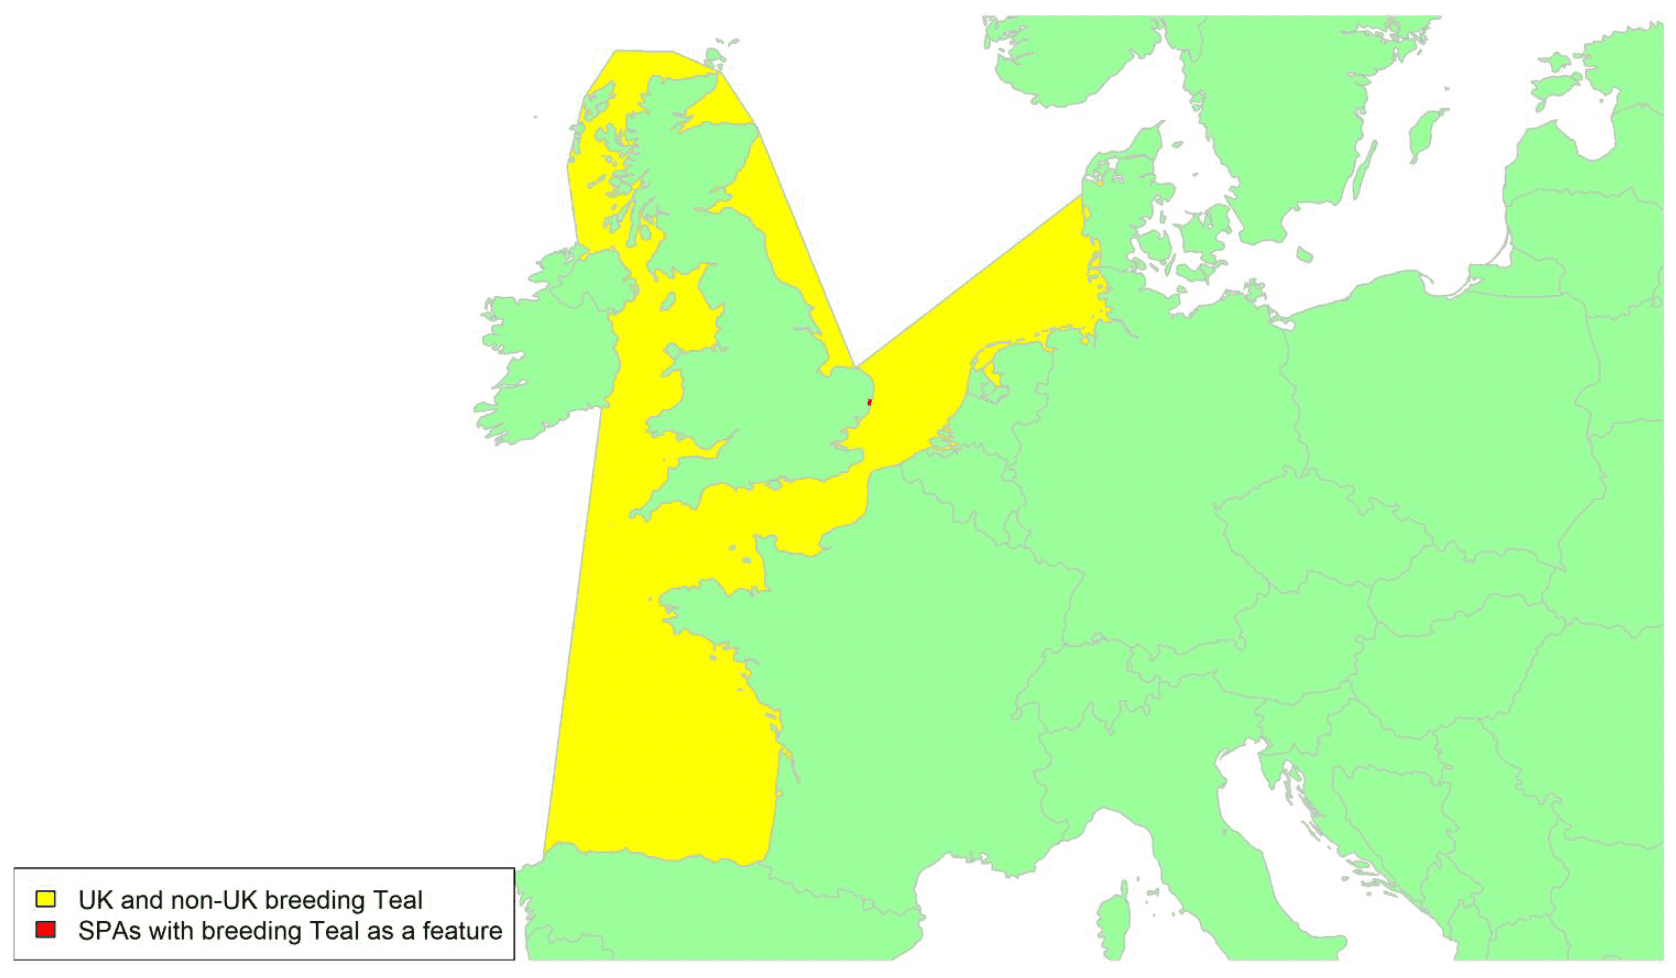
A)
Movement of wintering birds
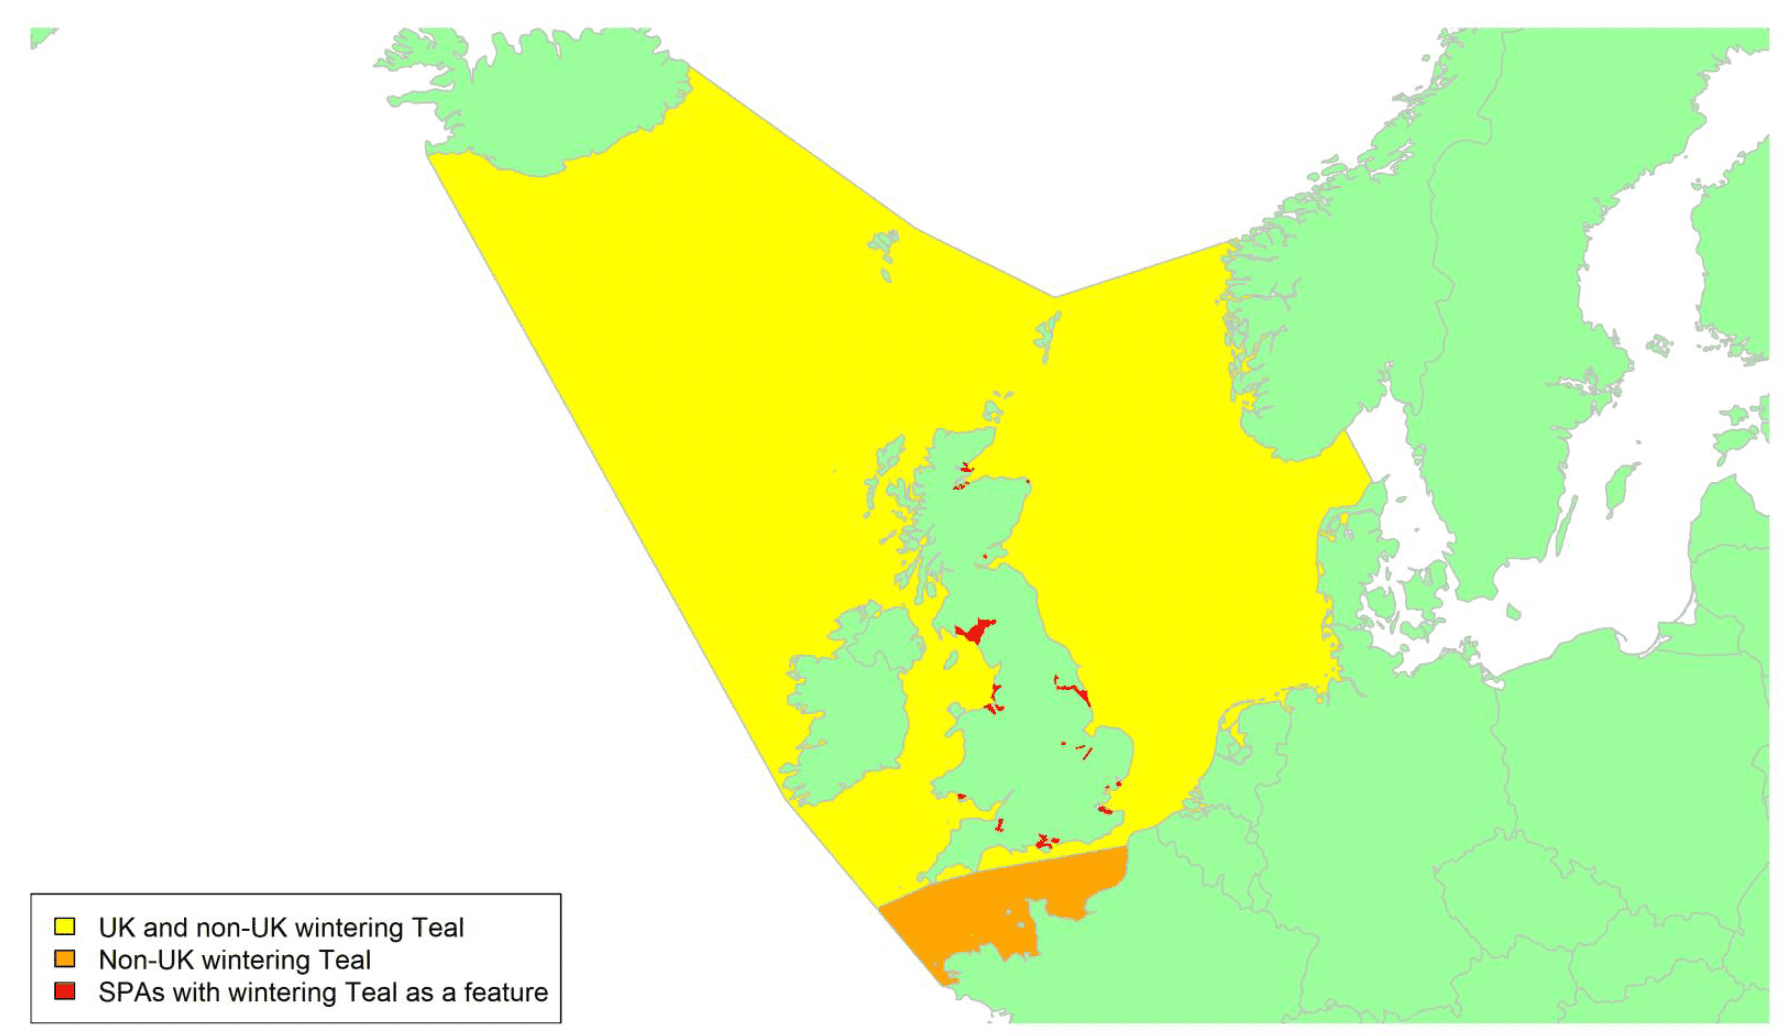
Migratory routes
Confidence: Low
Teal is found across Eurasia and most populations are migratory and highly responsive to local conditions such as drought or sub-zero temperatures. Arrival of birds from Iceland, Scandinavia and European Russia bring significant numbers into the UK each year, with around two-thirds of the flyway population wintering in the country, and hence potentially at risk of collision with wind farms in UK waters. This is a minimum estimate of the proportion of birds at potential risk as some Teal also pass through the UK and continue to wintering areas further south in Europe (Wernham et al. 2002). Those remaining in the UK have a relatively southerly distribution; just five SPAs for the species in winter are in eastern and south-west Scotland (Dornoch Firth & Loch Fleet, Inner Moray Firth, Loch Leven, Loch of Strathbeg, Solway Firth), compared with 15 in England and one in Wales. Detailed migration routes are not known, but the species is widespread across the UK, so likely migrates on a broad front, as shown by the yellow areas on the map for wintering birds above, with passage birds also crossing the English Channel (shown by the orange area).
Only one SPA is designated because of its importance for breeding Teal: Minsmere-Walberswick in East Anglia. Birds breeding in the UK are thought to shift southwards in winter and could cross waters to the south of the UK or across the southern part of the North Sea as shown on the map for breeding birds. Recoveries of birds ringed in Britain show marked cold weather movements to France and the Iberian Peninsula (Ridgill & Fox 1990). The small size of Teal makes them particularly sensitive to adverse weather, although this generally translates into departure rather than mortality (Guillemain & Elmberg, 2014).
Timing of migration
Confidence: Low
There is a clear but prolonged migratory season, with autumn migration extending from July to early December and spring migration from late February to May. Further influxes to/from Britain may occur in response to cold weather. There is an increase in BirdTrack reporting rates (see Appendix 2) for Scottish coastal waters from mid-July to late September in autumn and decreasing numbers from mid-April to the end of May in spring, but with some variation between the regions, and probably also variation between years. British-ringed Teal migrate earlier in spring after warmer winters (Ogilvie 1983), and warm and rainy winters are associated with earlier arrival of spring migrants in Finland (Guillemain & Elmberg, 2014; Vähätalo et al. 2004).
The earliest autumn influx indicated in the BirdTrack data occurs from Orkney and northeast Scotland in mid-July, perhaps reflecting the arrival of birds from Scandinavia. Migration through the Hebrides, the Highlands and Argyll (more likely to be birds from Iceland) is later, in late August to early September, mid-September to early October and early–mid October respectively (Appendix 2). Autumn reporting rates increase over several months on the Moray Firth from early August to late November and in the Hebrides from the end of August through to early December, suggesting ongoing movement of Teal into the UK into mid-winter.
Further south, there is an earlier and more prolonged increase in sightings from English coastal waters reported to BirdTrack. This starts slightly earlier in the northeast, from late May, than in the southeast, from early June), and probably involves UK-breeders heading south, ahead of the arrival of birds from Iceland and mainland Europe. Increasing numbers of reports from Northern Ireland are evident during mid-July to late September, and from Wales during late July to mid-September. Further increases from Northern Ireland into mid-winter presumably involve a continued arrival of Teal migrating from Iceland.
Spring movements are initially evident in Shetland from early March, but then further south on the Solway from mid-March and in Argyll, Clyde, and the Highlands in late March. Spring reporting rates in the Moray Firth and northeast Scotland decrease from mid-April, and in the Hebrides and Orkney from late April, as the Teal migrate north to their breeding grounds. A decline in reporting rates occurs at much the same time in England (from late March until mid-May), starting slightly earlier in Wales (from mid-March) and later in Northern Ireland (from mid-April) (Appendix 2).
Like other dabbling duck species, Teal are considered to migrate mostly at night (Guillemain & Elmberg 2014).
Flight heights
Confidence: Low
Flight height has not been measured specifically for free-ranging Teal, but was c. 50m in ducks (species not distinguished) according to Cooper & Ritchie (1995) from radar-tracking data (Guillemain & Elmberg 2014).
Given the lack of altitude data, it is recommended that 100% of birds are assumed to be at collision risk height in collision risk models.
Flight speeds
Confidence: Low
Mean flight (air) speeds for Teal have been estimated at 19.7 m/s (SD ± 4 m/s; n = 9 radar tracks of flapping flight) in Arctic and southern Sweden (Alerstam et al. 2007), and at 17.4 m/s (SD± 1.60; n = 55 runs) by theodolite during autumn migration through the Baltic (Pennycuick et al. 2013). This is comparable with speeds recorded for Teal flying in a wind tunnel (Engel et al. 2006; Guillemain & Elmberg, 2014; Kvist et al. 1998).
Studies of ringed and/or tagged birds, have described mean autumn movements of 60 km/day based on distances between ringing and recovery sites (Hilden & Saurola, 1982), and flights of > 200 km/day have been recorded (Fransson & Pettersson, 2001), but the record is of a radio-tagged bird that covered 1,285km in 24h which, assuming straight line flight without any stops, gives a precautionary mean speed of > 13.9 m/s (> 50km/h; Clausen et al. 2002, in Guillemain & Elmberg 2014).
The most robust estimates of flight speed available relate to those that are derived from radar or theodolite. In this instance, the estimates derived from theodolite are preferred as these reflect a much larger sample size. Consequently, for the purposes of collision risk modelling, a flight speed of 17.4 m/s (SD ± 1.60) is recommended.
Avoidance rates and behaviour
Confidence: Very Low
No species-specific avoidance rates were found during the literature review. The analysis of post-construction monitoring data collected for all duck species at onshore wind farm sites suggests that within-windfarm avoidance rates are likely to be in the order of 0.9851 (SD 0.00088) (Table 5).
Pochard Aythya ferina
SPA Species? |
Yes (breeding and non-breeding populations) |
|---|---|
SPA site codes (Introduction, Table 2) |
1:8:16:30:37:48:62:73:89:149 |
Population size breeding (UK) |
720 pairs (APEP4, 2020); uncertainty: medium |
Population size non-breeding (UK) |
29,000 individuals (APEP4, 2020); uncertainty: low |
Population size (Biogeographical flyway, SPA season) |
150,000 individuals (NE/NW Europe, non-breeding); uncertainty: high (Wetlands International, 2021) |
Percentage of biogeographical population at risk of collision in UK waters (passage/breeding/non-breeding) |
19% (breeding and non-breeding); uncertainty: high |
Movement of breeding birds
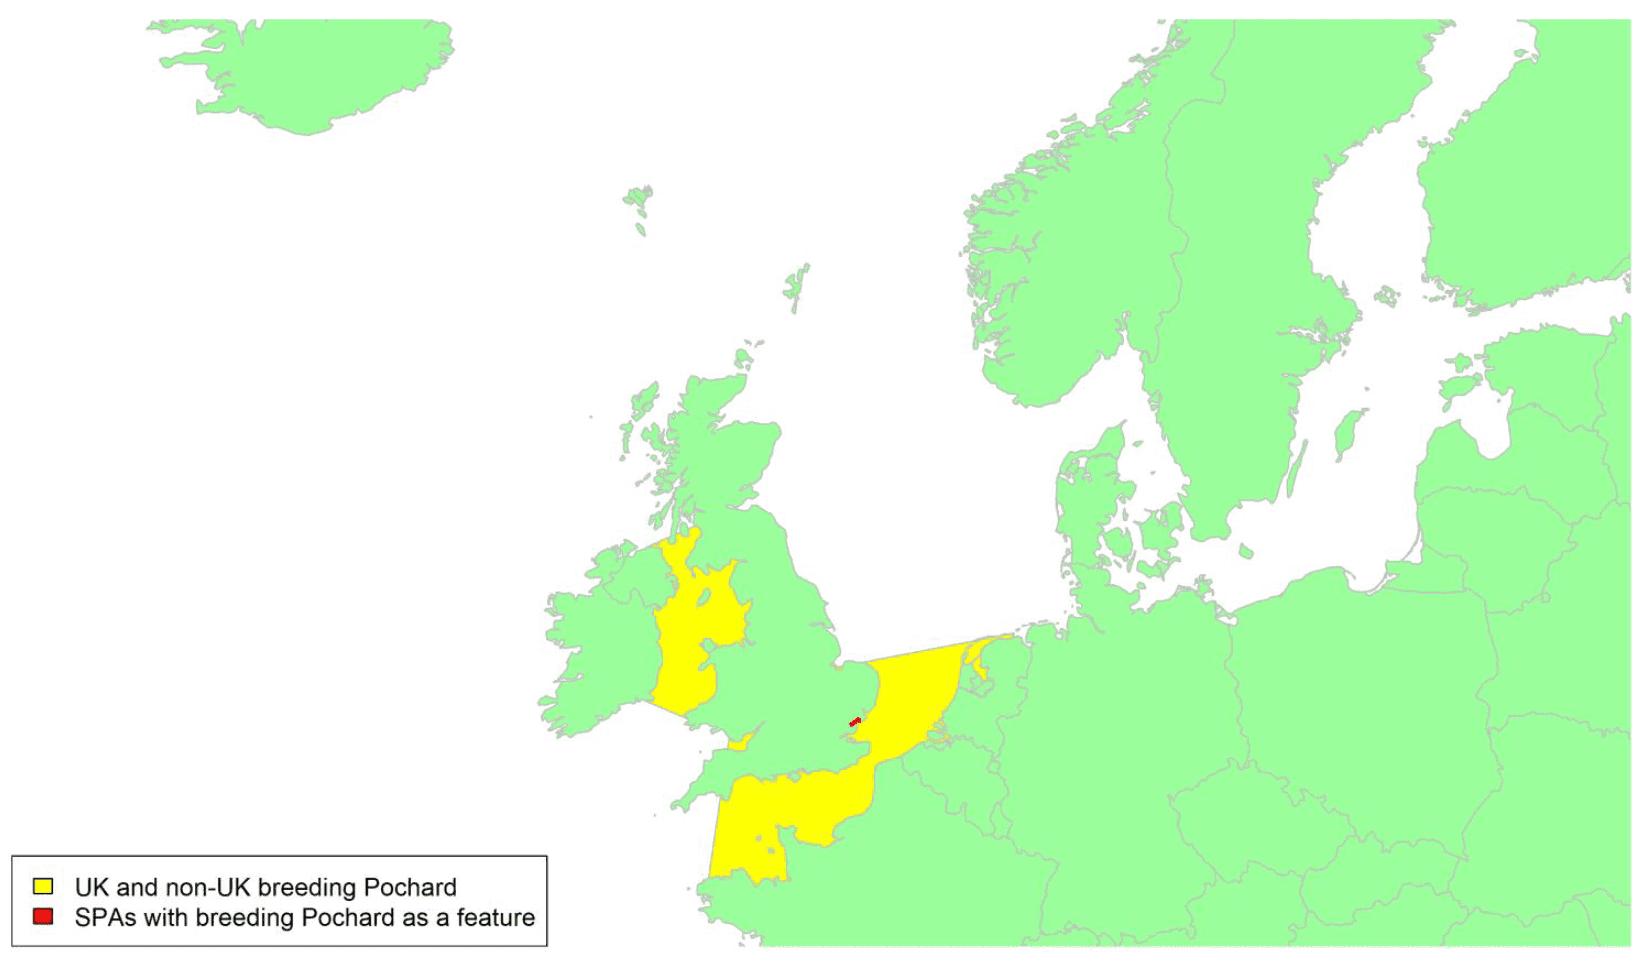
Movement of wintering birds
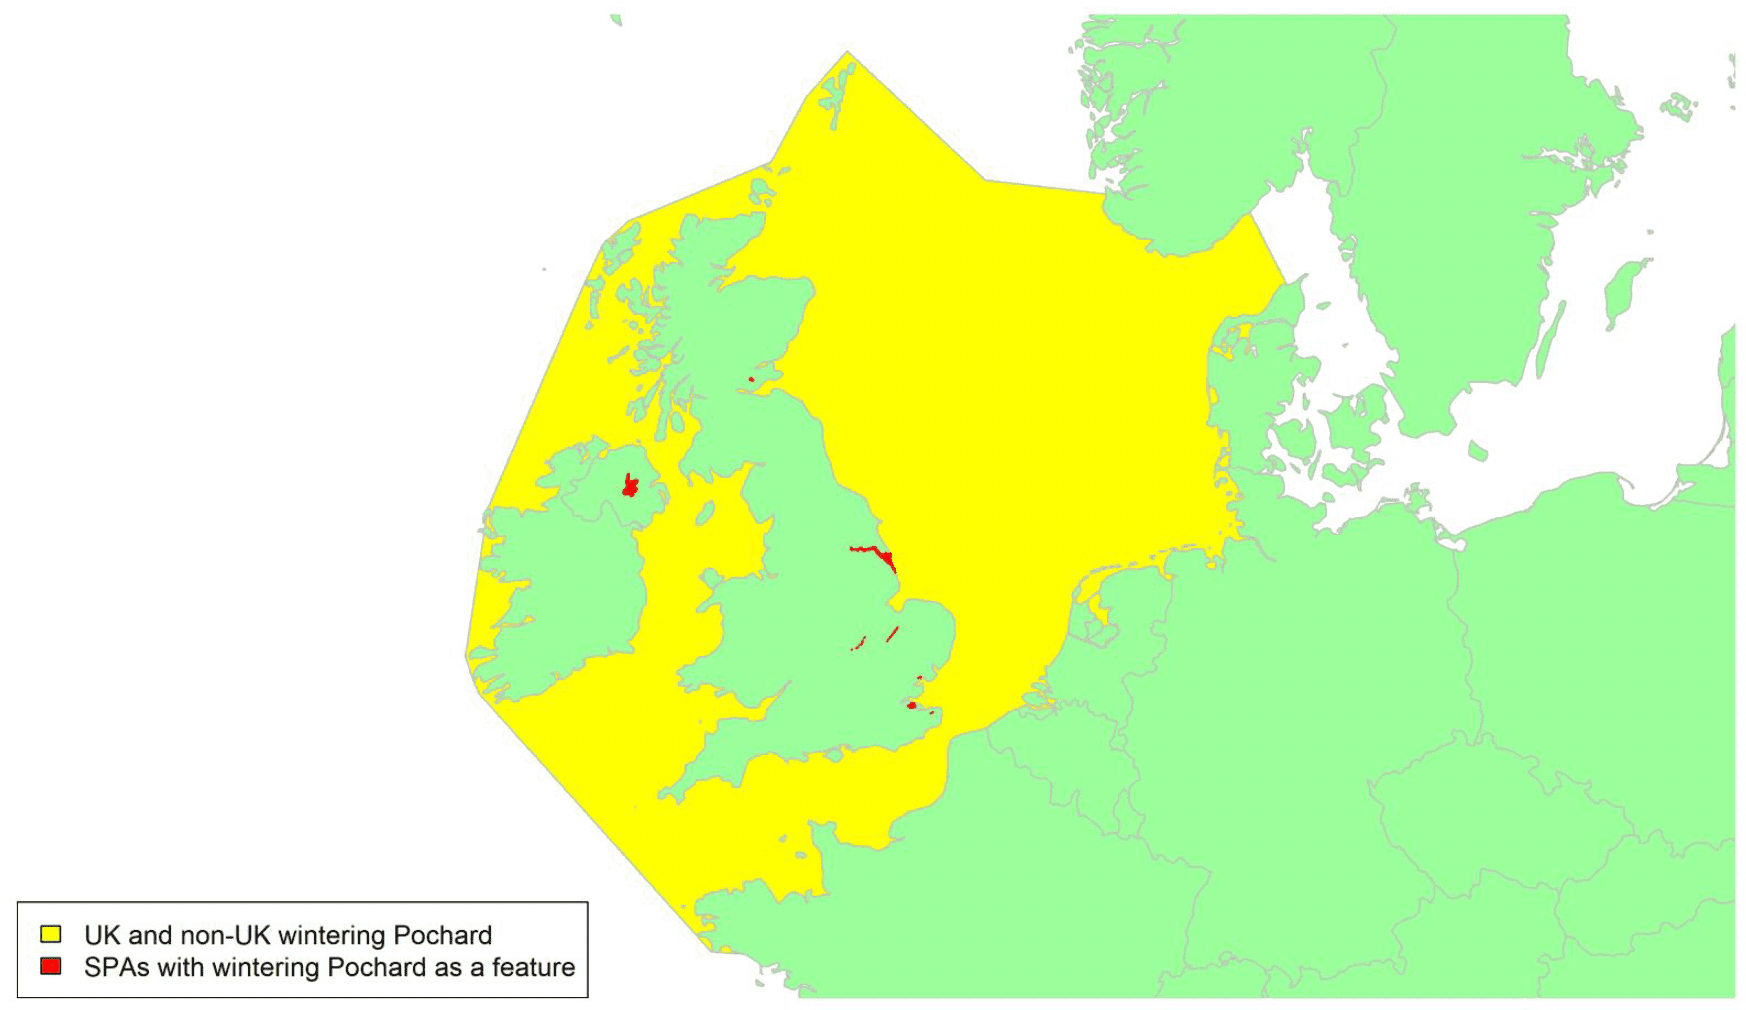
Migratory routes
Confidence: Low
Around 20% of the biogeographic population are potentially at risk of collision with wind farms in UK waters. However, this estimate assumes that the number of birds passing through UK waters on route from Scandinavia to wintering grounds further south is negligible.
The Pochard is found across much of Eurasia and is a partial migrant, with c. 1,000–2,000 individuals which currently breed in the UK (APEP4) being joined in winter by birds from across central and northern Europe (south of the tundra), particularly from the Baltic countries and Russia, and with some from western Asia (Fox & Salmon, 1988; Wernham et al. 2002). It is an uncommon breeding species in Iceland (Keller et al. 2020). Migration routes are not well known and birds wintering in the UK could potentially cross almost all UK waters, as shown by the yellow areas on the wintering map above. However, the vast majority of the 23,000 birds wintering in Britain (APEP4) and 11,150 in Ireland (including c. 4,800 in the Republic of Ireland; Fitzgerald, 2019) probably arrive over central and southern parts of the North Sea, with onward migration across the Irish Sea to Ireland. British-breeding birds tend to remain within Britain or move to Ireland for the winter, although some also cross the English Channel to wintering sites further south (as shown by the yellow areas on the breeding map above). Winter recoveries of individuals ringed in Britain during the breeding season are primarily from Britain, Ireland, France and the Netherlands, with only a few recoveries from Spain (Wernham et al. 2002). Conversely, Pochard ringed in western France have been recovered in southern England, although few are reported from more northerly latitudes, and about 40% of females breeding at the Grand-lieu study area remain there during temperate winters (Gourlay-Larour et al. 2014). Analysis of within-winter movements of Pochard in Europe (Euring databank data; n = 201 individuals) found marked regional variation in movement distances, which could be ascribed to topography (e.g., mountain ranges, coastlines). These data describe Pochard movement between central/southern Europe and the northwest coast of mainland Europe, and between the northwest coast of mainland Europe and the British Isles. However, there is little evidence for a direct within-winter exchange of birds between Britain and central/southern Europe (Keller et al. 2009).
In contrast to earlier studies (Carbone & Owen, 1995), there is no recent evidence for age or sex affecting the movement patterns, for instance for birds caught in France during winters 2004/05–2009/10, except that first-year individuals have a lower emigration probability (Gourlay-Larour et al. 2013). Stable isotope analysis suggests a lack of spatial segregation of the sexes for birds caught in France (Caizergues et al. 2016), and the Euring data analysis indicates that there are no significant differences between the sexes in the within-winter distances or directions, with only weak indications of differences between the age classes (Keller et al. 2009). Whilst there continues to be a bias in ratio of males to females wintering across Europe (e.g., Brides et al. 2017), the extent to which this is attributable to movement patterns or sex difference in survival rates remains unclear. Males gather to form moulting flocks, and the distribution of the moulting areas suggest that most seem to remain in the vicinity of their breeding grounds (Fox et al. 2016), although moulting birds ringed at Abberton Reservoir have been recovered from continental Europe (particularly Latvia) during the breeding season as well as from Britain and Ireland during winter (Fox & Salmon 1988, Kershaw 2002).
Major reductions in the numbers and distribution of the NE/NW European population from the late 20th century onwards have resulted in the Pochard being classed as Vulnerable in Europe (Birdlife International 2015) and globally (Fox et al. 2016, BirdLife International 2021). Further research therefore is required is to improve understanding of precise migration routes, including ascertaining whether migration occurs across a broad front or is concentrated in particular areas (as recommended by Wright et al 2012), to minimise risks to this species of conservation concern.
Timing of migration
Confidence: Low
Migratory Pochard arrive in Britain and Ireland mainly in October and November, and return in spring between February and early April, with most departing during March (Wernham et al. 2002). This is particularly evident in Scotland, where BirdTrack reporting rates (see Appendix 2) on the Solway increase from late September to the second half of October in autumn, with slightly earlier arrival over the Northeast coast and the Forth of Tay from early September onwards, followed by a drop in sightings from late February until mid-March, mid-April, and early May respectively. Movement to Northern Ireland is a little later, from late November to mid-December in autumn, with reporting rates decreasing with the departure of the winter visitors during March in spring. The more prolonged changes in reporting rates for England likely reflects a higher proportion of resident Pochards (in addition to winter visitors) in southern parts of Britain, as well as a movement of birds between Britain and Ireland. The clearer reporting pattern for Wales, with numbers increasing during October and early November in autumn and declining during March and the first half of April in spring, may include Pochard migrating to and from Ireland as well as those wintering in Wales.
Flight heights
Confidence: Low
Flight height data were not found for this species, though Krijgsveld et al. (2011) reports that non-marine ducks tended to fly higher above sea level than marine duck species, and that high altitude movements may have been missed during panorama scans. Altitude is weather dependent, with birds migrating at higher altitudes on tailwinds and flying lower into headwinds (Dirksen et al. 2007).
In the absence of data for this species, a precautionary assumption of 100% of flights at collision risk height is recommended.
Flight speeds
Confidence: Low
A mean flight speed of 23.6 m/s (SD value not provided) has been reported for flapping flight, for a single 190 sec radar track in northwest Europe (Arctic/S Sweden; Alerstam et al. 2007). Flight speeds of 22.2 m/s (maximum = 27.7 m/s) have been recorded for duck (species not determined) flying in tailwinds (Krijgsveld et al. 2011).
It is recommended that a speed of 23.6 m/s be used for the purposes of collision risk modelling, whilst noting that flight speed data are very limited for this species. In the absence of additional data with which to estimate variability around these figures, drawing from typical values for other species, a standard deviation of 2 m/s is suggested for this species.
Avoidance rates and behaviour
Confidence: Very Low
Avoidance rate data were not found for this species. The analysis of post-construction monitoring data collected for all duck species at onshore wind farm sites suggests that within-windfarm avoidance rates are likely to be in the order of 0.9851 (SD 0.00088) (Table 5).
Tufted Duck Aythya fuligula
SPA Species? |
Yes (non-breeding population) |
|---|---|
SPA site codes (Introduction, Table 2) |
1:48:55:62:73:89:149 |
Population size breeding (UK) |
16,500–19,000 pairs (APEP4, 2020); uncertainty: high |
Population size non-breeding (UK) |
140,000 individuals (APEP4, 2020); uncertainty: low |
Population size (Biogeographical flyway, SPA season) |
800,000–1,000,000 individuals (NW Europe, non-breeding ; Wetlands International, 2021 ; uncertainty: high |
Percentage of biogeographical population at risk of collision in UK waters (passage/breeding/non-breeding) |
>15.5% (breeding and non-breeding); uncertaint y: high |
A) Movement of UK wintering birds
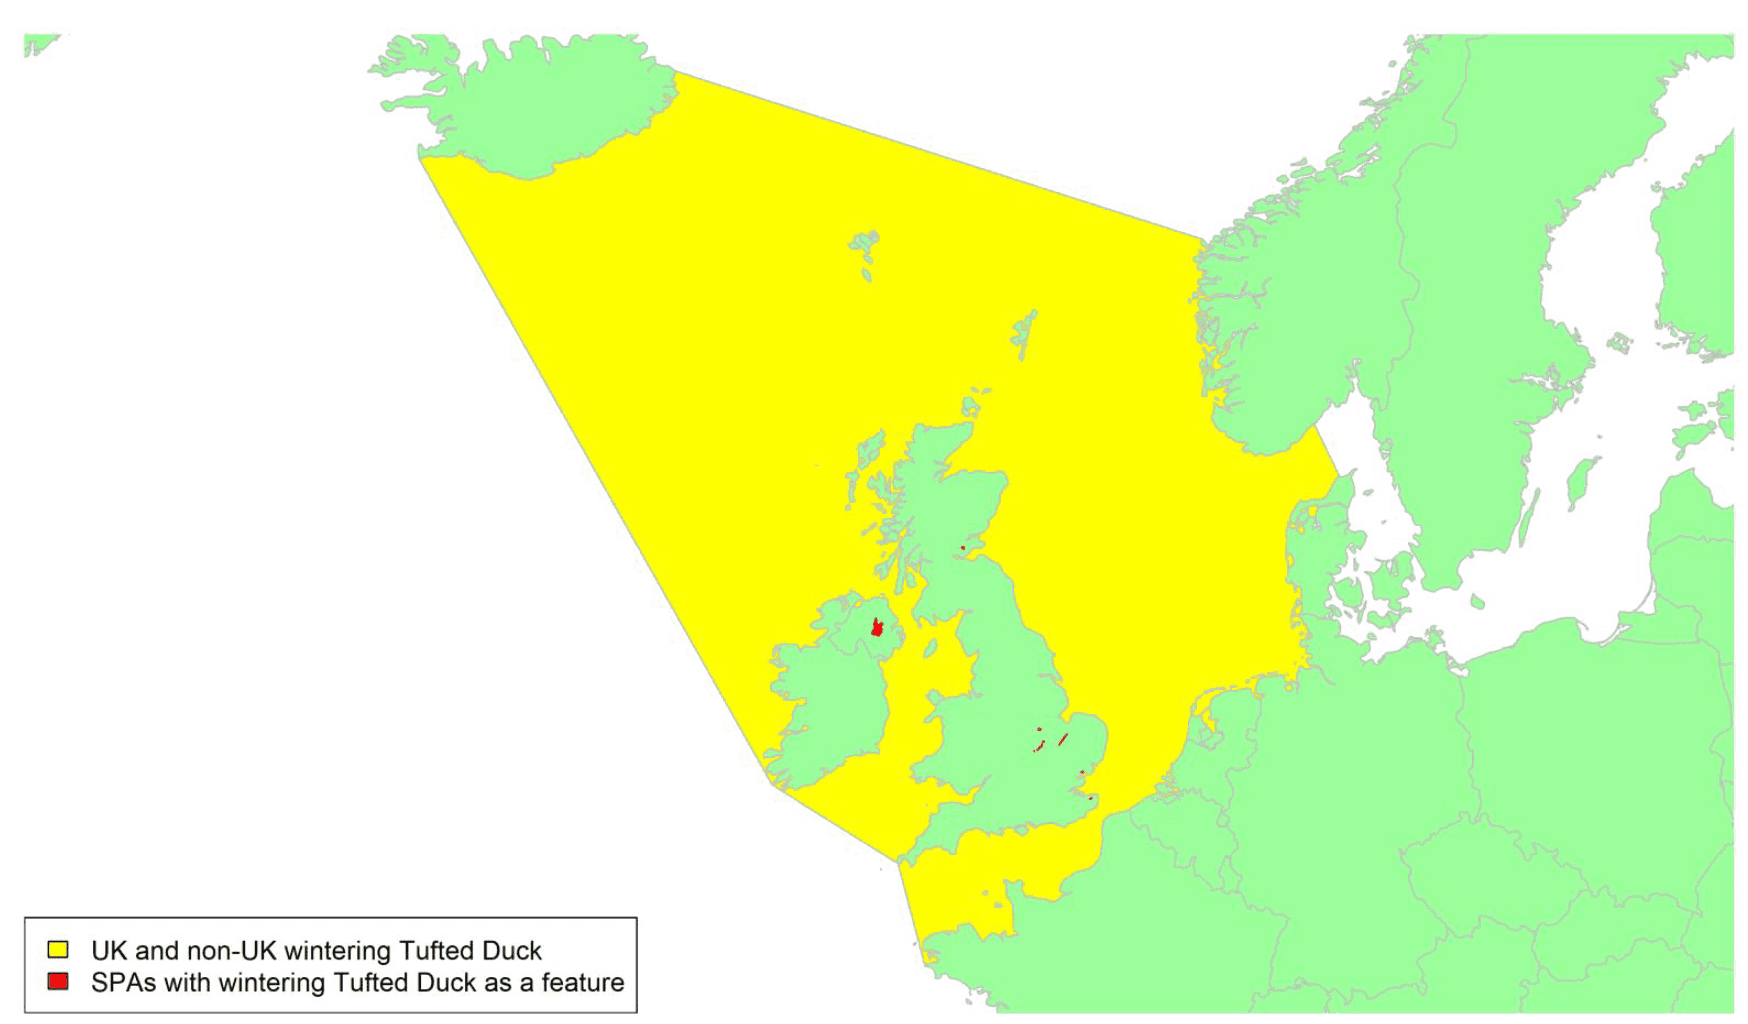
Migratory routes
Confidence: Low
The Tufted Duck is widely distributed across much of Eurasia and is a partial migrant with some populations migrating long distances and others much shorter distances. Although the Tufted Duck is a common breeding species in the UK, the country is much more important as a wintering area, with a major influx each autumn of birds from breeding grounds in Iceland, Scandinavia, and Russia. Extensive ring recovery data suggests a broad front migration from continental Europe over the North Sea to eastern Britain, as well as from Iceland to Scotland and Northern Ireland, although further research including tracking studies would help to confirm whether this is the case or if the birds follow narrower migration routes (Wernham et al. 2002, Wright et al. 2012). Northbound autumn migration also occurs across the English Channel, with females breeding in western France found to winter in the British Isles, in contrast to those of breeding in eastern France which mainly spend the winter on alpine lakes (Caizergues et al. 2016; Gourlay-Larour et al. 2012, 2013; Gourlay-Larour, 2013). Consequently, Tufted Duck wintering in the UK could cross almost all UK waters, as shown by the yellow areas on the above map.
Most British- and Irish-breeding Tufted Duck are resident throughout the year, but there is a tendency for these individuals to disperse in different directions. For instance, those from southeast Scotland show a propensity to move south-west into Ireland to winter, whereas birds ringed in southeast England have been recovered variously in Ireland, France, and the Netherlands as well as in England (Ogilvie 1987, Hearn 2002). Tufted Duck breeding in Northern Ireland probably winter in Ireland, whilst the winter visitors either migrate across the Irish Sea to Britain and beyond in spring (some to as far afield as Finland and Russia) or alternatively head in a northerly direction to Iceland (Evans & Day, 2011; Wright et al. 2012). Moult migration to Britain also occurs, with most recoveries being of males ringed in eastern Europe (Wernham et al. 2002).
Around 15% of the biogeographic population are therefore potentially at risk of collision with wind farms in UK waters, assuming that a substantial proportion of breeding birds make some over-seas movement. However, this estimate excludes the unknown number of birds which may move through UK waters on passage from their breeding areas to wintering grounds further south, as well as any birds which make a moult migration to the UK but do not then stay to winter. The proportion of the population potentially at risk is therefore likely to be higher than 15%, but improved understanding of Tufted Duck movements Is needed to estimate how much higher it might be.
Tufted Duck migration to and from the UK is also affected by weather conditions, with significant increases in cold weather recoveries in Britain and Ireland of birds from continental Europe, as well as in France and Iberia of UK-ringed individuals (Ridgill & Fox 1990). Recent stable isotope analysis has similarly found that Tufted Duck with more northern origins winter further south (in France) in cold winters (Caizergues et al. 2016).
Timing of migration
Confidence: Low
With both resident and migratory Tufted Duck occurring in the UK, and seasonal movement of individuals between Britain and Ireland, the timing of migration is not well defined. Autumn migration is generally from October onwards, however, represented by an increase in BirdTrack reporting rates (see Appendix 2) along Scottish coastal waters during October and from mid-October into the New Year in England. Spring migration may start as early as February, but most of the migratory birds leave Britain and Ireland in April to late May (Hearn 2002). A continuing decrease in reports to BirdTrack until late June of Tufted Duck along Scotland's coast is rather late for migration, so may perhaps be indicative of local movements. Whether an even longer decline in the BirdTrack records from English coastal waters (extending to late July in the eastern parts of the country), with reports from Northern Ireland also dropping between mid-June and mid-July, encompass a combination of spring and moult migration is hard to ascertain.
Flight heights
Confidence: Low
Tufted Duck flying into strong headwinds over Lake Ijsselmeer, in the Netherlands, tracked by radar, were found to be at 20–30 m over open water (Dirksen et al. 2007)
Given the general lack of altitude data, it is recommended that 100% of birds are assumed to be at collision risk height in collision risk models.
Flight speeds
Confidence: Low
A mean flight speed of 21.1 m/s ± 1.1 (n = 3 tracks) is reported for flapping flight in northwest Europe (Arctic/S Sweden; Alerstam et al. 2007).
It is recommended that a speed of 21.1 ± 1.1 m/s be used for the purposes of collision risk modelling, with the proviso that flight speed data are very limited for this species.
Avoidance rates and behaviour
Confidence: Very low
Avoidance rate data were not found for this species. The analysis of post-construction monitoring data collected for all duck species at onshore wind farm sites suggests that within-windfarm avoidance rates are likely to be in the order of 0.9851 (SD 0.00088) (Table 5).
Scaup Aythya marila
SPA Species? |
Yes (non-breeding population) |
|---|---|
SPA site codes (Introduction, Table 2) |
30:54:63:78:114:116:123:135:199 |
Population size breeding (UK) |
0–1 pair (APEP4, 2020); uncertainty: medium |
Population size non-breeding (UK) |
6,400 individuals (APEP4, 2020); uncertainty: medium |
Population size (Biogeographical flyway, SPA season) |
240,000–280,000 individuals (NW/C Europe, non-breeding; Wetlands International, 2021); uncertainty: high |
Percentage of biogeographical population at risk of collision in UK waters (passage/breeding/non-breeding) |
2.5% (non-breeding, including c. 200 individuals migrating to the Republic of Ireland; Burke et al. 2018); uncertainty: high |
Movement of wintering birds
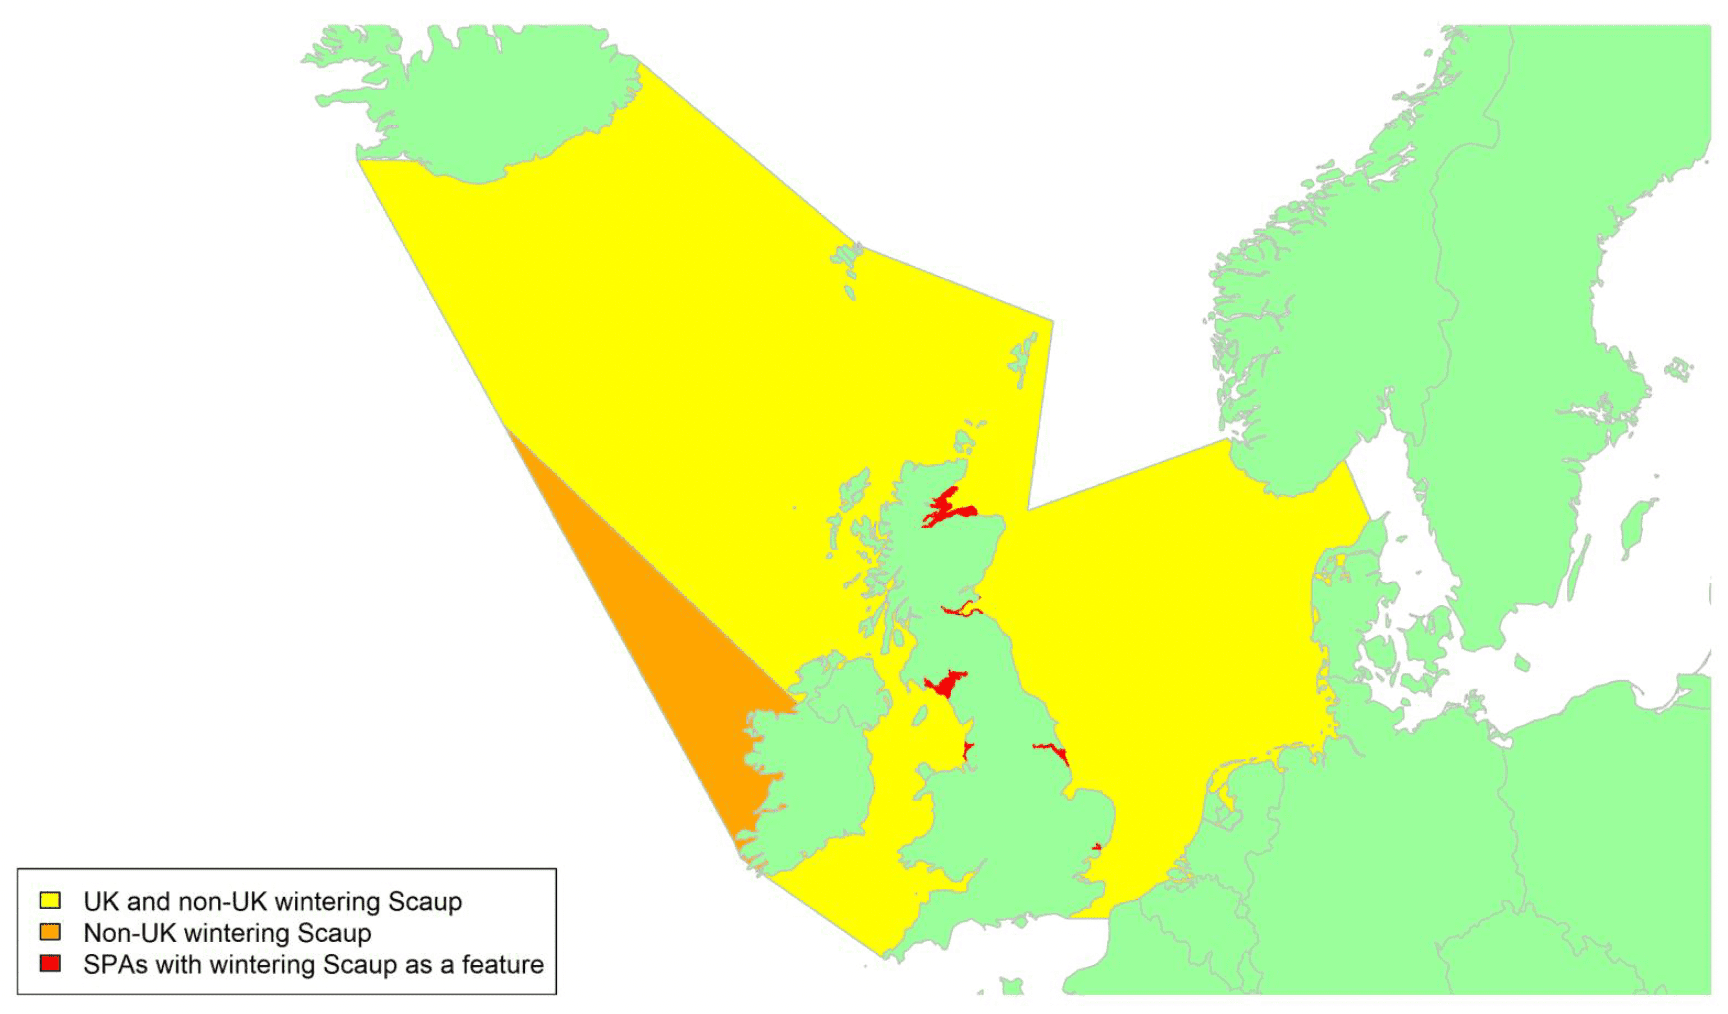
Migratory routes
Confidence: Low
The Scaup has a panarctic breeding distribution, with the nominate subspecies nesting at high latitudes across northern Eurasia from Iceland east to the Lena River in Siberia. It very rarely breeds in the UK, but several thousand birds migrate from Iceland and northern mainland Europe to winter in Britain and Ireland. The numbers of birds reaching Britain and Ireland are relatively small and only around 2.5% of the biogeographic population are potentially at risk of collision with wind farms in UK waters. The proportion of individuals arriving from different parts of the breeding range is unclear because of biases in ringing activity, but the few Scaup ringed in Britain and Ireland have been recovered from areas extending from Iceland to western Siberia (Wernham et al. 2002). The vast majority of recoveries within the British Isles are of birds ringed in Iceland, and these are strongly linked to Ireland as well as to Britain, suggesting broad front migration between the countries. UK recoveries of birds ringed in Finland however reinforces the view that some come from further afield, and that a proportion of the wintering flocks include birds that breed in Fennoscandia and further east into Russia.
Within Britain, wintering Scaup have a relatively northerly distribution and occur mainly in coastal areas, although some do move inland to freshwater areas (Wright et al. 2012). Irish-wintering birds are widespread along coastal and at some inland waters, with most occurring in Northern Ireland (Burke et al. 2018), particularly at Loughs Neagh and Beg (where the species has also bred), but with concentrations still found at Tralee Bay and Akeragh Lough in southwest Ireland and also at Lough Gill in Co. Sligo (Lewis et al. 2019). Numbers in both Britain and Ireland have declined markedly over the past two decades (Frost et al. 2021, Lewis et al. 2019), but especially in the south-west part of the range, with 93.8% of 2,650 Scaup most recently estimated for the island of Ireland being found in Northern Ireland (Burke et al. 2018). Scaup wintering in the UK may cross most UK waters as shown by the yellow area on the above map. Overall, however, the northerly distribution of Scaup in Britain and Ireland, and the movement of birds from Iceland to the UK, suggests that migration over UK waters is likely to be concentrated around the coasts of Scotland and Ireland, with routes from continental Europe being less clear.
Timing of migration
Confidence: Low
Migration routes across UK waters and the precise timing of migration are not well understood, but Wetland Bird Survey data indicate that the majority of birds arrive at UK wintering areas between September and December, with main departures between February and April (Wright et al. 2012, Frost et al. 2021). The BirdTrack data (see Appendix 2) similarly show a clear increase in autumn reporting rates in Scottish coastal waters from the second half of August until mid-October, particularly in northeast Scotland and the Forth and Tay regions. The birds arrive a little later along the English coast, with a build-up in reports from the second half of September until mid-November, extending to late December in Wales (Appendix 2). There is no clear pattern in the BirdTrack data in the timing of movement to or from Northern Ireland, where reporting rates peak in late January.
Spring departure is illustrated by a decline in reporting rates as the birds head north to their breeding grounds, which is evident in Scotland from mid-March until early April, and over a slightly longer period from February to mid–late April in England and Wales. More information on the migration routes of Scaup wintering in the UK is needed to determine whether variation between regions in the timing of their arrival and departure is associated with the birds' breeding localities.
Flight heights
Confidence: Low
Maximum flight heights of 40 m during daylight/twilight, and 50-80 m at night, were recorded for Scaup tracked by radar over Lake Ijsselmeer in the Netherlands (Dirksen et al. 2007).
Given the general lack of altitude data, it is recommended that 100% of birds are assumed to be at collision risk height in collision risk models.
Flight speeds
Confidence: Low
A single radar track has recorded Scaup flying at 21.1 m/s (airspeed for flapping flight) in northwest Europe (Arctic/S Sweden; Alerstam et al. 2007), and observational data put ground flight speed at 14.6–21.3 m/s (n=2) for Scaup in the Great Lakes, USA, based on a visual assessment of the length of time it took for birds to travel between two known points (Binford & Youngman, 2010).
Based on the methodologies underpinning these data, it is recommended that a speed of 21.1 m/s be used for the purposes of collision risk modelling, with the proviso that flight speed data are very limited for this species. In the absence of additional data with which to estimate variability around these figures, drawing from typical values for other species, a standard deviation of 2 m/s is suggested for this species.
Avoidance rates and behaviour
Confidence: Very low
Avoidance rate data were not found for this species. The analysis of post-construction monitoring data collected for all duck species at onshore wind farm sites suggests that within-windfarm avoidance rates are likely to be in the order of 0.9851 (SD 0.00088) (Table 5).
Eider Somateria mollissima mollissima
SPA Species? |
Yes (non-breeding population) |
|---|---|
SPA site codes (Introduction, Table 2) |
33:123:124:165:195:197:199:200:201:202 |
pSPA site codes (Introduction, Table 2) |
252 |
Population size breeding (UK) |
35,000 pairs (excluding Shetland; APEP4, 2020,); uncertainty: medium |
Population size non-breeding (UK) |
81,000 individuals (excluding Shetland; APEP4, 2020); uncertainty: medium |
Population size (Biogeographical flyway, SPA season) |
560,000–920,000 individuals (Baltic, North & Celtic Seas population); uncertainty: medium (Wetlands International, 2021) |
Percentage of biogeographical population at risk of collision in UK waters (passage/breeding/non-breeding) |
8.9%–14.5% (breeding and non-breeding) ; uncertainty: high |
Movement of wintering birds
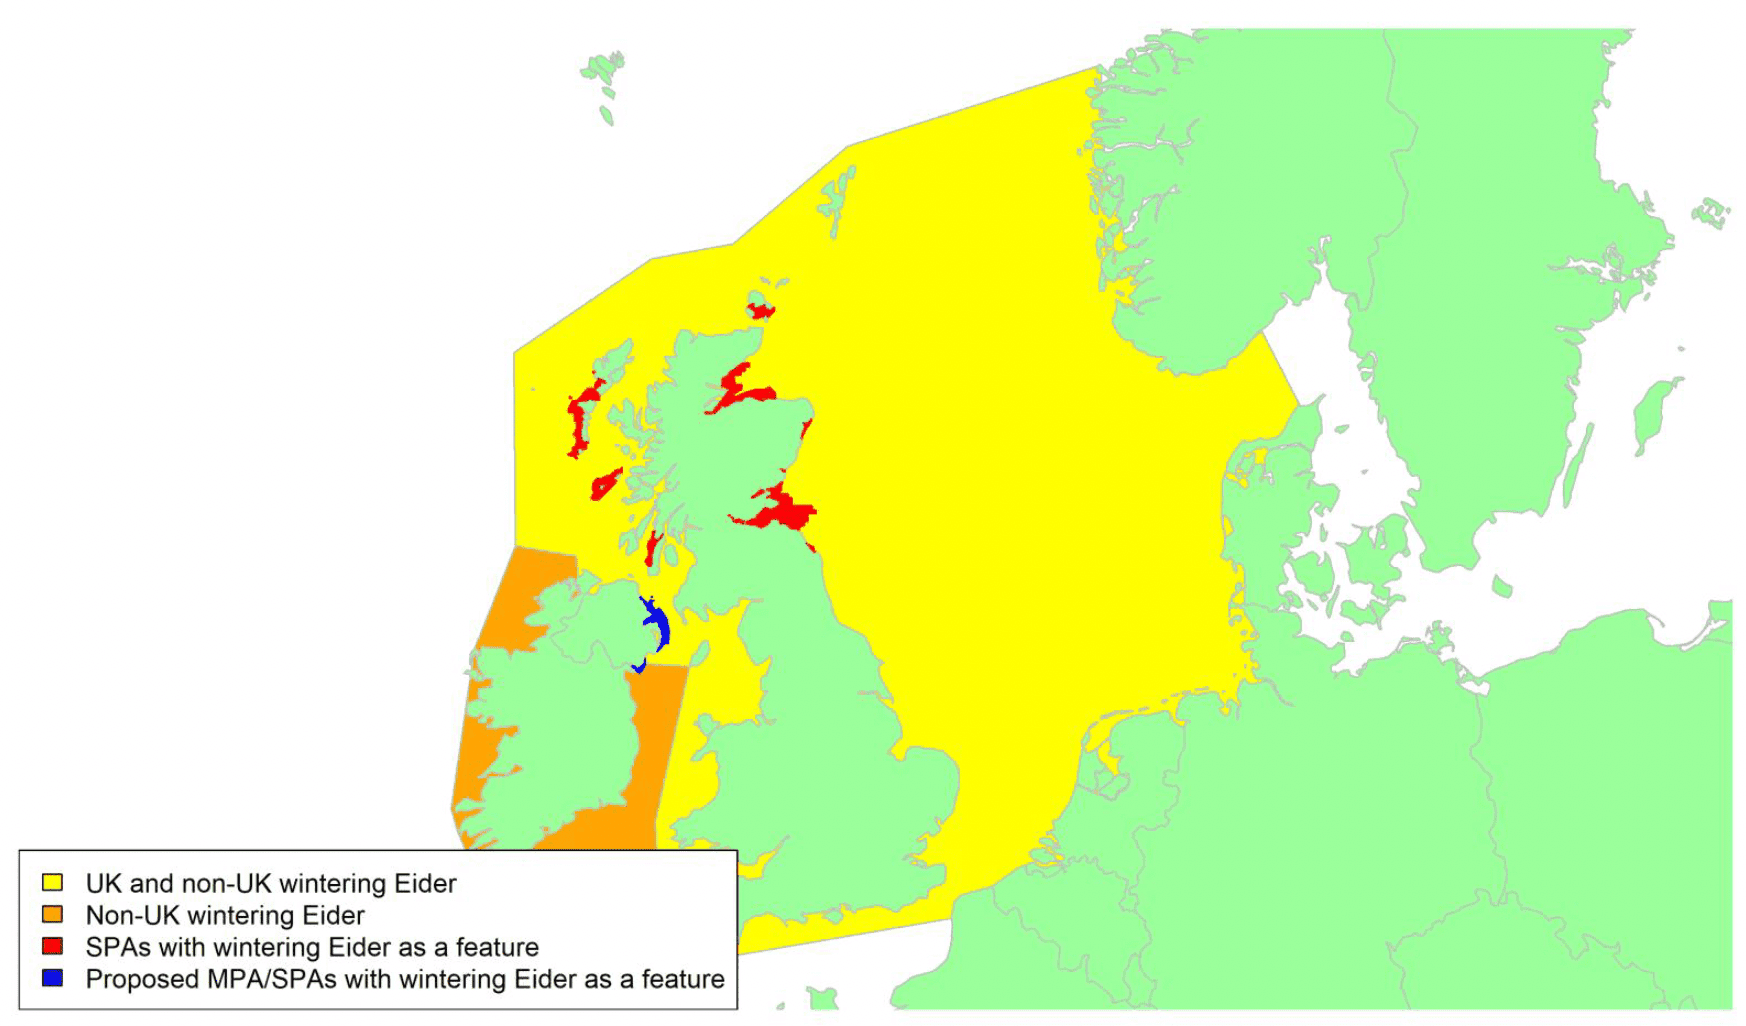
Migratory routes
Confidence: Low
Eider breed widely around the Arctic and sub-Arctic regions and the UK supports two subspecies. For the purpose of marine SPA classification, it is presumed that Eider in mainland UK and Orkney are from the S. m. mollissima population which is migratory whereas the Shetland population is S. m. faeroeensis and non-migratory (and therefore not covered by Birds Directive for purposes of SPA selection). Consequently, S.m. faeroeensis is not covered by this review and this account focuses on S.m. mollissima.
However, unlike most other populations of the same subspecies, UK-breeding Eiders of S.m. mollissima are largely sedentary, with most remaining in Britain and Northern Ireland throughout the year. They have recently been grouped into the Baltic, North & Celtic Seas population (Lehikoinen et al. 2020, Wetlands International, 2021), and there is some exchange of individuals with those breeding in Norway and Russia. Immigration of wintering Eider from other parts of Europe generally appears to be low, although ring recoveries include cases of birds from the Baltic, Denmark and Norway that migrated to winter in Scotland, whereas those from the Netherlands may relocate to southern Britain (Baillie & Milne, 1989; Swennen, 1990; Wernham et al. 2002). Wintering Eider could therefore cross the North Sea on a broad front, as shown by the yellow area on the map above. Recoveries of British-ringed Eiders in Scandinavia indicate that some British-born males join the Baltic-breeding birds, perhaps on pairing with Scandinavian females wintering in Britain (Baillie & Milne, 1989). A more recent assessment of recoveries for Eiders ringed in different parts of Europe reinforced the view that British Eiders are largely sedentary or show small-scale migration movements along the east coast. British-ringed birds found in Danish waters in autumn and winter, and in Finland in summer, were almost exclusively males, which had probably mated with Baltic females wintering along the east coast of Britain (Lehikoinen et al. 2020). A small number of continental migrants may continue west to Ireland, but this is thought to be exceptional.
Major aggregations occur on the east coast of Scotland during winter, with the Outer Firth of Forth and St Andrews Bay Complex SPA supporting more than 35% and the Firth of Tay 18% of the British-wintering population. In Ireland, the species occurs mainly along the northern coastlines, with Belfast Lough a main site for them there. The extent to which Eiders move between Britain and Ireland (primarily Northern Ireland) has yet to be determined.
Assuming only very limited connectivity between British and Baltic birds occurs, between 8.9% and 14.5% of the biogeographic population are potentially at risk of collision with wind farms in UK waters. However, given that the Eider is a marine species which frequents coastal waters, wind farms are more likely to be an issue for the species when they overlap with the birds' marine feeding areas. Relatively little is known, however, about the foraging range for the species (Thaxter et al. 2012).
Timing of migration
Confidence: Low
There are few clear movement patterns evident in the BirdTrack data (see Appendix 2) for Eiders in Northern Ireland or different parts of Scotland, except for apparent dispersal from the Forth and Tay region from mid-October to early December. An increase in reports from southern England during autumn (e.g., in south-west England from mid-November to early December) reflects a southward shift in the species' distribution along the British coastline during the winter months. In June the birds begin to disperse from the breeding colonies and congregate to moult, with those in northern Scotland tending to move south to do so (Milne, 1965).
Flight heights
Confidence: Low
Eiders generally fly at low altitudes. Observations made in the NW Atlantic in spring and autumn gave a mean flight height of 1.2 m (s.d. ± 0.4, n = 81; Sadoti et al. 2005), and median flight heights of up to 5 m were reported for birds seen in the North and Baltic Seas (Garthe & Hüppop, 2004). Moreover, the birds tend to fly lower inside a wind farm; 84.2% of flocks recorded on horizontal TADS video sequences within the Nysted offshore wind farm were at < 30m (i.e. below the sweep of the rotors) compared with 55.7% outside of the site (Desholm, 2006).
Based on the available data, for the purposes of modelling collision risk in relation to migrating birds, it is recommended that a precautionary estimate of 25% of birds at collision risk height is used.
Flight speeds
Confidence: Medium
Flight speeds recorded have been quite consistent, with three studies putting mean airspeeds at 17.9 ± 2.4 m/s (radar studies of 240 tracks in Arctic and southern Sweden; Alerstam et al. 2007), 19.0 ± 1.6 m/s (25 theodolite measures in the Baltic in autumn; Pennycuick et al. 2013) and 20.2 ± 3.51 m/s (2 runs in Scandinavia in autumn; Pennycuick, 2001) respectively. Radar studies similarly put mean groundspeed (i.e., mean airspeed corrected for wind assistance) at 17.34 m/s (s.d. = 2.40, n = 352) for Common Eider flocks identified to species off the southern coast of Denmark during 1999–2004 (Desholm 2006).
Data describing Common Eider flight speeds have been derived from studies using radar or theodolite. Based on the sample sizes of the studies we identified, we suggest the speed of 17.34 m/s ± 2.4 reported in Desholm (2006) is used for the purposes of collision risk modelling.
Avoidance rates and behaviour
Confidence: Medium
Avoidance rates are relatively well documented for the species, with Eiders comprising c. 33.8% of waterbirds studied migrating in relation to wind farms in the Baltic region (Desholm, 2006), although flocks were not always identified to species level. Tulp et al. (1999) used ship radar to study avoidance behaviour in the vicinity of a 10-turbine offshore wind farm and found reduced flight activity in the vicinity of the wind farm at distances of 1500 m. Radar studies similarly showed macro avoidance, with Common Eider modifying their flight trajectories (in response to seeing the turbines) at an average distance of 3 km during daylight (less at night) in comparison with pre-construction flight patterns (Desholm, 2006; Fox et al. 2006). Moreover, the percentage of flocks entering the wind farm area decreased significantly (by a factor 4.5) from 40.4% (n = 1406) pre-construction to 8.9% (n = 779) on initial operation, and those that did enter the wind farm showed a marked tendency to fly in the corridor between individual turbines (Desholm & Kahlert, 2005).
Migrating flocks were more prone to enter the wind farm at night than during the day (13.8%, n = 289 and 4.5%, n = 378, respectively), but counteracted the higher risk of collision in the dark by increasing their distance from individual turbines and flying in the corridors between turbines (Desholm & Kahlert, 2005).
Overall, < 1% of the ducks and geese migrated close enough to the turbines to be at any risk of collision (Desholm & Kahlert, 2005). Eider movements are prone to being funnelled by the topography of the coast because they are less likely to fly over land, and thus headed towards the Nysted wind farm (Desholm, 2006). Nonetheless, Common Eiders tended to minimise the number of rows crossed within a wind farm by taking the shortest route out of it. Model analysis found that the collision risk for Eiders at Nysted was between 0.020–0.021% amounting to 47.1 Eiders colliding during autumn migration, and 1.4 collisions per turbine per year (Desholm, 2006).
Further analysis of the Eiders' movements at Nysted found a median minimum avoidance distance of 224m post-construction (Masden et al. 2009), in line with avoidance of c. 200m at the Tunø Knob wind farm, Denmark (Larsen & Guillemette, 2007). The same study also found that eiders showed a greater avoidance response than other species observed in the study area, indicating that eiders are more risk averse and thus prone to displacement or barrier effects. Masden et al. (2009) additionally calculated that the extra distance flown by migrating eider on avoiding the wind farm was c. 500m – 0.04% of the estimated distance flown between the wintering and breeding grounds – which is minimal for a single event, but cumulative effects of the birds encountering a series of wind farms should be considered, particularly when located in the vicinity of important feeding areas. These data highlight that both macro and meso avoidance rates are likely to be high for common eider.
The data set out above highlight that macro and meso-avoidance for common eider is likely to be very high. However, it is important to note that avoidance rates used for collision risk modelling must account for model error in addition to the behavioural response of the birds (see Masden et al. 2021). Consequently, whilst the available evidence relating to macro- and meso-avoidance is strong, these data do not account for either model error or, the last-second "micro-avoidance". In the absence of more detail of both of these factors, we suggest that the generic estimate for within-windfarm avoidance (meso- and micro-avoidance) for duck species, estimated from analysis of post-construction monitoring data, of 0.9851 (SD 0.00088) is likely to be the most appropriate value to use for the purposes of collision risk modelling.
Velvet Scoter Melanitta fusca
SPA Species? |
Yes (non-breeding population) |
|---|---|
SPA site codes (Introduction, Table 2) |
123:124:199:202 |
Population size breeding (UK) |
0 pairs (APEP4, 2020); uncertainty: medium |
Population size non-breeding (UK) |
3,350 individuals (APEP4, 2020); uncertainty: medium |
Population size (Biogeographical flyway, SPA season) |
220,000–410,000 individuals (Western Siberia & N/NW Europe; Wetlands International, 2021) ; uncertainty: high |
Percentage of biogeographical population at risk of collision in UK waters (passage/breeding/non-breeding) |
1.1% (non-breeding); uncertainty: high |
Movement of wintering birds
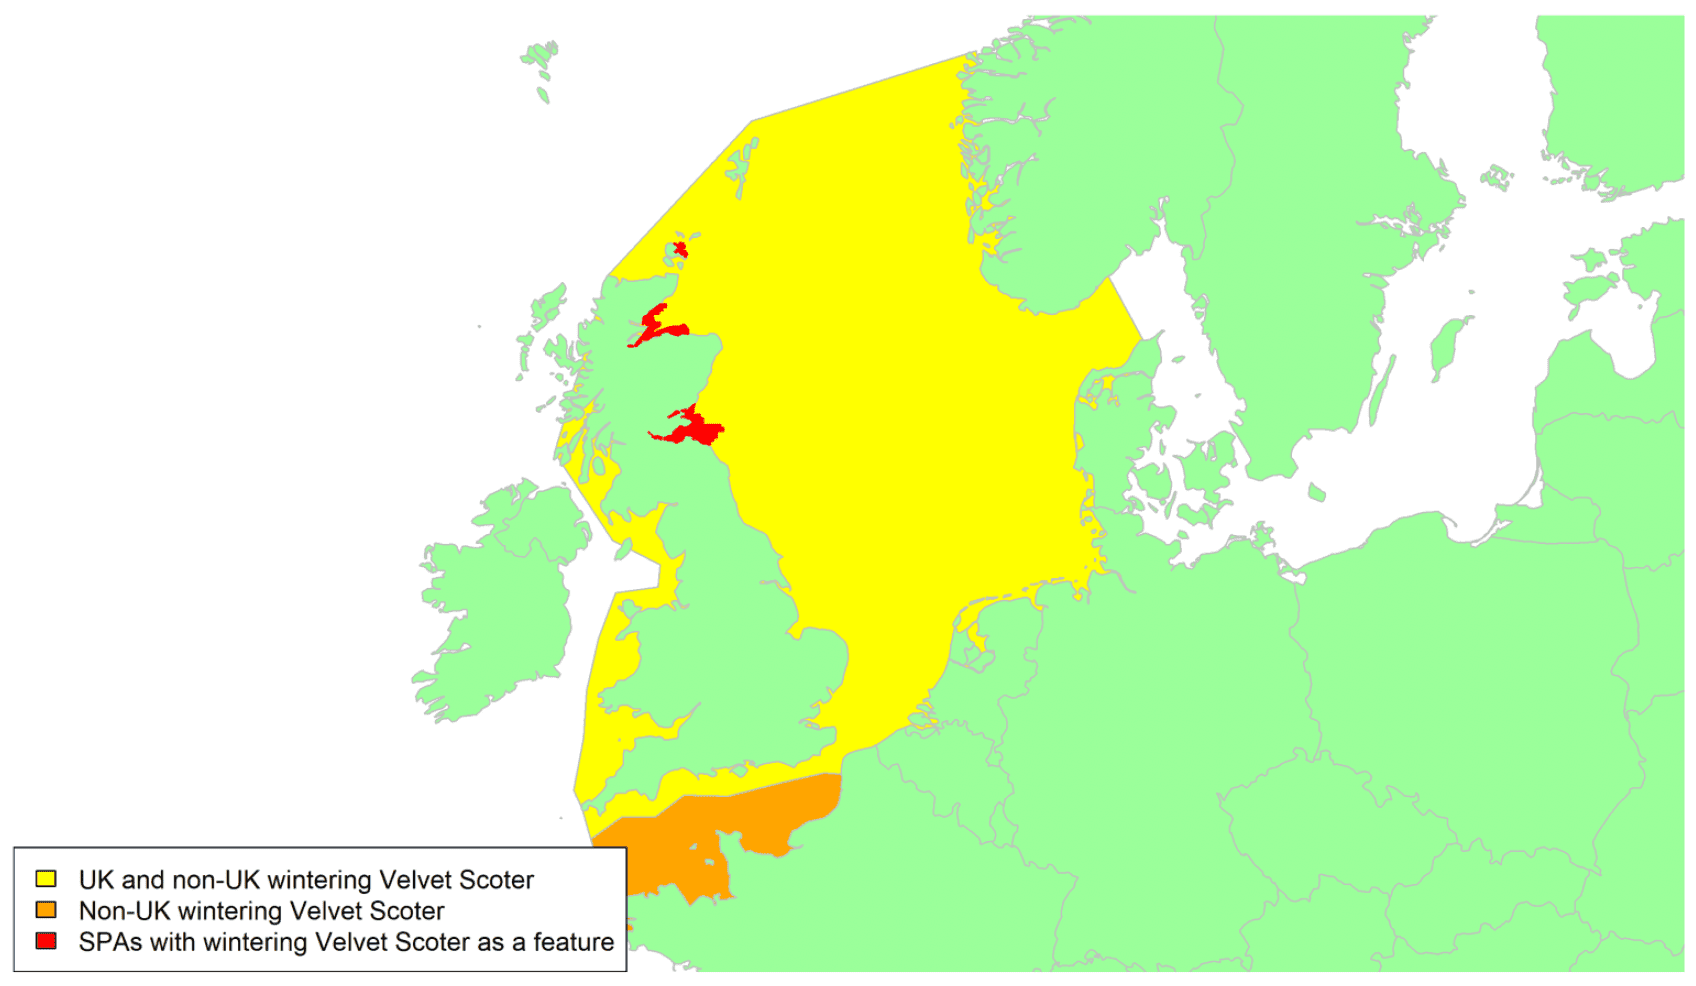
Migratory routes
Confidence: Low
The Velvet Scoter breeds in Scandinavia and migrates to the Baltic Sea and along the coasts of Western Europe, with a relatively small proportion of the population wintering in Britain. Here it occurs on the east coast, especially in Scotland, northeast England, and Norfolk. It is a rare winter visitor to coastal areas of Ireland (< 10 individuals recorded annually; Birdwatch Ireland, 2021), but may be seen in flocks of Common Scoter from October to March. Only a very small proportion of the biogeographic population reach the UK, with around 1% of the population being potentially at risk of collision with wind farms in UK waters.
Precise migration routes to Britain are not known, but they are presumed to cross the North Sea on a relatively broad front, as shown by the yellow area on the above map. However, the majority of the population will cross within the northern portion of this area to reach their main UK wintering sites in northeast Scotland. Here the Moray Firth is particularly important; a mean peak annual non-breeding population of 1,488 individuals in winters 2001/02 to 2005/06 accounted for 59.5% of the GB-wintering population (Kalejta-Summers & Butterfield, 2006; NatureScot, 2021), although given the population decline in recent decades (Dagys & Hearn, 2018) numbers may now be lower.
Timing of migration
Confidence: Low
This species is a winter migrant to eastern Britain, mostly on the east coast of Scotland, with birds arriving in the UK during mid-late summer and remaining to the following spring. Reporting rates in the BirdTrack data (see Appendix 2) increase for Scottish coastal waters from late June to end September as the birds returned to Scotland and decrease from mid-April to late May as they depart for the breeding grounds in spring. Arrival is first evident in Northeast Scotland from mid-June and in the Forth and Tay from mid-July but is a little later at the Moray Firth from the 3rd week in September. In spring, reporting rates decline at the Forth and Tay from mid-March and at the Moray Firth from late March and across Scottish coastal waters as a whole from early April to end May. Further south, reports are higher in Eastern England than elsewhere, with a pulse in movement (increase then decline) from October to mid-December (Appendix 2).
Marine ducks fly actively at night as well as during the day (e.g., Tulp et al. 1999), and it is likely that this is also the case for the Velvet Scoter.
Flight heights
Confidence: Low (data highly variable)
Flight heights have been estimated at 1m in British coastal waters (observations of 20 birds at 3 sites; Cook et al. 2012), and the species generally flies low in flocks or lines ("strings"), especially on short-distance flights, spending most of their time feeding, loafing or swimming on water in winter (Brown & Fredrickson, 2020). Median flight heights have similarly been put at 0–5m in North and Baltic Seas (observation data; Garthe & Hüppop 2004), but the birds reach mean flight heights of 128 m (CI = 101-162m) for daytime flights during spring migration along the Baltic (laser rangefinder data; Kahlert et al. 2012). Velvet Scoters differed from some other species (e.g. Long-tailed Duck) in that flight height was inversely correlated with the distance to the coastline during migration (Kahlert et al. 2012). Weather conditions also had a significant influence on the altitude of flight, with the scoters flying at higher altitudes when migrating on tailwinds, and at lower altitudes in higher wind speeds, perhaps because of higher energy costs or the risk of being blown off course (Kahlert et al. 2012). Further research is needed, however, to confirm the effects of weather conditions and topography on flight heights at different locations and different times of year.
It should be noted that flight height data to date is based almost entirely on daytime records (when species could be determined), whereas waterbirds also migrate at night. Contemporaneous radar studies by Kahlert et al. (2012) found a relatively high mean flight altitude (425m) during nocturnal migration along the Baltic, when the species covered likely included Velvet Scoter.
Whilst survey data suggest birds often fly at low altitudes, data collected during migration suggests birds may fly higher, particularly at night and in areas further offshore. Given this uncertainty, it is recommended that a precautionary approach assuming 100% of flights take place at collision risk height is used for the purposes of collision risk modelling during migration periods.
Flight speeds
Confidence: Low
Mean (± SD) airspeed of 20.1 ± 4.7 m/s (n = 32 tracks) was recorded for flapping flight in Arctic and southern Sweden (Radar data; Alerstam et al. 2007). White-winged Scoters Melanitta deglandi (until recently considered conspecific with M. fusca) were found to have groundspeeds ranging from 13.1 – 29.0 m/s (n = 13) in the Great Lakes during autumn (visual observations of birds moving between two points; Binford & Youngman 2010).
Based on the methodologies underpinning the available data, it is recommended that an airspeed of 20.1 ± 4.7 m/s be used for the purposes of collision risk modelling, with the proviso that flight speed data are very limited.
Avoidance rates and behaviour
Confidence: Very Low
The International Single Species Action Plan (ISSAP) for the species emphasises that cumulative impact assessment of all offshore developments (wind farms and other marine developments) is needed as a matter of some urgency, so that SEAs and EIAs can evaluate effectively the consequences of net loss of wintering and staging habitats through displacement or other effects for the Velvet Scoter population in N/NW Europe, which is in rapid decline (Dagys & Hearn, 2018).
There is currently little or no information on avoidance rates, or measures of barrier effects, for this species. Consequences of displacement from preferred marine feeding grounds (where the scoters forage primarily on bivalve molluscs; also on gastropods, crustaceans, annelids and even fish) are, however, of particular concern (overview in Dagys & Hearn 2018).
Avoidance data are lacking for the Velvet Scoter, but the conspecific Common Scoter M. nigra showed strong avoidance at the OWEZ wind farm; only 2% of individuals flew within the site and a further 12% at the edge. Overall horizontal avoidance (macro- plus micro-avoidance) was put at 0.993 for "sea ducks" (primarily Common Scoter), although the sample sizes were very low (n = 8 observations; Krijgsveld et al. 2011). Data described earlier for Common Eider similarly suggests that macro-avoidance of wind farms by seaducks may be high. Nonetheless, further species-specific studies are required particularly given the low sample sizes, and with avoidance rate estimates remaining speculative for Velvet Scoters.
The analysis of post-construction monitoring data collected for all duck species at onshore wind farm sites suggests that within-windfarm avoidance rates are likely to be in the order of 0.9851 (SD 0.00088) (Table 5).
Common Scoter Melanitta nigra
SPA Species? |
Yes (breeding and non-breeding population) |
|---|---|
SPA site codes (Introduction, Table 2) |
26:33:54:70:78:81:107:123:124:179:192:199:202:203 |
Population size breeding (UK) |
52 pairs (APEP4, 2020); uncertainty: low |
Population size non-breeding (UK) |
135,000 individuals (APEP4, 2020); uncertainty: medium |
Population size non-breeding (Biogeographic flyway, SPA season) |
687,000-815,000 individuals (W Siberia & N Europe/W Europe & NW Africa, non-breeding); uncertainty: medium (Wetlands International, 2021) |
Percentage of biogeographical population at risk of collision in UK waters (passage/breeding/non-breeding) |
c. 18% (passage and non-breeding season); uncertainty: high |
Movement of breeding birds
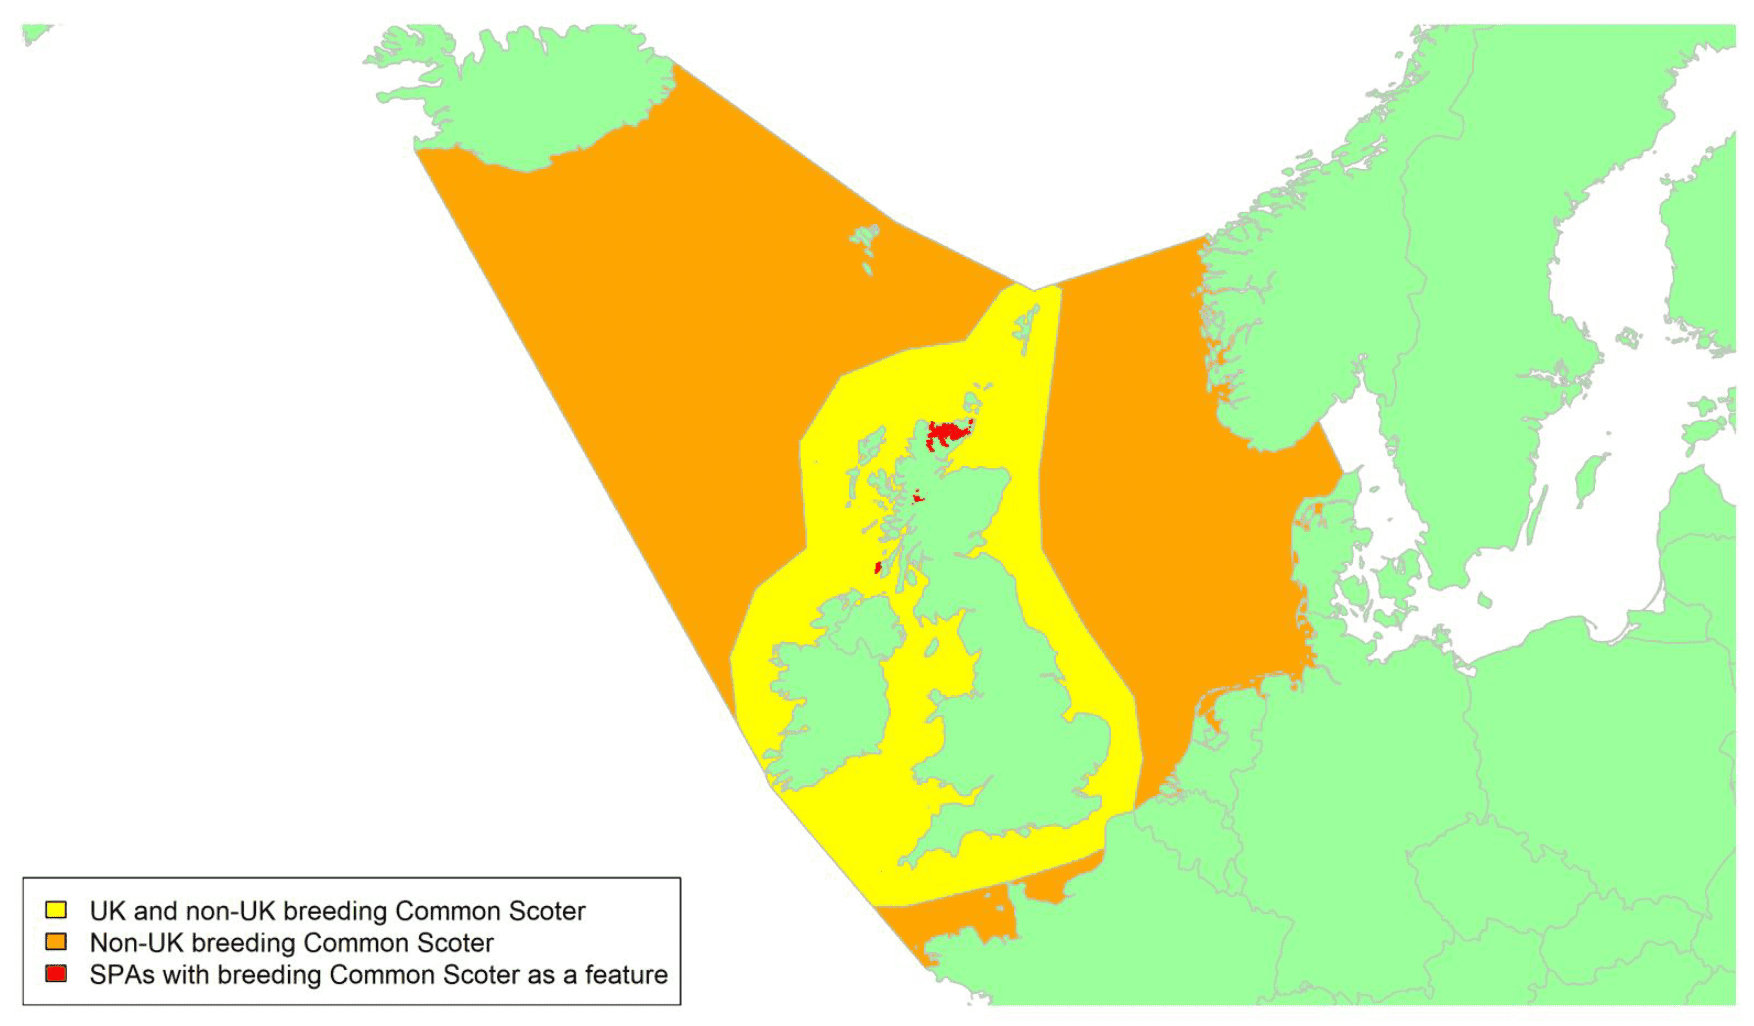
Movement of wintering birds
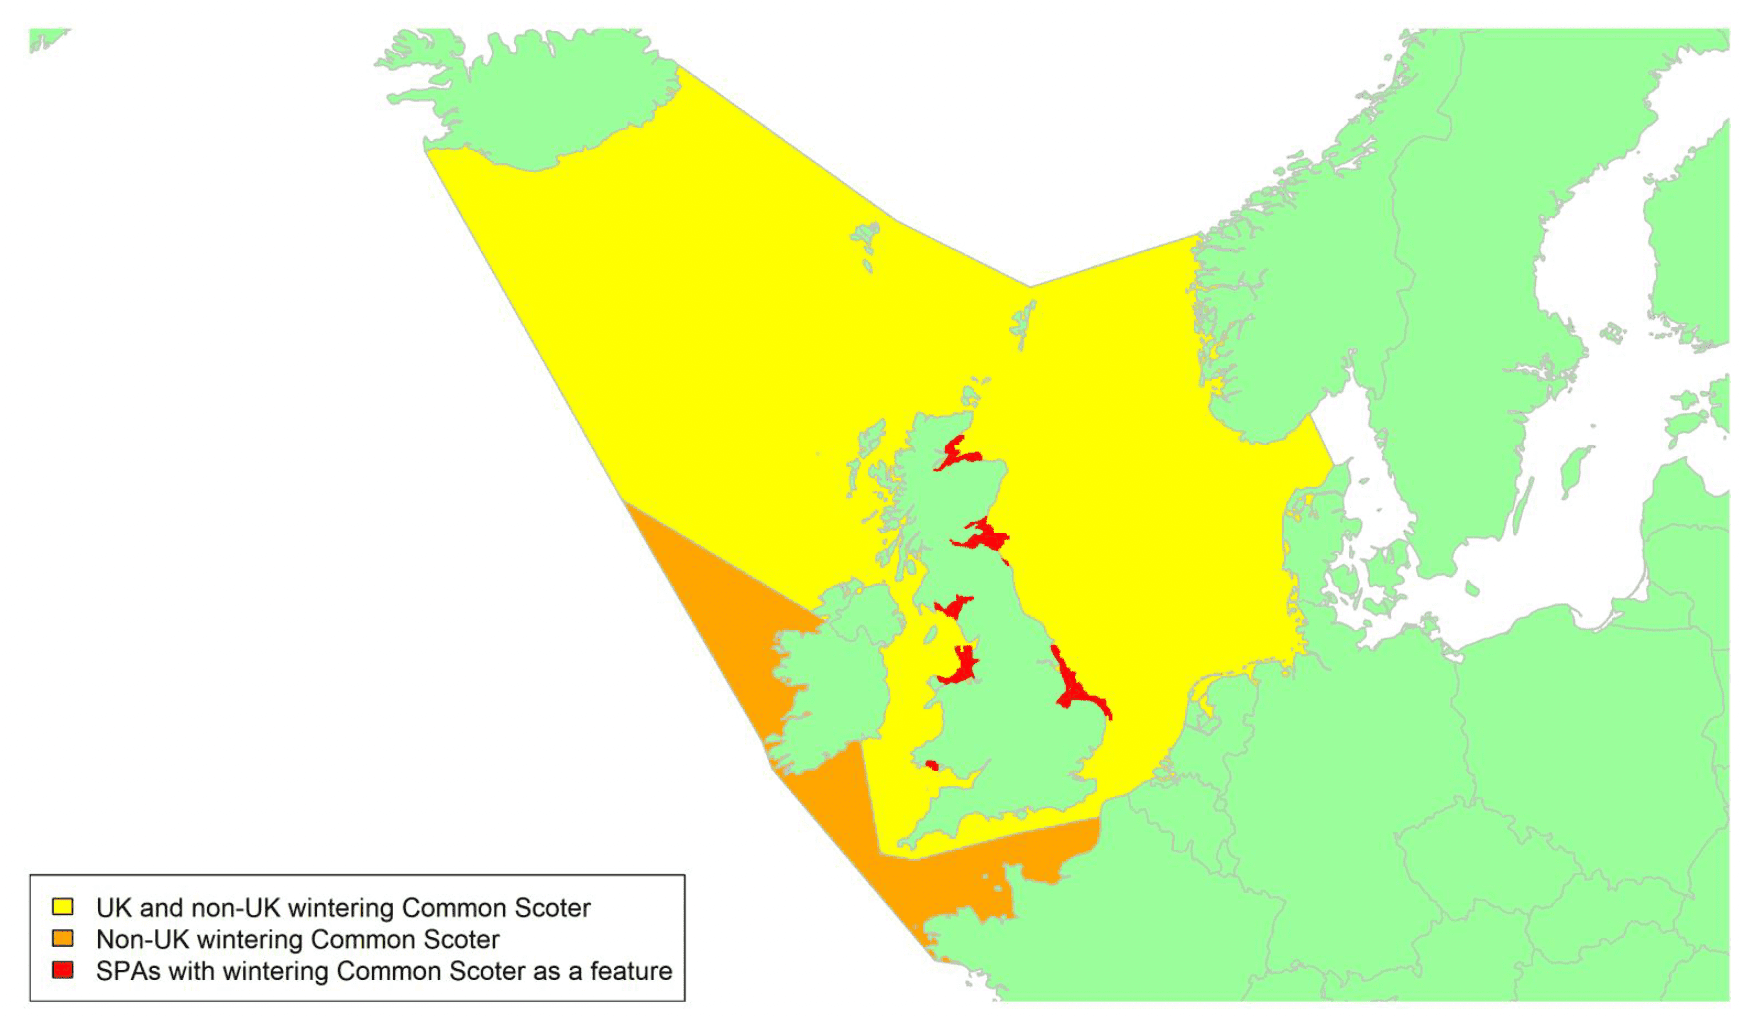
Migratory routes
Confidence: Low
The Common Scoter breeds at high latitudes across northern Eurasia, from Iceland, Ireland, Scotland, northern Scandinavia, and northern Russia to the Lena River in Siberia. Flocks winter from the Baltic Sea and southern North Sea, south along the Atlantic coast to Morocco and occasionally Mauritania. Outside the breeding season, Common Scoter can be found around most of the UK coast, however it is scarce in many areas and large flocks only congregate at a few locations, mainly on the west coast of England and Wales and the east coast of Scotland. Moulting flocks build up during the summer, peaking in July and August, and winter numbers peak in December and January. There are eight SPAs in the UK for wintering Common Scoters. The most important non-breeding area is Liverpool Bay, with five year mean WeBS counts of c. 22,000 from the Dee Estuary, c. 12,000 from the Alt Estuary and c. 6,000 from Colwyn Bay and the North Clwyd coast for the winters from 2015/16 to 2019/20 (Frost et al. 2021). Around 18% of the biogeographic population winter in the UK and are therefore potentially at risk of collision with wind farms in UK waters. However, land-based counts likely underestimate the true number of birds wintering in UK waters, and are thereby prone to interaction with wind turbines. There is probably movement between wintering areas during the non-breeding season. This species is a high priority for further research to improve understanding of the precise timings, locations, and flight heights of movements of this species across the North Sea.
The main movements of Common Scoters across UK waters occur during their bi-annual migrations from their UK wintering grounds to their breeding areas in Iceland, Fennoscandia and northern Russia and moulting areas in the Baltic or the eastern North Sea. Precise migration routes to the UK are not known, but the birds are presumed to cross the sea on a relatively broad front to their main wintering sites, as shown by the yellow area on the wintering map above. Birds from these populations are also known to migrate south-west through the English Channel in autumn after moulting, returning in spring, shown by the orange area on the wintering map (the numbers of such passage birds are not known and hence are not included in the estimate of the proportion of the population at risk in UK waters.
There are three SPAs for breeding Common Scoters in the UK, with the number of breeding pairs likely to be fewer than 60. In order to identify wintering and moulting areas, a small number of adult female Common Scoter have been fitted with geolocators on their nesting grounds in Iceland and in Scotland, but there is very little information about what migratory routes they travel specifically between sites, so a broad corridor must be assumed. These birds mostly join much larger flocks wintering around British and Irish shores, as shown by the yellow area on the breeding map above. However, some fly further south, including to waters offshore of Morocco (WWT data), though this is not shown in the map above as the numbers involved are negligible.
Timing of migration
Confidence: Low
The majority of the UK wintering population migrates to northern Europe, and smaller numbers to Iceland, with peaks in spring migration in April and early May. Movements back to UK offshore waters start as early as the end of June, through to October with a small peak in early July (probably involving birds returning to UK waters to moult), and greater numbers in mid-September (probably involving birds that have moulted in the Baltic) and late October (Trektellen data). Females nesting in Scotland leave the breeding grounds in August and September, males having left from June (WWT data). Mass movements are least likely to occur during the breeding season and from November to late March. BirdTrack data (see Appendix 2) broadly support these timings but show variable patterns of occurrence across different regions, perhaps reflecting the difficulty in using land-based counts to monitor movements of this species.
Migrations tend to commence at night (WWT geolocator data and Pitches, 2020). For example, observations in spring 2020 indicated a protracted departure of wintering flocks from the Irish Sea from dusk until the early hours with birds crossing northern England, before heading east out over the North Sea, with thousands of birds passing Spurn Head from 10:30.
Flight heights
Confidence: Low
Although there have been several studies, these have reported variable flight heights and therefore confidence in the representativeness of the data is low.
Like most sea-ducks, Common Scoters often fly at relatively low heights; heights of 1-5m being regularly recorded at Fife Ness (pers. obs.), although these largely involved movements within Scottish waters. Based on data collected at 18 study sites in Europe, only 1.0% (<0.1-17.0 95% CI) of the modelled proportion of bird flights were within the collision risk window for a turbine with rotor blades a minimum of 20 m above sea-level and a diameter of 130 m (Cook et al. 2012). Median flight heights have been put at 0–5m in North and Baltic Seas (observation data; Garthe & Hüppop 2004). The mean flying height of 'sea-ducks', obtained by vertical radar observations, flying near Meetpost Noordwijk, the Netherlands was 18.5m (Krigsveld et al. 2011). However, the birds reached mean flight heights of 138 m (CI = 115-165m) for daytime flights during spring migration along the Baltic (laser rangefinder data; Kahlert et al. 2012). Contemporaneous radar studies by Kahlert et al. (2012) found a relatively high mean flight altitude (425m) during nocturnal migration along the Baltic, when the species covered likely included Common Scoter.
Weather conditions had a significant influence on the altitude of flight, with the scoters flying at higher altitudes when migrating on tailwinds, and at lower altitudes in higher wind speeds, perhaps because of higher energy costs or the risk of being blown off course (Kahlert et al. 2012). Krüger & Garthe (2001) also showed that this species flew noticeably higher in tailwinds; over 90% of observed birds flying below 1.5m at flight or groundspeeds of 10.3 m/s and above. This behaviour can be explained in terms of economy of effort on migration. Common Scoters off Rügen (Baltic Sea) were recorded migrating usually at altitudes of 1-2 m but in strong tailwinds they reached 10-100 m (Nehls & Zollick, 1990). Further research is needed, however, to confirm the effects of weather conditions and topography on flight heights at different locations and at different times of year. It should be noted that flight height data to date is largely based almost wholly on daytime records (when species could be determined), whereas waterbirds also migrate at night (see above).
Whilst survey data suggest birds often fly at low altitudes, data collected during migration suggests birds may fly higher, particularly at night and in areas further offshore. Given this uncertainty, it is recommended that a precautionary approach assuming 100% of flights take place at collision risk height is used for the purposes of collision risk modelling during migration periods.
Flight speeds
Confidence: Medium
There are relatively few studies of flying speed for this species, although there is some consistency between the values. A mean groundspeed of 23.3 m/s was reported for migrating Common Scoter in May over the Gulf of Finland (radar data; Bergman & Donner, 1964) and a mean groundspeed of 22.1 m/s (± 4.0 SD, n = 14 tracks) was recorded for flapping flight over Arctic and southern Sweden waters (radar data; Alerstam et al. 2007). A mean groundspeed of 20.9 m/s (± 3.0 SD, n = 11 tracks) was recorded across the North Sea (radar data; Christensen et al. 2006). A flock of 18 migrating black scoter (Melanitta americana) was observed flying at c.22.2 m/s in Canada (MacKinnon & Kennedy, 2006).
Given the consistency and sample sizes associated with the studies described above, it is recommended that a speed of 22.1 ± 4.0 m/s is used for the purposes of collision risk modelling.
Avoidance rates and behaviour
Confidence: Low
High levels of macro avoidance rate have been recorded for Common Scoter, with values of 0.886 (Petersen et al. 2006) and 0.90 (Christensen et al. 2004). Similarly, combined observations of Common Scoter and Common Eider recorded macro avoidance rates of 0.862 (at night) and 0.955 (during the day), and meso avoidance of 0.877 (day) and 0.935 (night) (Desholm & Kahlert, 2005). At night, migrating flocks were more prone to enter a wind farm but counteracted the higher risk of collision in the dark by increasing their distance from individual turbines and flying in the corridors between turbines (Desholm & Kahlert, 2005). An observation of a flock of black scoters suggested that nine years after construction, a 13 km bridge was still a partial barrier to bird migration, with only 3 of 18 black scoters (16.7%) crossing over the structure during the observation period (Mackinnon & Kennedy, 2006). The consequences of displacement from preferred marine feeding grounds, where the scoters forage primarily on bivalve molluscs; also on gastropods, crustaceans, annelids and even fish, are also of concern.
These data highlight the likely strong avoidance response of Common Scoter to offshore wind farms. However, the avoidance rates used by collision risk models must account for model error in addition to avoidance behaviour. Reflecting this, analysis of post-construction monitoring data for all duck species at onshore wind farms suggests avoidance rates suitable for collision risk modelling are likely to be in the order of 0.9851 (SD 0.00088) (Table 5).
Long-tailed Duck Clangula hyemalis
SPA Species? |
Yes (non-breeding population) |
|---|---|
SPA site codes (Introduction, Table 2) |
33:123:124:199:201:202 |
Population size breeding (UK) |
0 (APEP4, 2020) |
Population size non-breeding (UK) |
13,500 individuals (APEP4, 2020); uncertainty: medium |
Population size (Biogeographical flyway, SPA season) |
1,600,000 individuals (N Europe/W Siberian population, non-breeding) ; uncertainty : high (Wetlands International, 2021) |
Percentage of biogeographical population at risk of collision in UK (passage/breeding/non-breeding) |
0.8%; uncertainty: high |
Movement of wintering birds
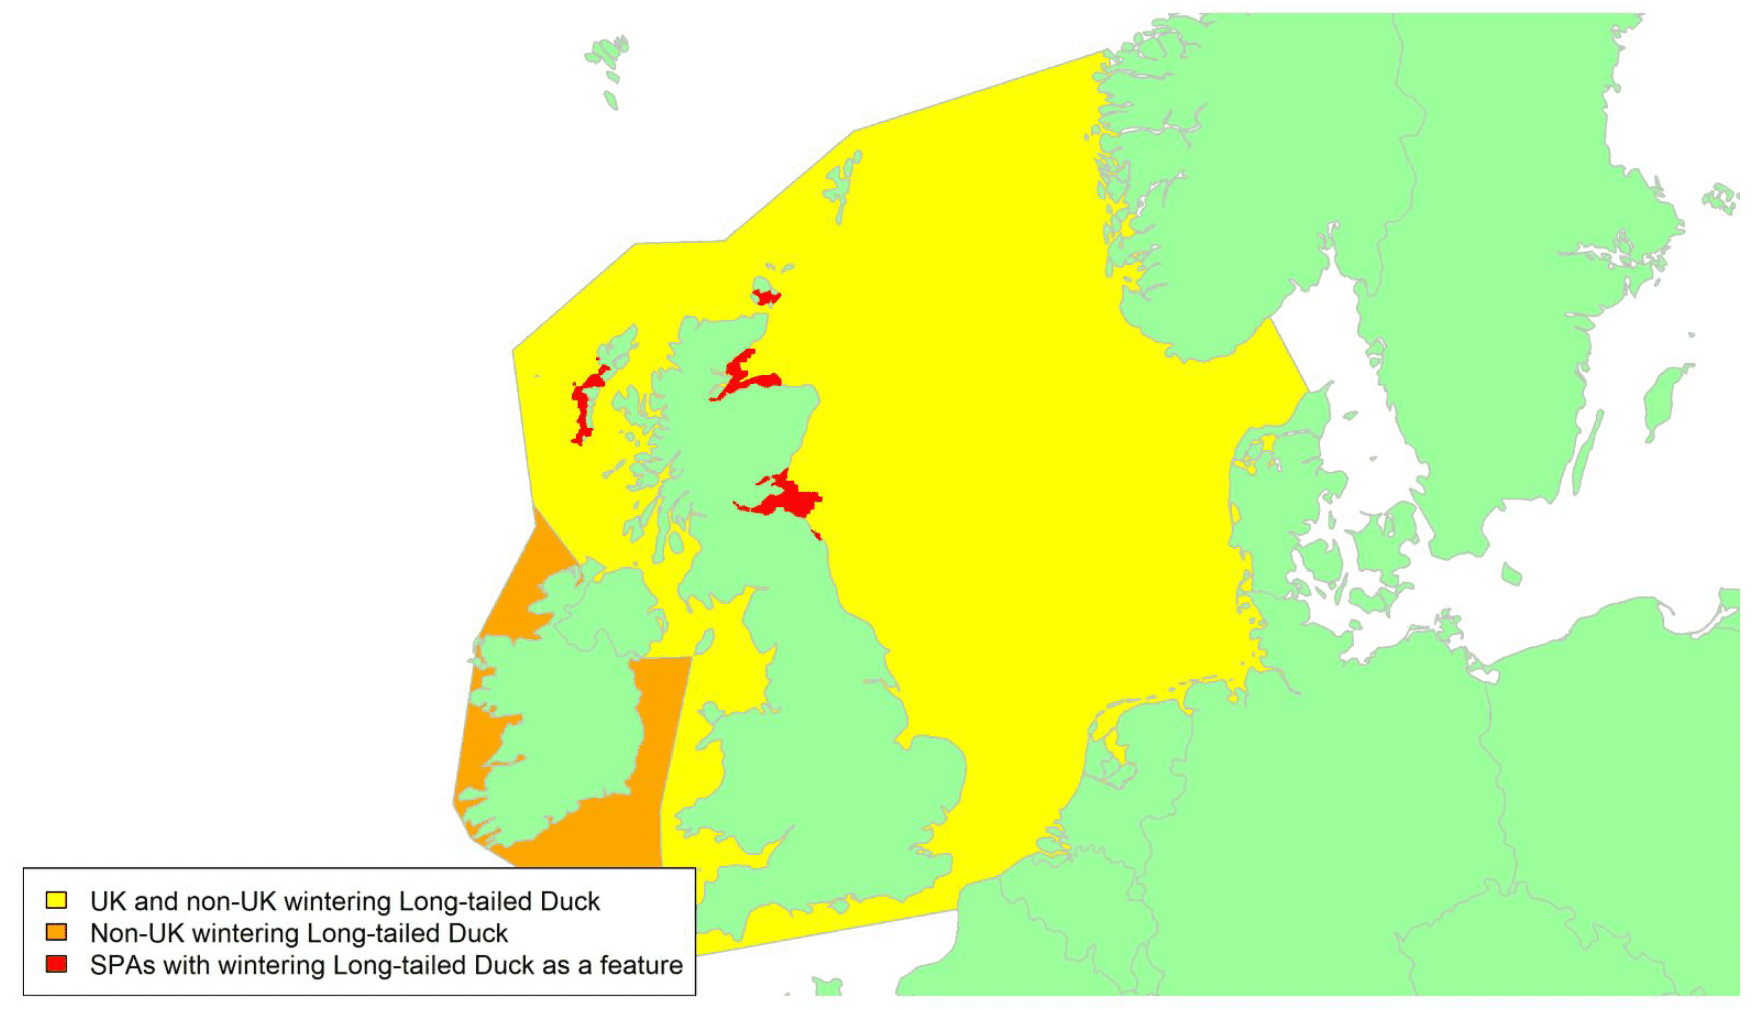
Migratory routes
Confidence: Low
The Long-tailed Duck has a wide distribution across the Arctic and sub-Arctic with birds migrating to winter further south. Very little is known about the origins and migration routes taken by Long-tailed Duck wintering in British and Irish coastal waters, which are currently included within the N Europe/W Siberian population, rather than the smaller Iceland & Greenland breeding population which is estimated at 36,000 – 99,000 birds (Wetlands International, 2021). Existing data suggest that most birds breeding in Greenland and Iceland overwinter around the coasts of those countries so, although there are records of smaller numbers moving south to the Faroe Islands, Britain and Ireland, the British and Irish birds are generally considered to be from Fennoscandia and northwest Russia (Hearn et al. 2015). Longer-distance movements have been recorded for Greenland-breeding birds, however, with some heading southwest to Newfoundland and another southeast to Denmark (Lyngs, 2003). Additionally, Icelandic-breeding Long-tailed Ducks have been observed migrating southwards towards Ireland, western Britain, and the Faroe Islands (where 50-500 overwinter; J-K. Jensen pers. comm. in Hearn et al. 2015) but, in the absence of ring recovery data, the extent of movement from Iceland to the British Isles is far from clear. The numbers of birds reaching the UK are relatively small, and only around 1% of the biogeographic population could potentially be at risk from collision with wind turbines in UK waters.
The vast majority of the West Siberia/North Europe population breeds in western Russia and overwinters in the Baltic Sea, but those breeding in Scandinavia are considered more likely to move west to the North Sea and North Atlantic to winter, including to the coastal waters of Britain and Ireland, and possibly also to around Iceland and Greenland (Hearn et al. 2015). An individual ringed on Fair Isle in October was recovered on being shot in Finland (also in October but 20 years later), apparently on migration to the Baltic (Wernham et al. 2002). Moulting concentrations, mostly of male birds, gather within the species' Arctic breeding range (Hearn et al. 2015).
Although Long-tailed Ducks winter in coastal waters around the British Isles, they have a relatively northerly distribution in Britain. All SPAs for the species, except for Lindisfarne, are in Scotland, where it is a localised, but fairly common winter visitor principally in the Moray Firth, but with concentrations around the coasts of Shetland, Orkney, and smaller numbers in the Firth of Forth (Patterson et al. 2019), with recent surveys suggesting that there could be >4,000 Long-tailed Ducks using inshore waters around Orkney (Upton et al. 2018, Jackson 2018, Patterson et al. 2019). Almost all Long-tailed Duck wintering in the UK will cross the North Sea as shown by the yellow area on the map above, with most birds likely to be crossing the northern part of this area. The species also occurs around the coast of Ireland, where it is difficult to survey and numbers present therefore are not known (Burke et al. 2018), although totals were thought not to exceed 2,000 at the turn of the century (Crowe et al. 2008). Whether these arrive via Britain or direct from Iceland again is not known.
Overall, although ring recovery data are exceedingly limited, there does appear to be some exchange of individuals across the ranges described for two populations (Hearn et al. 2015). The origins and migration routes of birds wintering around the British Isles, and the extent to which these include individuals from Iceland and Greenland, however, remain particularly speculative and the connection with Iceland and Greenland has therefore been excluded from the map as numbers of birds involved are thought to be negligible. Further work to confirm (or refute) this would be valuable.
Timing of migration
Confidence Medium
The Birdtrack data (see Appendix 2) show clear arrival and departure patterns for Long-tailed Duck wintering in Scotland, with a build-up in reports for Scottish coastal waters from the second half of September to late October. Good reporting rates generally are maintained until the spring, although a mid-winter decline for some regions is probably indicative of passage birds passing through or a redistribution to main Scottish wintering sites, e.g., in the Hebrides, Moray Firth, Firth of Forth and the Firth and Tay region. Arrival in England and Wales is a little later, from early October to mid-November, but reporting rates then dip until the end of the year (notably in northeast and Eastern England), again perhaps because migratory birds are passing through.
A steady decline in reporting rates in both Scotland and England from the end of February to mid-May (Appendix 2) illustrates the main departure on spring migration to the breeding grounds. Interesting bimodal peaks in west coast areas for Scotland early in New Year may perhaps be birds moving through from Ireland, although this is highly speculative and reporting rates from Northern Ireland were rather variable. There is a build-up of Long-tailed Duck numbers on Orkney in the first week of May, thought to be birds that have wintered furthers south (in Scottish and English waters) which are gathering there before departure to the breeding grounds (Patterson et al. 2019). Female Long-tailed Duck, recently fitted with geolocators at breeding sites on Kolguev Island in the Russian arctic, were found to winter on the Baltic Sea from mid-October to mid-May (n = 19 individuals) (Karwinkel et al. 2020). This extended wintering period, which nonetheless commences a little later than the initial build-up of Long-tailed Duck reports from Scotland, corresponds with the view that the duck wintering in British and Irish waters may include birds from both the Iceland & Greenland and the N Europe/W Siberian populations.
Flight heights
Confidence: Low
Flight height reports for Long-tailed Duck are very variable. A radar study recorded a mean flight heigh 428 m (n=1 flock) in the Russian arctic (Alerstam & Gudmundsson, 2016), and rangefinder records gave 133m (95% CI = 107–166m; sample size not known) for birds migrating along the Baltic in spring (Kahlert et al. 2012). In contrast, an earlier literature review reported lower flight heights, of 1.9 m (range: 0–10m, n = 144 individuals) for birds at three different sites (at Burbo Bank in Liverpool Bay, St Lawrence Island in Alaska, and Nantucket sound in Massachusetts; Cook et al. 2012), including 4 birds observed flying at 4 m a.s.l. during boat surveys in Nantucket sound during the breeding season (Sadoti et al. 2005).
The study of birds migrating along the Baltic found that flight altitude was associated with wind conditions, with waterbirds (including Barnacle Geese, Long-tailed Duck, Common Scoter and Velvet Scoter) flying higher in tailwinds and at lower levels in headwinds, possibly because of enhanced energetic costs or an increased risk of being blown off course (Kahlert et al. 2012). Flight heights were also higher at night than during the day (Kahlert et al. 2012), although it should be noted that different methods were used to record nocturnal and daytime data. The result did however support an earlier report by Jacoby (1983) who found that flight heights for Common Scoter and Long-tailed Duck migrating along the Baltic increased during evening and peaked a few hours after sunset.
Given the variability in the altitude data recorded for Long-tailed Duck, the importance of other variables in influencing the altitude of flight and noting that the species is of conservation concern (Hearn et al. 2015), it is recommended that 100% of birds are assumed to be at collision risk height in collision risk models.
Flight speeds
Confidence: Low
Radar tracks gave mean flight speeds of 22 ± 1.4 m (n = 3) for Long-tailed Duck in northwest Europe (Arctic/S Sweden; Alerstam et al. 2007), and mean speeds of 19.7 ± 1.7 m (n = 13 runs) were recorded by theodolite for birds flying over the Baltic in autumn (Pennycuick et al. 2013).
Given the relative sample sizes of these studies, it is recommended that a speed of 19.7 ± 1.7 m/s from Pennycuick et al. (2013) be used for the purposes of collision risk modelling, with the proviso that flight speed data are very limited for this species.
Avoidance rates and behaviour
Confidence: Very low
Avoidance rate data were not found for this species. Krijgsveld et al. (2011) found that only 3% of seaducks (predominantly Common Scoter) flying in the vicinity of the OWEZ wind farm were recorded within the wind farm and 17% at the edge, giving an overall horizontal avoidance rate of 0.993. They also noted, however, that the numbers of seaducks in the area was low.
The analysis of post-construction monitoring data collected for all duck species at onshore wind farm sites suggests that within-windfarm avoidance rates are likely to be in the order of 0.9851 (SD 0.00088) (Table 5).
Goldeneye Bucephala clangula
SPA Species? |
Yes (non-breeding population) |
|---|---|
SPA site codes (Introduction, Table 2) |
1:30:55:63:70:78:89:123:124:135:149:155:156: 199:202 |
Population size breeding (UK) |
200 pairs (APEP4, 2020); uncertainty: medium |
Population size non-breeding (UK) |
21,000 individuals (APEP4, 2020); uncertainty: medium |
Population size (Biogeographic flyway, SPA season) |
750,000–1,500,000 individuals (NW & Central Europe, non-breeding) ; uncertainty : high (Wetlands International, 2021) |
Percentage of biogeographic population at risk of collision in UK waters (passage / breeding / non-breeding) |
2% (non-breeding, including c. 1,250 wintering in the Republic of Ireland; Burke et al. 2018); uncertainty: high |
Movement of wintering birds
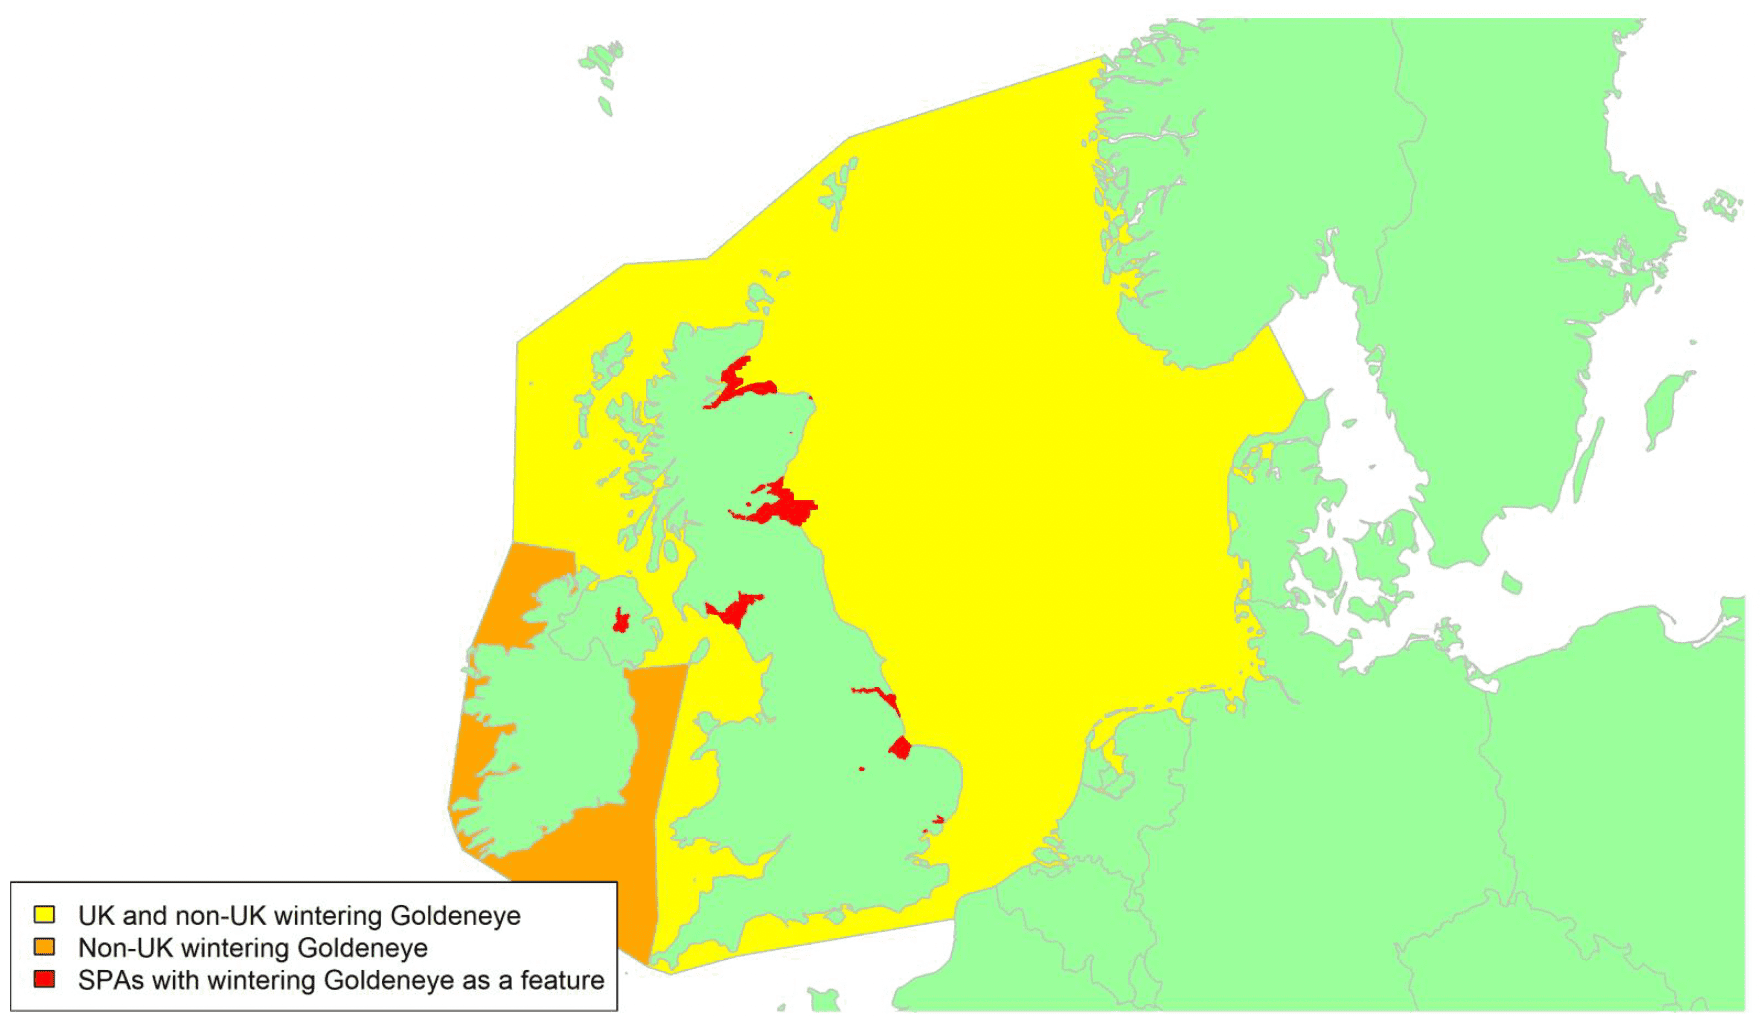
Migratory routes
Confidence: Medium
The Goldeneye is found across the northern hemisphere. It has been a regular breeding species in the Highlands of Scotland since 1970, but numbers across Britain and Ireland increase markedly in winter with the arrival of birds from Fennoscandia and northern Russia (Wernham et al. 2002), crossing the North Sea to reach Britain as shown by the yellow shaded area on the map above. In general, Goldeneye is considered to be a broad-front migrant in most of its range, though major rivers, lake chains and coastlines provide a focus for movements (Eadie et al. 2020). Lough Neagh in Northern Ireland is one of the most important wintering sites for the species in the UK, and still receives c. 1,300–1,400 Goldeneye despite a rapid decline in numbers nationally (which have triggered WeBS alerts) in recent years (Frost et al. 2021) and led to the species being red-listed as a bird of conservation concern (Stanbury et al. 2021). Most of these will have arrived from Fennoscandia via Scotland or northern England to reach Ireland. Some 1,250 wintering in the Republic of Ireland (Burke et al. 2018) are also thought to migrate through UK coastal waters; their precise routes are not known, but ring recovery data (Campbell 2002) suggests that these birds also originate from Fennoscandia and Russia so will migrate via the North and Irish Seas and will pass through both the yellow and orange areas on the map. Britain and Ireland are at the westernmost end of the species' wintering range and hence relatively few birds reach this far west, with only around 2% of the biogeographic population being potentially at risk of collision with wind turbines in UK waters.
Timing of migration
Confidence: Medium
In autumn, migration commences late August and lasts until December, with peak passage observed in Baltic and North Seas in November and adult males generally moving shorter distances than other ages and adult females (except perhaps in response to severe winter weather; Jakubas, 2003). Autumn migration of Goldeneye into Scotland occurs from mid-October to mid-November (BirdTrack data, see Appendix 2), but with reporting rates increasing into mid-winter in northeast Scotland and on Orkney. Increased reporting rates in England throughout October and in Wales from mid to late October indicates that autumn migrants are arriving in different parts of Britain at much the same time. Onward movement to Northern Ireland is more prolonged, from mid-October to early December.
Spring movements from Northern Ireland commence as early as the end of January and continue until the end of April. Elsewhere the main departure period for large parts of Britain appears to be from mid-February (all-Scotland, all-England and Wales) until early mid-May, although the decline in reporting rates commences slightly earlier (from early to mid-February) in southern England, the north coast of Scotland, Orkney, and Shetland. Arrivals in Lapland and western Siberia are generally by late April/early May (Snow & Perrins, 1998).
Flight heights
Confidence: Low
Little information on flight heights have been reported, but generally flies close to water (c. 1m) during short flights but a greater height when flying overland or for long distances (Eadie et al. 2020).
Given the lack of altitude data, it is recommended that 100% of birds are assumed to be at collision risk height in collision risk models.
Flight speeds
Confidence: Low
In general, Goldeneye are considered to have relatively fast flight, estimated at 20 m/s (72 km/h) in Scandinavia, with rapid wingbeats of 9 beats/s (Eadie et al. 2020; Palmer, 1976). Radar studies recorded airspeeds of 20.3 ± 3.8 m/s (n = 10 tracks) for birds in flapping flight in northwest Europe (Alerstam et al. 2007).
The few tracking studies undertaken to date have been mostly to assess the movements of the closely related Barrow's Goldeneye Bucephala islandica in North America. One study found that an individual B. islandica bird covered 365 km in 4h 23 min at night, giving an overall nocturnal flight speed of 23 m/s (83 km/h) (Robert et al. 2002).
Reflecting direct measurements of the species flight speed using radar, it is recommended that a flight speed of 20.3 ± 3.8 m/s be used for the purposes of collision risk modelling, noting that it is based on a limited sample size and reflects air, rather than ground, speed.
Avoidance rates and behaviour
Confidence: Very Low
There were no reports on avoidance rates specific to Goldeneye found during the literature search. The analysis of post-construction monitoring data collected for all duck species at onshore wind farm sites suggests that within-windfarm avoidance rates are likely to be in the order of 0.9851 (SD 0.00088) (Table 5).
Goosander Mergus merganser
SPA Species? |
Yes (non-breeding population) |
|---|---|
SPA site codes (Introduction, Table 2) |
55:78:124:135:155 |
Population size breeding (UK) |
4,800 (4,250–5,250) pairs (APEP4, 2020); uncertainty: medium |
Population size non-breeding (UK) |
14,500 individuals (APEP4, 2020); uncertainty: medium |
Population size (Biogeographical flyway, SPA season) |
170,000–260,000 individuals (NW & Central Europe, non-breeding) (Wetlands International, 2021); uncertainty: high |
Percentage of biogeographical population at risk of collision in UK waters (passage/breeding/non-breeding) |
4.5%-6.7%; uncertainty: high |
Movement of wintering birds
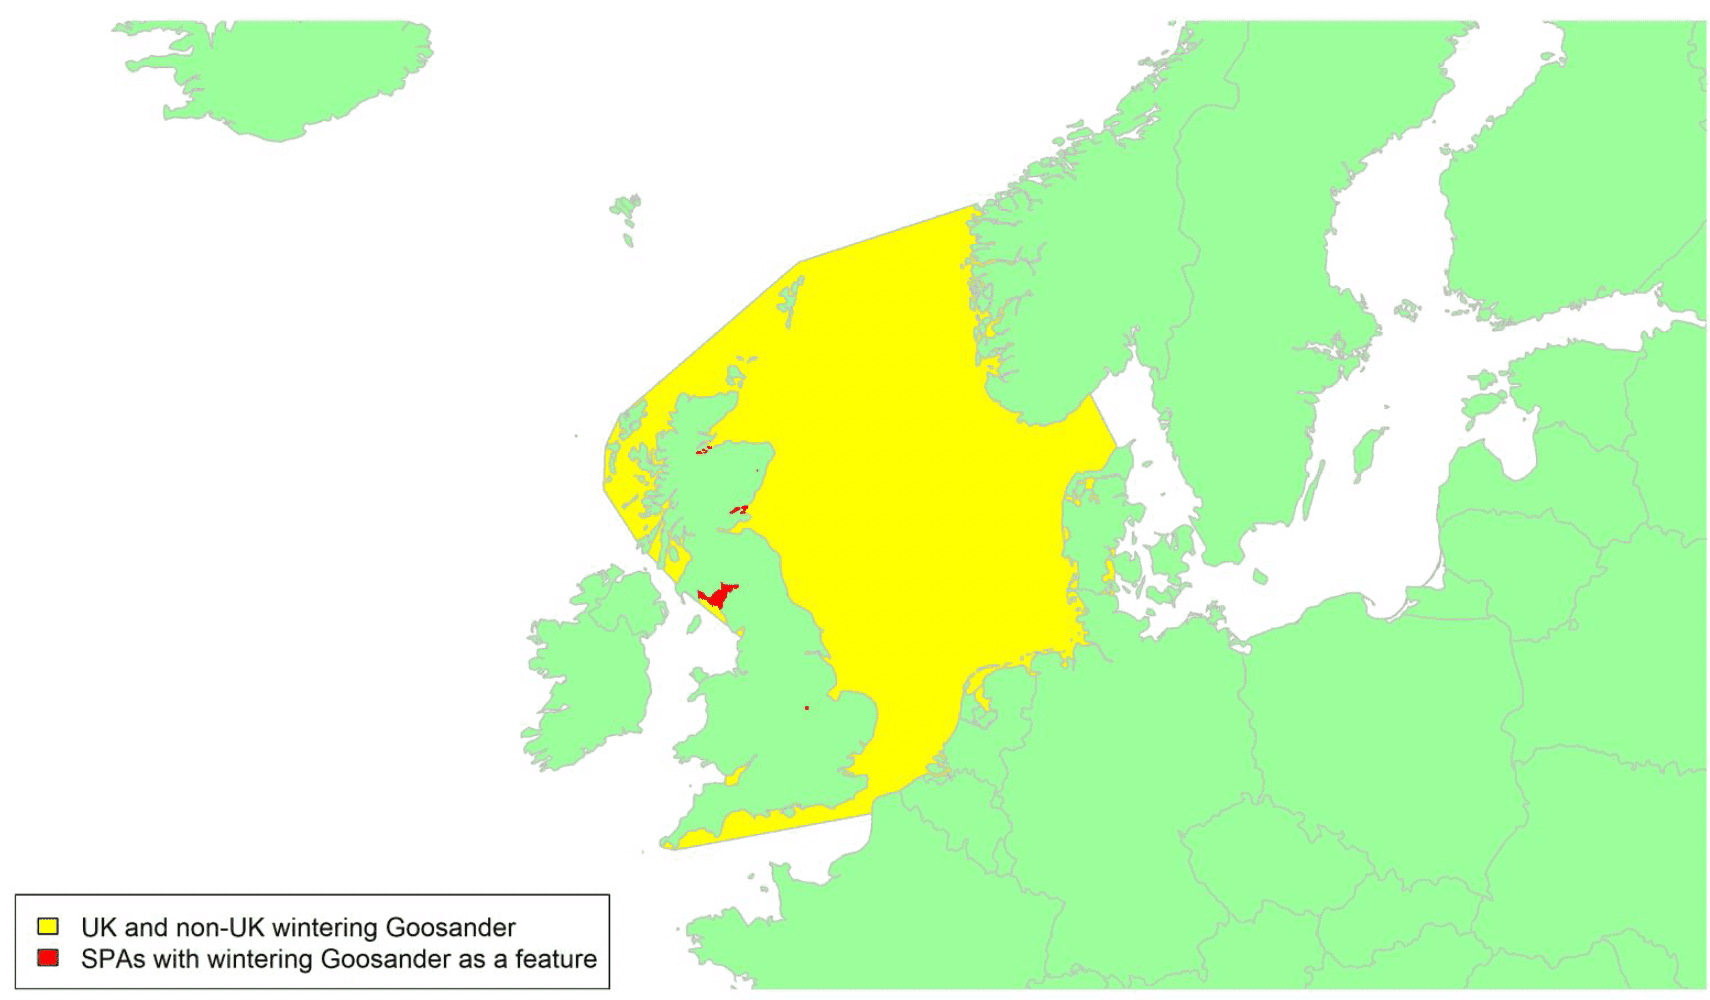
Migratory routes
Confidence: Low
Goosanders breed across the northern hemisphere with most (but not all) populations being migratory. They occur throughout Britain but are rare winter visitors to Ireland, where the handful of breeding birds are thought to be resident. The British-wintering population consists of those breeding in the country and birds migrating from mainland Europe, particularly during cold weather periods. Arrivals are mainly from northern Fennoscandia and western Russia, and ring recoveries indicate that most Goosanders (of both sexes) wintering in lowland England are winter visitors from the continent (Wernham et al. 2002). Moult migration also occurs; males in particular crossing the North Sea to moulting areas in Norway (e.g. Tana Fjord; Little & Furness, 1985), whereas British-breeding females and juveniles are thought to remain in Britain throughout the year (Wernham et al. 2002; Wright et al. 2012; Mitchell et al. 2008). There is no information about migration routes and hence a broad front migration across the North Sea should be assumed, as shown by the yellow shaded area on the map. Around 5% to 7% of the biogeographic population could potentially be at risk of collision with wind turbines in UK waters, depending on the whether or not a proportion of the females breeding in the UK do migrate overseas.
Timing of migration
Confidence: Low
With Goosanders being native to the UK, passage patterns are not as well defined as for some other species, particularly in its main breeding areas of Scotland and northern England. Major moult migration by drakes to northern Norway, where they occur from June to September (Little & Marchant 2002; Wright et al. 2012) is not well captured by the BirdTrack data (see Appendix 2), although an increase in reporting rates along the Scottish coast from mid-June to late August may well include longer distance moult migrants crossing the North Sea as well as those moulting in the UK. Autumn sightings, which were higher on Orkney from early October to early November and at the Solway from early October to early November, may reflect a return and southward movement of Goosanders through Scotland at this time, extending to England where reporting rates likewise increased from the last week of September to late November. Reporting rates decrease during spring, from early March to mid-May in England, mid-March to early June in Wales and from early March to the end of May along the Scottish coast.
Flight heights
Confidence: Low.
Flight height data were not found for this species. In the absence of data for this species, a precautionary assumption of 100% of flights at collision risk height is recommended.
Flight speeds
Confidence: Low
There are very few data on flight speeds for this species, but one track recorded by radar gives a mean flight speed of 21.2 m/s (Bruderer & Boldt 2001), and two others recorded mean flapping flight at 19.7 m/s ± 1.1 (Alerstam et al. 2007). Based on the available data, it is recommended that a speed of 19.7 m/s ± 1.1 be used for the purposes of collision risk modelling.
Avoidance rates and behaviour
Confidence: Very Low
Avoidance rate data were not found for this species. For "other ducks" (including Scaup, Red-breasted Merganser and Northern Pintail, but not Goosander), 71% were found to fly through the OWEZ wind farm and 56% deflected their flight by Krijgsveld et al. (2011), who put overall horizontal avoidance at 0.983 (i.e., for micro- and macro-avoidance combined) for the "other ducks" group. The analysis of post-construction monitoring data collected for all duck species at onshore wind farm sites suggests that within-windfarm avoidance rates are likely to be in the order of 0.9851 (SD 0.00088) (Table 5).
Red-breasted Merganser Mergus serrator
SPA Species? |
Yes (non-breeding population) |
|---|---|
SPA site codes (Introduction, Table 2) |
15:33:53:114:123:124:135:166:199:200:201:202:210 |
Population size breeding (UK) |
1,650 pairs (APEP4, 2020); uncertainty: high |
Population size non-breeding (UK) |
11,000 individuals (APEP4, 2020); uncertainty: medium |
Population size (Biogeographical flyway, SPA season) |
100,000–160,000 individuals (NW & Central European population, non-breeding) (Wetlands International, 2021); uncertainty: high |
Percentage of biogeographical population at risk of collision in UK waters (passage/breeding/non-breeding) |
9.9% (Assuming that c. 1,900 wintering in Rep. of Ireland all passage through UK); uncertainty: high |
Movement of wintering birds
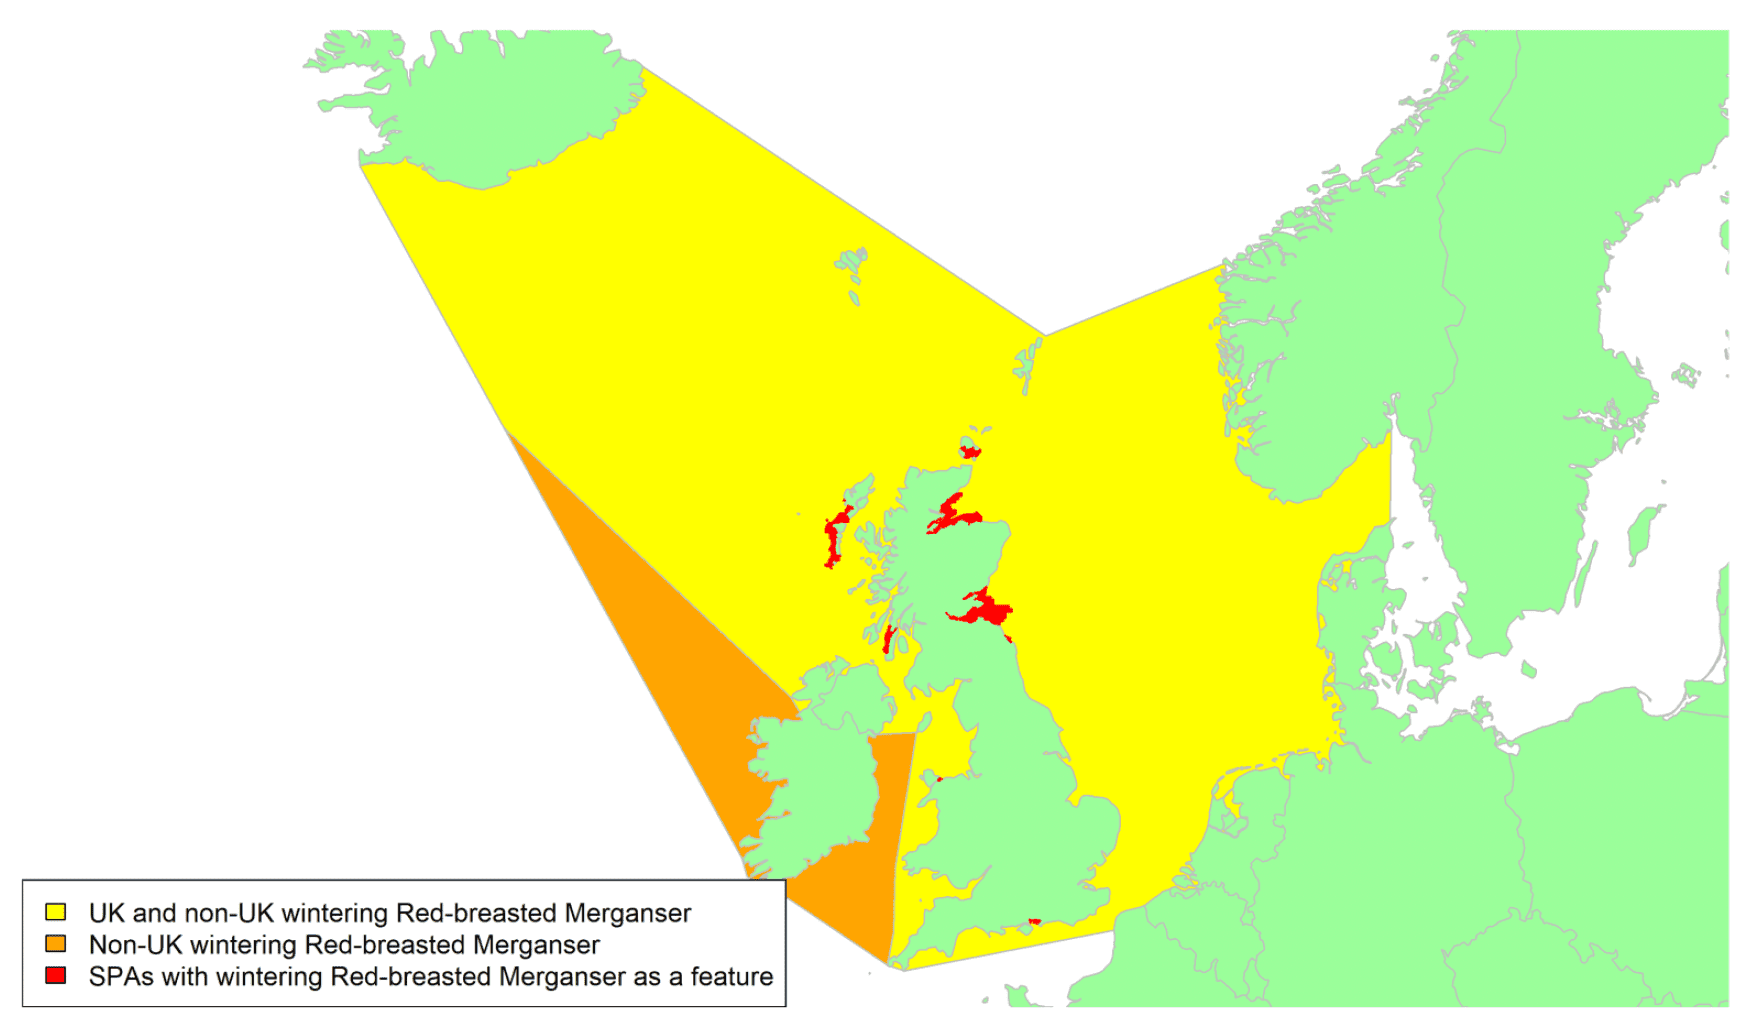
Migratory routes
Confidence: Low
The range of Red-breasted Mergansers extends across the northern hemisphere. The extent of movements undertaken by Red-breasted Mergansers breeding in northwest and central Europe appears to be somewhat variable. Birds breeding in eastern Europe are highly migratory and winter primarily in northwest Europe, especially on the Baltic Sea. Ring recoveries show that smaller numbers move to the north Mediterranean and east Atlantic coasts, which suggest that they are also capable of migrating to Britain and Ireland, although this has yet to be confirmed (Robinson, 1999). Those breeding further west, in northwest mainland Europe, are considered to be relatively sedentary but join eastern breeders on the Baltic in winter. In mild conditions an estimated c. 44% of the northwest and central European population winters in the western parts of the Baltic Sea (Pihl et al. 1995); higher numbers counted in Britain during the cold 1978/79 winter were likely from the continent, although again this could not be confirmed (Chandler, 1981). The c. 1,900 wintering in the Republic of Ireland (Burke et al. 2018) probably migrate from Iceland through Northern Ireland to their wintering grounds, although some may fly direct to Co. Donegal and counties further south.
Despite a general lack of ringing and recovery data, movement between the continent and Britain is known to occur, with three British-ringed individuals recovered in Norway, Denmark, and the Netherlands, respectively (Wernham et al. 2002). Additionally, most of the Icelandic-breeding population is thought to migrate to winter along the coasts of Scotland, northern England and Ireland (Scott & Rose, 1996), although whether they undertake direct flights from Iceland to Northern Ireland has yet to be determined. Small numbers from east Greenland may also reach Britain and Ireland via Iceland (Robinson, 1999, Wernham et al. 2002). Those breeding in Britain and Ireland are considered to be relatively sedentary but move from inland breeding locations to coastal areas to moult and overwinter, particularly in shallow protected estuaries and bays, and offshore.
In the absence of more precise information about how many birds from the east and northeast winter in the UK, a broad front migration should be assumed. Red-breasted Mergansers cross UK waters from both from Iceland and across the North Sea, as shown by the yellow shading on the map above, and some birds continue to the Republic of Ireland (shown by the orange shading). Around 10% of the biogeographic population could potentially be at risk of collision with wind turbines in UK waters, including passage birds en route to Ireland.
Timing of migration
Confidence: Low
Moult migration by males and immatures from inland waters to coastal sites occurs during June and July, and numbers at Scottish sites peak in August, notably in the Sound of Gigha on the west coast and off Tentsmuir in the east, with individuals tagged by the Northumbrian Ringing Group also moulting at Lindisfarne in northeast England (Toms, 2002). Migration from Iceland and Fennoscandia starts later, and peak numbers are recorded in mid-winter. The variation in BirdTrack reporting rates (see Appendix 2) therefore reflects a rolling turnover of resident birds with those migrating to winter in the UK, but numbers on the Scottish coast (including Orkney and the Highlands) from August to mid-November likely include increasing numbers of migratory birds. Whether mid-winter pulses in the BirdTrack reports (e.g., on the north coast of Scotland, Orkney, and Shetland) are indicative of local movement, an arrival of birds from Iceland, or an anomaly in the data is difficult to assess. Main autumn movement to England was slightly later, from early September to late November. Spring migration appears to be from late February to mid-May in England, and there was a similar decrease in reporting rates for southern Scotland (e.g., the Solway) from mid-February to mid-May. Again, there is a rolling pattern of movement recorded in Northern Ireland, presumably as birds move north from the Republic of Ireland to breed or continue to Iceland.
Flight heights
Confidence: Low.
Flight height data were not found for this species. In the absence of data for this species, a precautionary assumption of 100% of flights at collision risk height is recommended
Flight speeds
Certainty: Low
Mean flight speeds of 22 m/s ± 2.9 (n = 33 tracks) were recorded for birds studied using radar in Arctic and southern Sweden (Alerstam et al. 2007), and airspeeds of 22 m/s ± 1.69 (n = 34 theodolite runs) were also measured for birds on autumn migration in the Baltic (Pennycuick et al. 2013).Based on the available data, it is recommended that a speed of 22.0 m/s ± 2.9 be used for the purposes of collision risk modelling.
Avoidance rates and behaviour
Confidence: Very Low
Avoidance rate data were not found for this species. However, 71% of "other ducks" (i.e., excluding sea ducks, but including Scaup, Red-breasted Merganser and Northern Pintail) were found to fly through the OWEZ wind farm, with 56% showing deflection (Krijgsveld et al. ,2011). This study estimated overall horizontal avoidance at 0.983 (i.e., for micro- and macro-avoidance combined) for this "other ducks" group.The analysis of post-construction monitoring data collected for all duck species at onshore wind farm sites suggests that within-windfarm avoidance rates are likely to be in the order of 0.9851 (SD 0.00088) (Table 5).
Nightjar Caprimulgus europaeus
SPA Species? |
Yes (breeding population) |
|---|---|
SPA site codes (Introduction, Table 2) |
4:10:20:22:40:43:57:66:71:72:75 |
Population size breeding (UK) |
4,600 males (3,700 – 5,500; APEP4, 2020); uncertainty: low |
Population size non-breeding (UK) |
- |
Population size (Biogeographical flyway, SPA season) |
614,000 – 1,100,000 males (Europe, breeding; BirdLife International, 2021); uncertainty: high |
Percentage of biogeographical population at risk of collision in UK waters (passage/breeding/non-breeding) |
0.4%–0.7% (minimum) (breeding population) uncertainty: high |
Movement of breeding birds
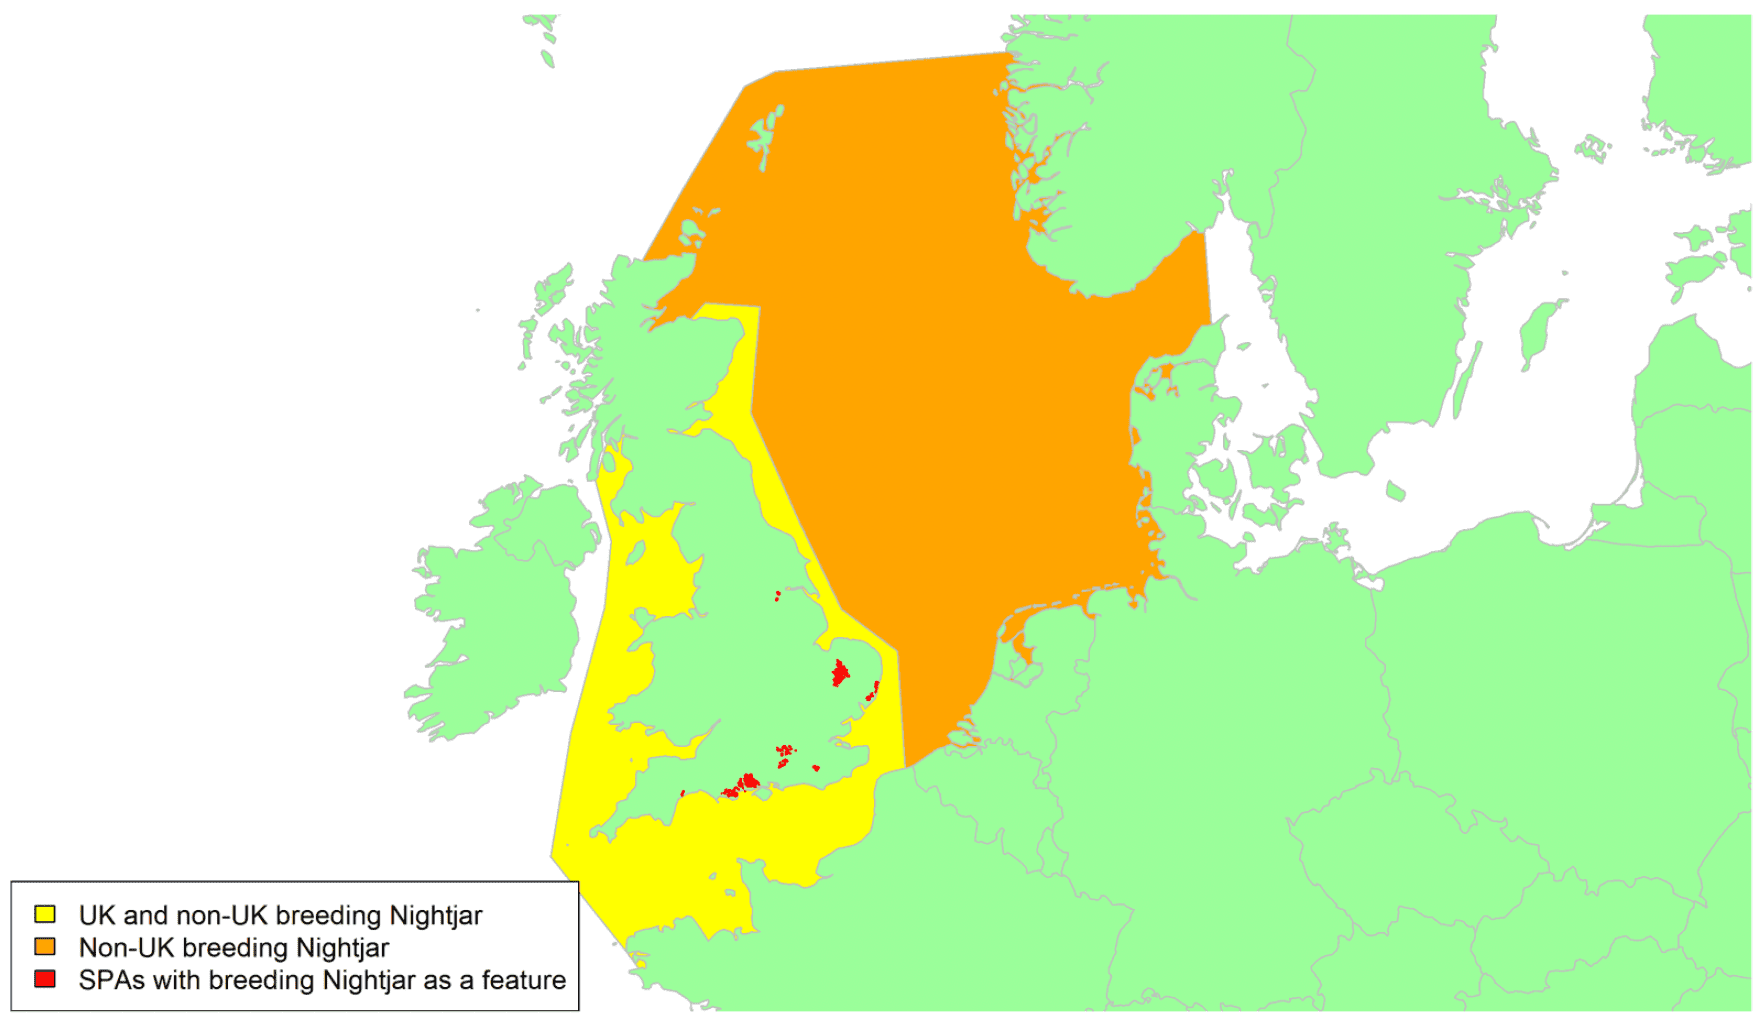
Migratory routes
Confidence: High
Nightjars have a wide breeding distribution throughout the Palearctic. The speciesoccurs throughout northern Europe across to Mongolia, with the highest abundances within Europe found in France, Belarus and the Baltic states (V. Keller et al. 2020). A very small proportion of the overall population breeds in Britain and Ireland, and of these the bulk are found in East Anglia and southern England and Wales, with small numbers also breeding in southern Scotland (Balmer et al. 2013).
All C. e. europaeus migrate south to sub-equatorial Africa to winter. Of fifteen birds tagged across three studies in England, France and Belgium, all wintered in the Democratic Republic of Congo in central Africa, following a loop migration pattern through central northern Africa in autumn and returning via west Africa (Cresswell & Edwards, 2012; Evens et al. 2018, 2017). Twelve birds tagged in Sweden wintered across a large region of southern tropical Africa, but did not follow a loop pattern (Norevik et al. 2017). Movements have been recorded between England and France, Spain, and northern Africa, as well as one movement to the Netherlands.
All Nightjars breeding in Britain will probably cross the Channel en route to wintering grounds in Africa, with some possible movements across the Irish Sea and coastal waters around the UK, as indicated by the yellow shading on the above map. Some birds breeding in Fennoscandia could pass through Britain on passage and cross the North Sea, as indicated by the orange shading, although none of the birds tracked from Sweden followed this route (Norevik et al. 2017). However, the Swedish study took place in the far south of the country and hence it remains uncertain whether birds breeding further north in Scandinavia could follow a more westerly migration route via the UK. In the absence of any information to the contrary, it is assumed that relatively few Fennoscandian birds cross the North Sea and that those birds which could potentially be at risk of collision with wind turbines in UK waters are predominantly British breeders. The British breeding population comprises less than 1% of the total biogeographic population.
Timing of migration
Confidence: High
Nightjars leave their breeding grounds from late July onwards, and most autumn migrants occur in August and September in Scotland (Forrester et al. 2007). Birds then leave wintering grounds from March onwards and arrive back at breeding grounds in Britain in late April and in Scotland from early May (Wernham et al. 2002). Eleven birds tracked from England, Belgium and northern France departed in autumn between 24th August and 11th September and arrived back on their breeding grounds from early May (Evens et al. 2017). Peak movements in the UK in spring can be inferred from increasing BirdTrack reporting rates between early-May and early June in most southern regions and between mid-May and early June further north. Peak movements in autumn can be inferred by decreasing reporting rates between early July and mid-August.
Nightjars migrate at night (Wernham et al. 2002). A minimum of 89% of travel of a migratory Nightjar species in North America occurred in darkness (Korpach et al. 2019).
Flight heights
Confidence: Low.
There are no reported flight heights for this species. In the absence of data for this species, a precautionary assumption of 100% of flights at collision risk height is recommended.
Flight speeds
Confidence: Low
A study of breeding nightjar in Belgium using GPS distance/time calculations gave a flight speed estimate of 9.72 +- 3.33 m/s over unsuitable habitat (Evens et al 2021). In the absence of data relating specifically to flight speed during migration or over water, it is recommended that this value be used in relation to collision risk modelling.
Avoidance rates and behaviour
Confidence: Very Low
No avoidance rates have been reported for this species. In the absence of a suitable species-specific avoidance rate or, one for a related group, it is recommended that an all-species avoidance rate of 0.9954 (± 0.00002) is used for collision risk modelling (Table 5).
Corncrake Crex crex
SPA Species? |
Yes (breeding population) |
|---|---|
SPA site codes (Introduction, Table 2) |
97:112:120:137:169:172:174:179:187:190 |
Population size breeding (UK) |
1,100 males (APEP4, 2020); uncertainty: low |
Population size non-breeding (UK) |
0 |
Population size (Biogeographical flyway, SPA season) |
1,290,000 - 2,120,000 calling males (Europe, breeding; BirdLife International, 2015); uncertainty: high |
Percentage of biogeographical population at risk of collision in UK waters (passage/breeding/non-breeding) |
0.05% - >0.08% breeding; uncertainty: high |
Movement of breeding birds
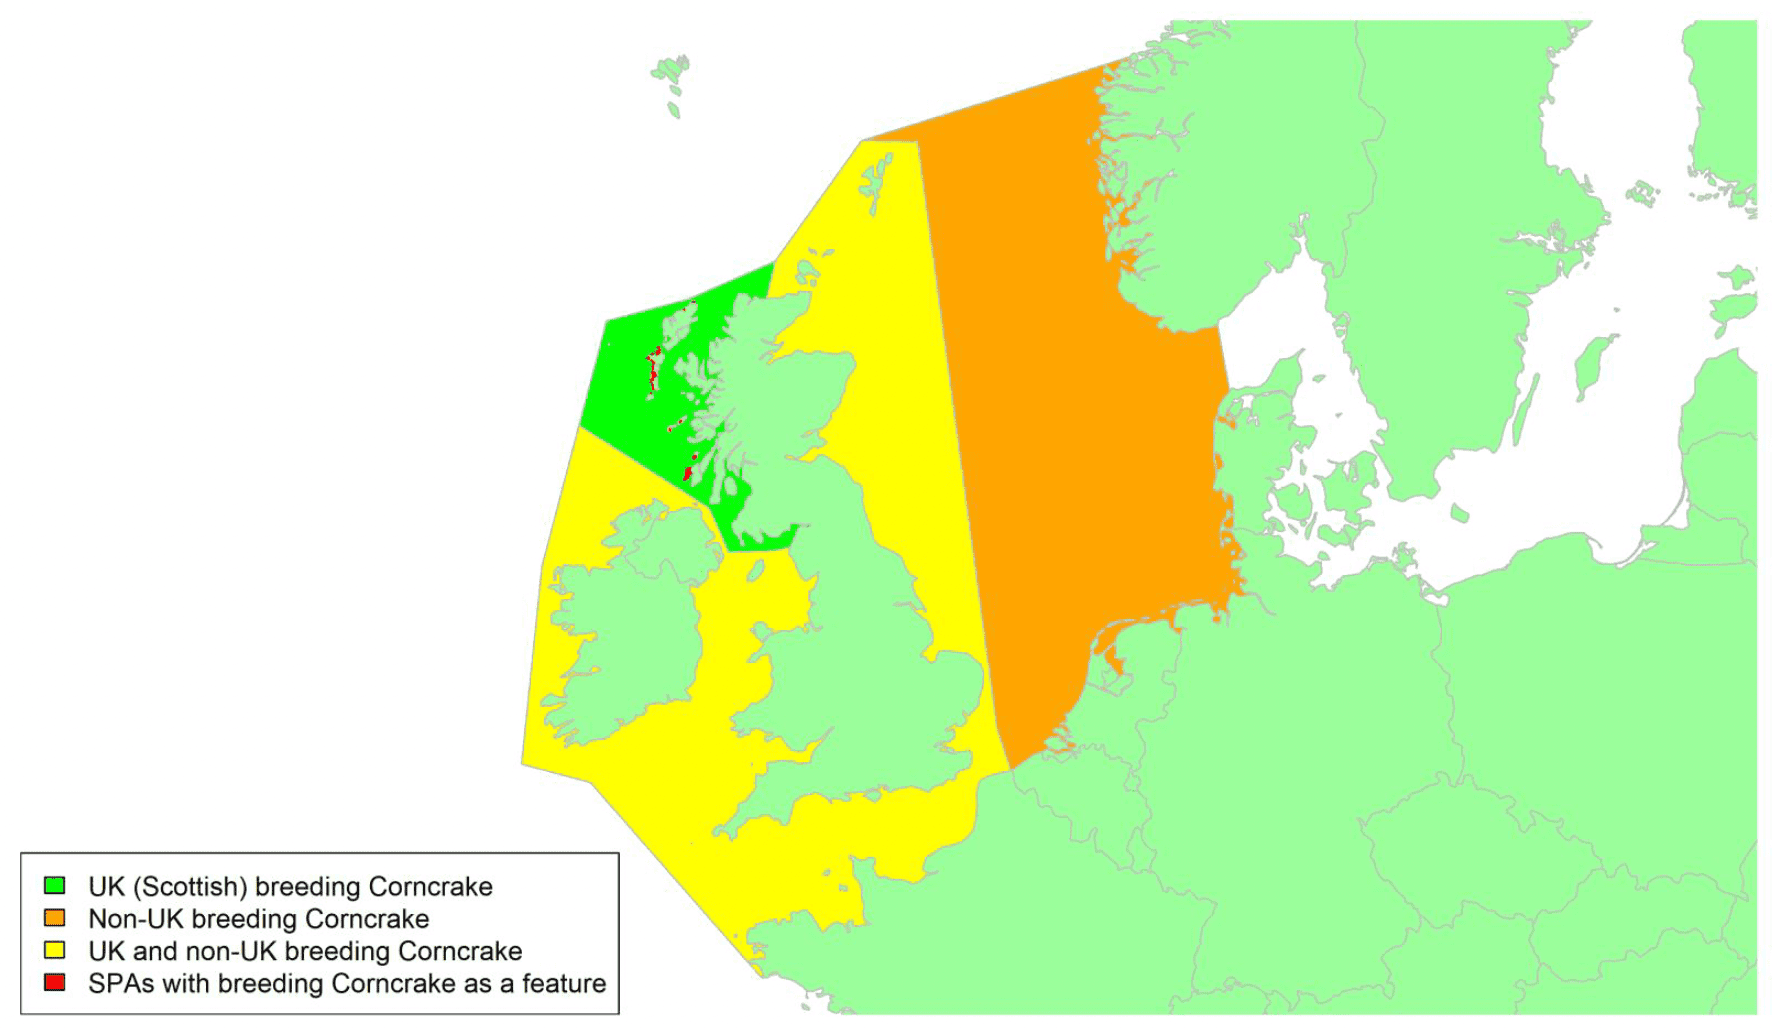
Migratory routes
Confidence: Low
Corncrake is a widespread species across Europe and central Asia. Populations have declined sharply in the western part of its breeding distribution, where intensive agricultural practices are prevalent. Numbers had previously remained stable in Russia and eastern Europe, but recent declines have also occurred in some eastern European countries (Keller et al. 2020). Within the UK, breeding Corncrakes are largely restricted to northwest Scotland, and Corncrakes also breed on mainland Ireland. Corncrakes in the British Isles appear to exhibit a much lower dispersal behaviour within breeding seasons than birds on mainland Europe, with ringing recoveries showing longest movements of adult males of 45 km (compared to up to 1,500km within one breeding season in the Netherlands, Germany, and the Czech Republic; Koffijberg et al. 2016).
No specific information is available on routes taken between wintering and breeding grounds by Scottish birds, with no new studies since Wright et al. (2012), so a broad migratory corridor must be assumed with potential movements by Scottish and non-Scottish breeding Corncrake across most UK waters, as indicated by the green and yellow shading in the above map. Populations breeding in Europe migrate to sub-Saharan east Africa for winter, mostly following an eastern route through the eastern Mediterranean and Kenya. However, ringing recoveries indicate that at least some individuals from Western breeding populations follow a western route, through France and Spain, and then crossing western Africa (Walther et al. 2013). An unknown proportion of Corncrake using this route will cross UK waters (shown by yellow and orange shading on the map). It is likely that less than 1% of the biogeographic population will cross UK waters and hence potentially be at risk of collision with wind turbines in UK waters, but this is very uncertain given lack of data.
Timing of migration
Confidence: Medium
A marked increase in BirdTrack reporting rates (see Appendix 2) of Corncrake in the Hebrides, where the main breeding populations occur in Scotland, indicates peak spring migration between mid-April and mid-May, while a marked decrease in reporting rates between the early July and the end of August indicates likely peak autumn migration. However, this should be treated with caution as this species can be difficult to detect by sight and hence the decreased autumn reporting rates could potentially indicate changes in vocalisation rather than (or in addition to) departures. First-brood radio tracked Corncrake chicks in Ireland departed on migration between mid-July and early August, with chicks from later broods departing between late-August and mid-September (Donaghy et al. 2011). The few migrants recorded elsewhere through BirdTrack confirm that some autumn passage movements may continue through September and into October. This may involve continental birds as well as Scottish birds.
Corncrakes are presumed to migrate at night like other members of the Rallidae, with peak activity one or two hours after sunset (Newton, 2010), but no specific data are available.
Flight heights
Confidence: Low
There is no available data on flight heights of migrating Corncrake, or Rallidae more generally. In the absence of such data, it is recommended that 100% of flights are assumed to take place at collision risk height.
Flight speeds
Confidence: Low
There is no data available on flight speeds of migrating Corncrake. In the absence of such data, it is recommended that the estimate of 13 m/s obtained for the closely related Spotted Crake is used for the purposes of collision risk modelling. In the absence of a measure of variation around this figure, it is recommended that a standard deviation of 2 m/s is used, drawing from values reported for other species.
Avoidance rates and behaviour
Confidence: Very Low
No avoidance rates have been reported for this species. In the absence of a suitable species-specific avoidance rate or, one for a related group, it is recommended that the gamebirds avoidance rate of 0.9875 (± 0.00174) is used for collision risk modelling (Table 5).
Spotted Crake Porzana porzana
SPA Species? |
Yes (breeding population) |
|---|---|
SPA site codes (Introduction, Table 2) |
180 |
Population size breeding (UK) |
27 males (APEP4, 2020); uncertainty: low |
Population size non-breeding (UK) |
n/a |
Population size (Biogeographical flyway, SPA season) |
161,000–251,000 males (European population, breeding; BirdLife International 2021); uncertainty: high |
Percentage of biogeographical population at risk of collision in UK waters (passage/breeding/non-breeding) |
<0.1%; uncertainty: high |
Movement of breeding birds
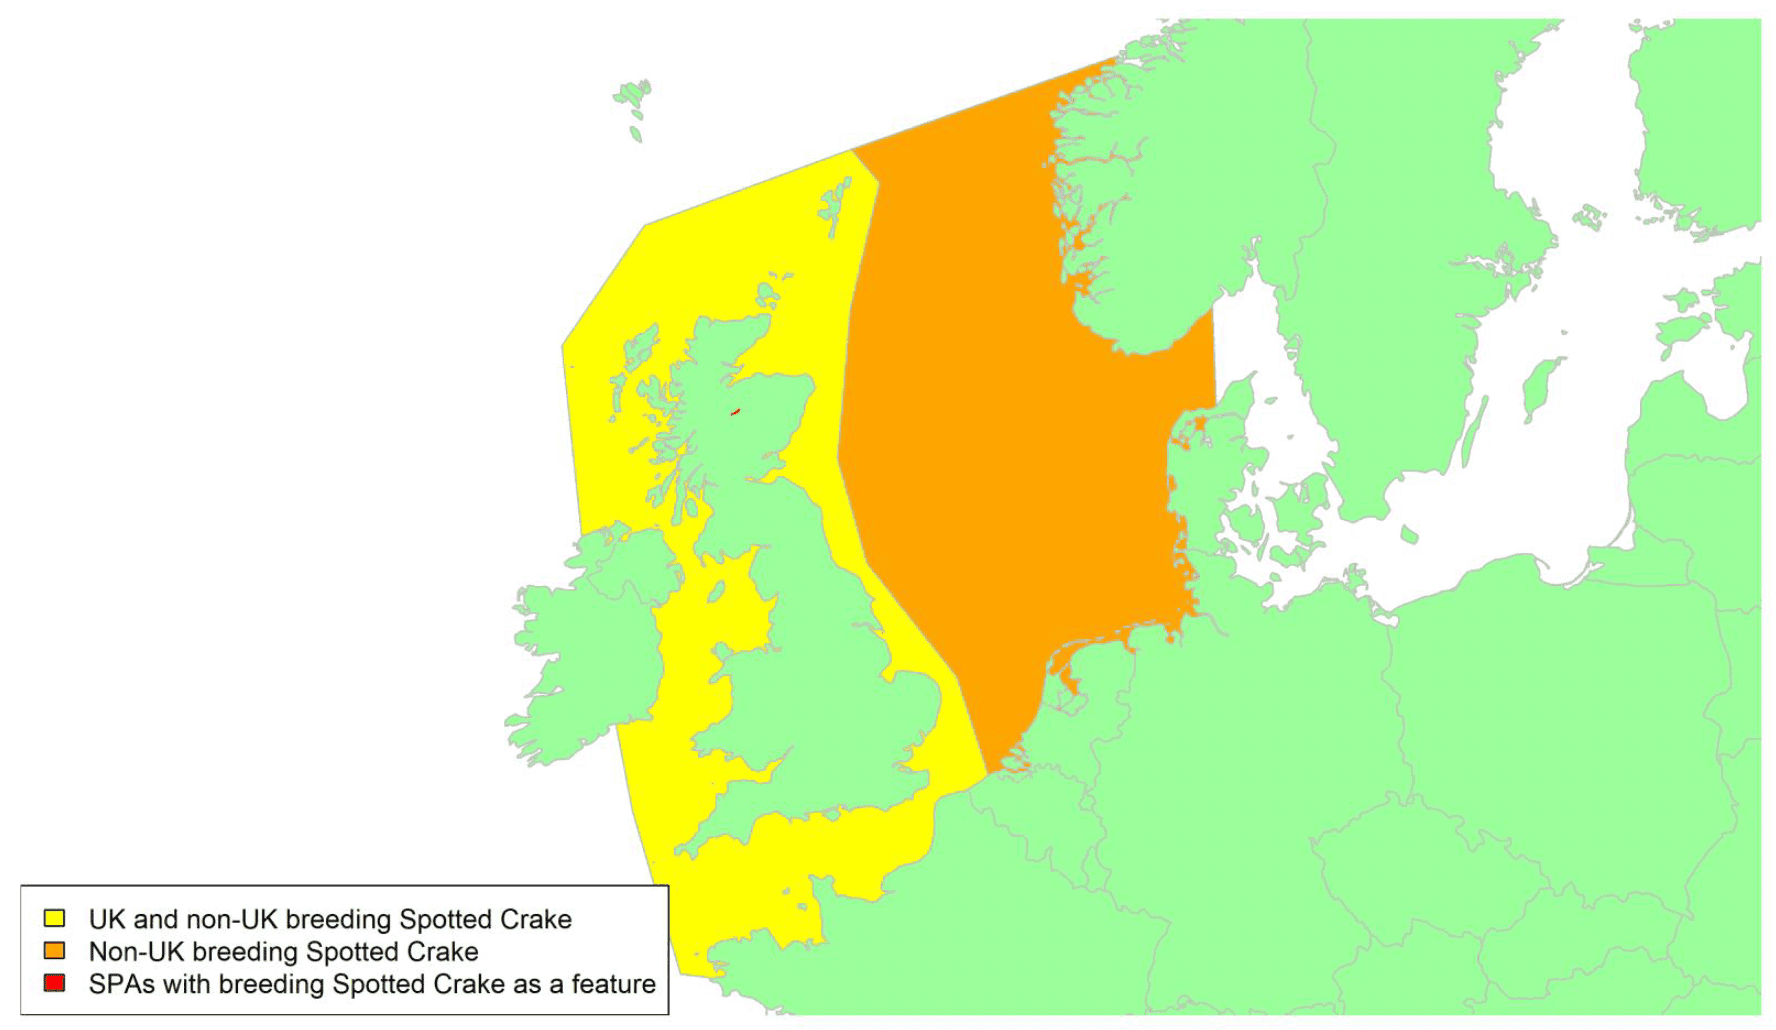
Migratory routes
Confidence: Low
Spotted Crake breeding distribution spans Britain and the Iberian Peninsula across temperate Europe and into western Asia. The main European breeding populations are found in eastern Europe and Russia, with breeding more sporadic in western Europe (Keller et al. 2020). Spotted Crakes are migratory, wintering in Africa, southern Europe, the Middle East, and southern Asia (Wernham et al. 2002). There is a small breeding population in Britain, of around 30 pairs (Schmitt et al. 2015; APEP4) which are thought to move south to winter in central and eastern Africa (Wernham et al. 2002). There is almost no data available on the migration of Spotted Crakes breeding in the UK, though birds are presumed to move south, so a broad migratory corridor must be assumed, as indicated by the yellow shading on the above map. The proportion of the biogeographic population at potential risk of collision with wind turbines in UK waters is likely to be negligible (less than 0.1%). However, it should be noted that this assumes that only a very small proportion of the birds breeding in eastern Europe and Russia migrate through the UK and then cross the North Sea as shown by orange shading on the map. This assumption seems likely as only a very small number of Spotted Crake are seen on migration, with an annual mean of 26 birds recorded between 2010 and 2019 (White & Kehoe, 2021). However, it is possible that more may pass through unobserved due to the unobtrusive behaviour of this species and the fact that they probably migrate at night (see below).
Timing of migration
Confidence: Low
Spotted Crake breeding in Britain begin to move south towards their wintering grounds from July, though may stop somewhere for two or three weeks to undergo moult (Wernham et al. 2002). Juveniles from first and second broods may remain in the breeding area until September or October respectively (Wernham et al. 2002). Spotted Crakes then leave wintering grounds by the end of April, with peak spring passage in Europe thought to be between March and April. Scottish breeding grounds are occupied by the end of May (Forrester et al. 2007).
BirdTrack reporting rate graphs (see Appendix 2) are difficult to assess for Spotted Crake due to low detectability rates for this secretive and scarce species, and hence any timings inferred from BirdTrack should be treated with caution. The movements of birds breeding and passing through the UK are poorly understood. The BirdTrack graphs suggest three main peaks may occur. Spring passage is suggested by small reporting rate peaks between mid-April and late May in many regions. A second peak between late June and late July might indicate the movement of adults away from breeding grounds, with another peak in September possibly indicating the movement of juveniles or the passage of migrants from elsewhere. In some regions the latter two peaks merge into a single peak, reflecting the fact that autumn migration is usually more protracted and that some passage birds stop to moult.
Spotted Crakes probably migrate mainly at night like other members of the Rallidae, with peak activity one or two hours after sunset (Newton, 2010), but no specific data are available.
Flight heights
Confidence: Low
There are no available data on flight heights of migrating Spotted Crake, or Rallidae more generally. In the absence of such data, it is recommended that a precautionary assumption of 100% of birds at collision risk height is used.
Flight speeds
Confidence: Low
Just one study has reported a flight speed for Spotted Crake, based on one flight tracked by radar. The airspeed recorded was 13 m/s (Alerstam et al. 2007). In the absence of other data, it is recommended that a value of 13 m/s is used for the purposes of collision risk modelling. In the absence of a measure of variation around this figure, it is recommended that a standard deviation of 2 m/s is used, drawing from values reported for other species.
Avoidance rates and behaviour
Confidence: Very Low
No avoidance rates have been reported for this species, or for Rallidae more generally. In the absence of a suitable species-specific avoidance rate or, one for a related group, it is recommended that the gamebirds avoidance rate of 0.9875 (± 0.00174) is used for collision risk modelling.
Great Crested Grebe Podiceps cristatus
SPA Species? |
Yes (non-breeding population) |
|---|---|
SPA site codes (Introduction, Table 2) |
1:37:38:55:63:73:84:123:210 |
Population size breeding (UK) |
4,900 pairs (APEP4, 2020); uncertainty: medium |
Population size non-breeding (UK) |
18,000 individuals (APEP4, 2020); uncertainty: low |
Population size (Biogeographical flyway, SPA season) |
500,000 - 690,000 individuals); uncertainty: medium (Wetlands International, 2021) |
Percentage of biogeographical population at risk of collision in UK waters (passage/breeding/non-breeding) |
0.1%–0.2% (non-breeding); uncertainty: high |
Movement of wintering birds
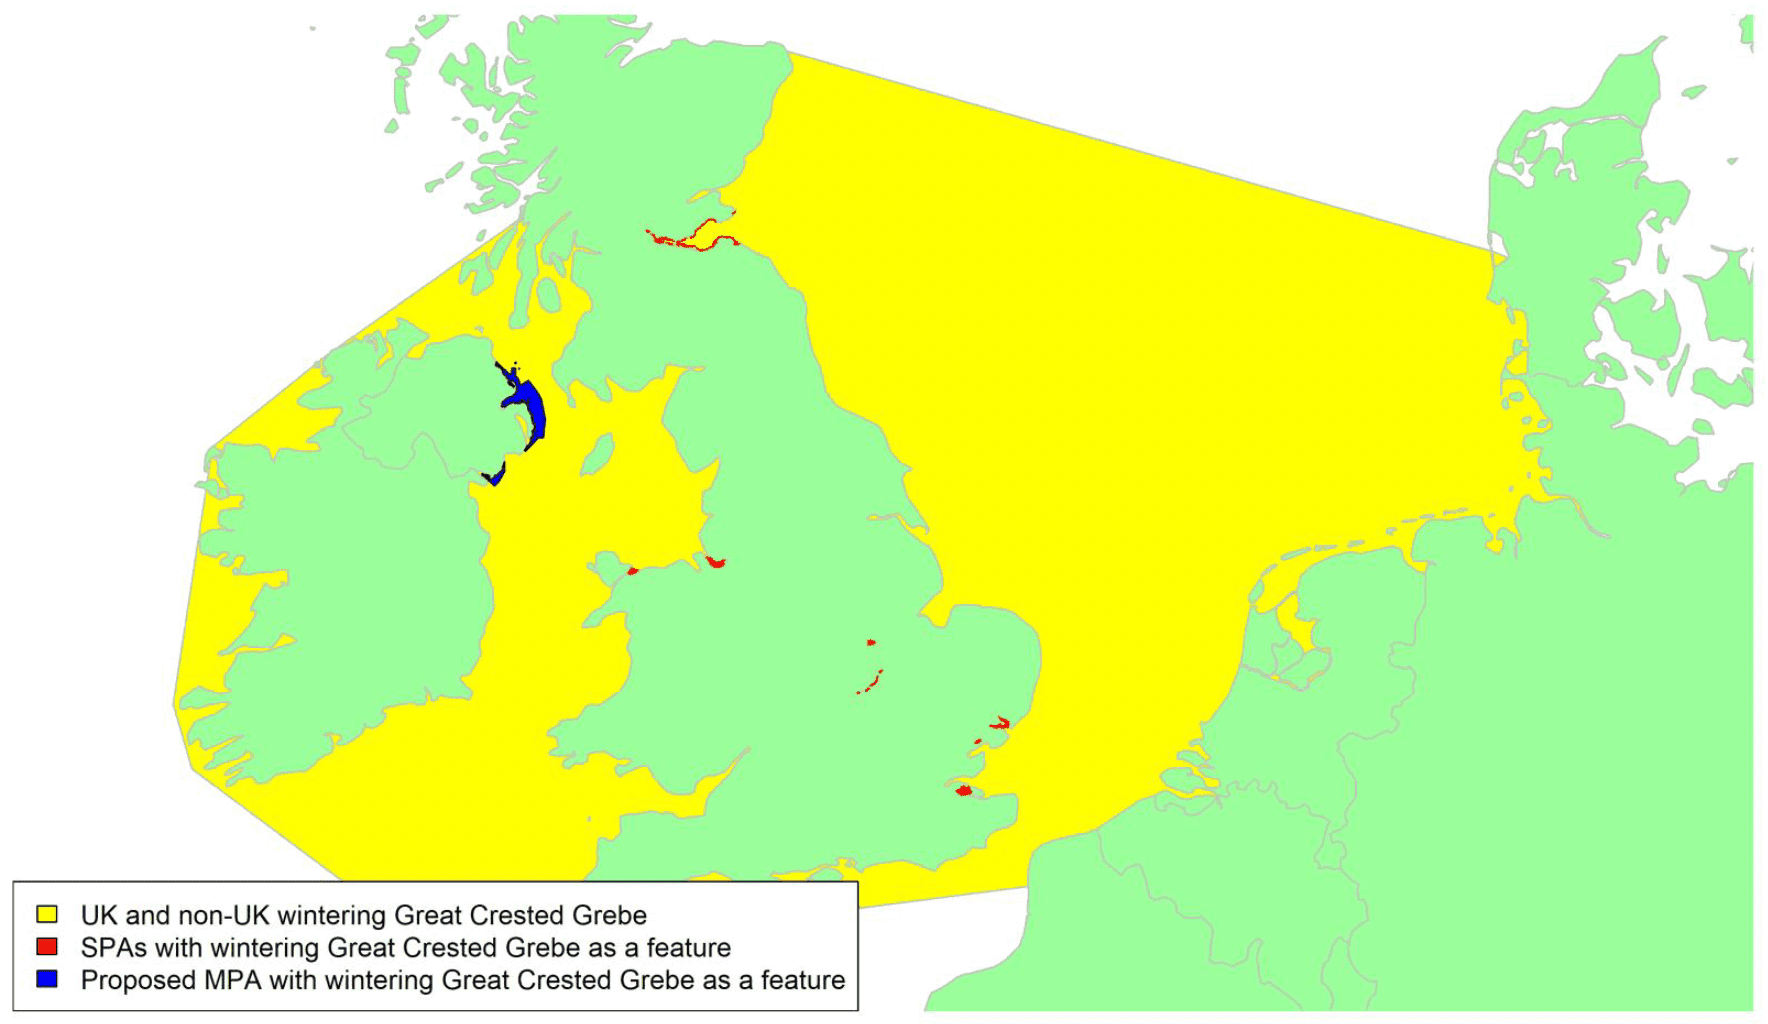
Migratory routes
Confidence: Low
There are three subspecies of Great Crested Grebe. The nominate P. c. cristatus has a wide breeding distribution across the Palearctic. In Europe, northern and eastern populations migrate to winter alongside resident populations in western and southern Europe (Forrester et al. 2007). Within Britain and Ireland, Great Crested Grebes are widespread and resident, breeding at inland water bodies. However, there are gaps in breeding distribution in some areas, most notably in the north of Scotland, Wales, and south-west England (Balmer et al. 2013). Birds largely move to coastal or large inland waters over winter, though some late breeders may remain on their breeding grounds all year (Wernham et al. 2007). Seasonal movements of Great Crested Grebes appear to be complex, with movements driven by variations in climate. However, a lack of ringing recoveries means that migration routes and the extent of interchange between Britain and Ireland and the continent remain largely unknown, though some movements of birds between continental Europe and southern England have been recorded (Wernham et al. 2002).
Movements of birds across UK waters may therefore be most likely to occur with the arrival of birds from the east. Consequently, it is likely that less than 1% of the biogeographic population of the species could potentially be at risk of collision with wind turbines in UK winters. This assumes that most UK breeding birds will not cross UK waters and will not be at risk; hence, the collection of further information on movements within the UK and Ireland would be prudent. The lack of data means that a broad migratory corridor surrounding the UK must be assumed, as indicated by the yellow shading on the above map.
Timing of migration
Confidence: Low
Great Crested Grebes begin to move away from their breeding grounds in Britain and Ireland in late July and August and undergo a simultaneous wing moult on wintering grounds between August and October (Wernham et al. 2002). In other parts of western Europe, a full or partial moult is undertaken at the breeding grounds with subsequent gradual dispersal to the coast extending until November (Wernham et al. 2002). Increased BirdTrack reporting rates (see Appendix 2) occur in most, though not all, regions in late summer and autumn, and timing of peak movements is very variable between regions. Peak movements in Scotland usually occur between late July and September, whereas they tend to be later in England and Wales and occur mostly during November; timing in Northern Ireland is unclear (see Appendix 2). These differences may indicate that different moulting strategies could occur within the UK. Movement of birds between Britain and the continent is likely to vary between years with climactic variation. In spring, most wintering Great Crested Grebes in Britain and Ireland return to their breeding grounds from mid-February (Wernham et al. 2002). However, BirdTrack reporting rates indicate peak movements occur in many regions between mid-March and mid-May. These movements could involve some late-returning British breeders as well as some birds returning to the continent.
Most Grebe migration occurs at night (Wernham et al. 2002).
Flight heights
Confidence: Low
There is very little available information on flight heights of Great Crested Grebe. One observational study using binoculars estimated flight heights of between 5 and 10 m over sea, but the sample size and season are not known (Garthe and Hüppop, 2004). From a sample size of 82 across four studies, the proportion of Great Crested Grebe flights at collision risk height (defined in this instance as 20-150m) was zero (Cook et al. 2012). The sample size of birds recorded is low and may not be reflective of migratory movements. Given this uncertainty, it is recommended that, for the purposes of collision risk modelling in relation to migratory birds, 100% of flights are assumed to take place at collision risk height.
Flight speeds
Confidence: Low
No flight speeds have been recorded for this species. In the absence of species-specific flight speed estimates, it is recommended that the estimate obtained for the related Slavonian grebe of 21.13 m/s (SD 1.55) is used for the purposes of collision risk modelling.
Avoidance rates and behaviour
Confidence: Very Low
No avoidance rates have been reported for this species. A macro-avoidance rate of 0.28 has been reported for grebes as a group, based on the percentage of radar tracks entering a windfarm, but the associated confidence is low.In the absence of a suitable species-specific avoidance rate or, one for a related group, it is recommended that an all-species avoidance rate of 0.9954 (± 0.00002) is used for collision risk modelling.
Slavonian Grebe Podiceps auritus
SPA Species? |
Yes (breeding and non-breeding populations) |
|---|---|
SPA site codes (Introduction, Table 2) |
23:76:123:144:146:148:157:160:170:198:199:200:201:202 |
Population size breeding (UK) |
28 pairs (APEP4, 2020); uncertainty: low |
Population size non-breeding (UK) |
995 individuals (APEP4, 2020); uncertainty: medium |
Population size (Biogeographical flyway, SPA season) |
4,600 – 5,300 individuals (NW Europe, breeding); uncertainty: medium 26,600 – 36,300 individuals (4,600 – 5,300 NW Europe and 22,000 – 31,000 NE Europe, wintering;); uncertainty: medium (Wetlands International, 2021) |
Percentage of biogeographical population at risk of collision in UK waters (passage/breeding/non-breeding) |
>1% (breeding); uncertainty: high, >4.3% (wintering); uncertainty: high |
Movement of breeding and wintering birds
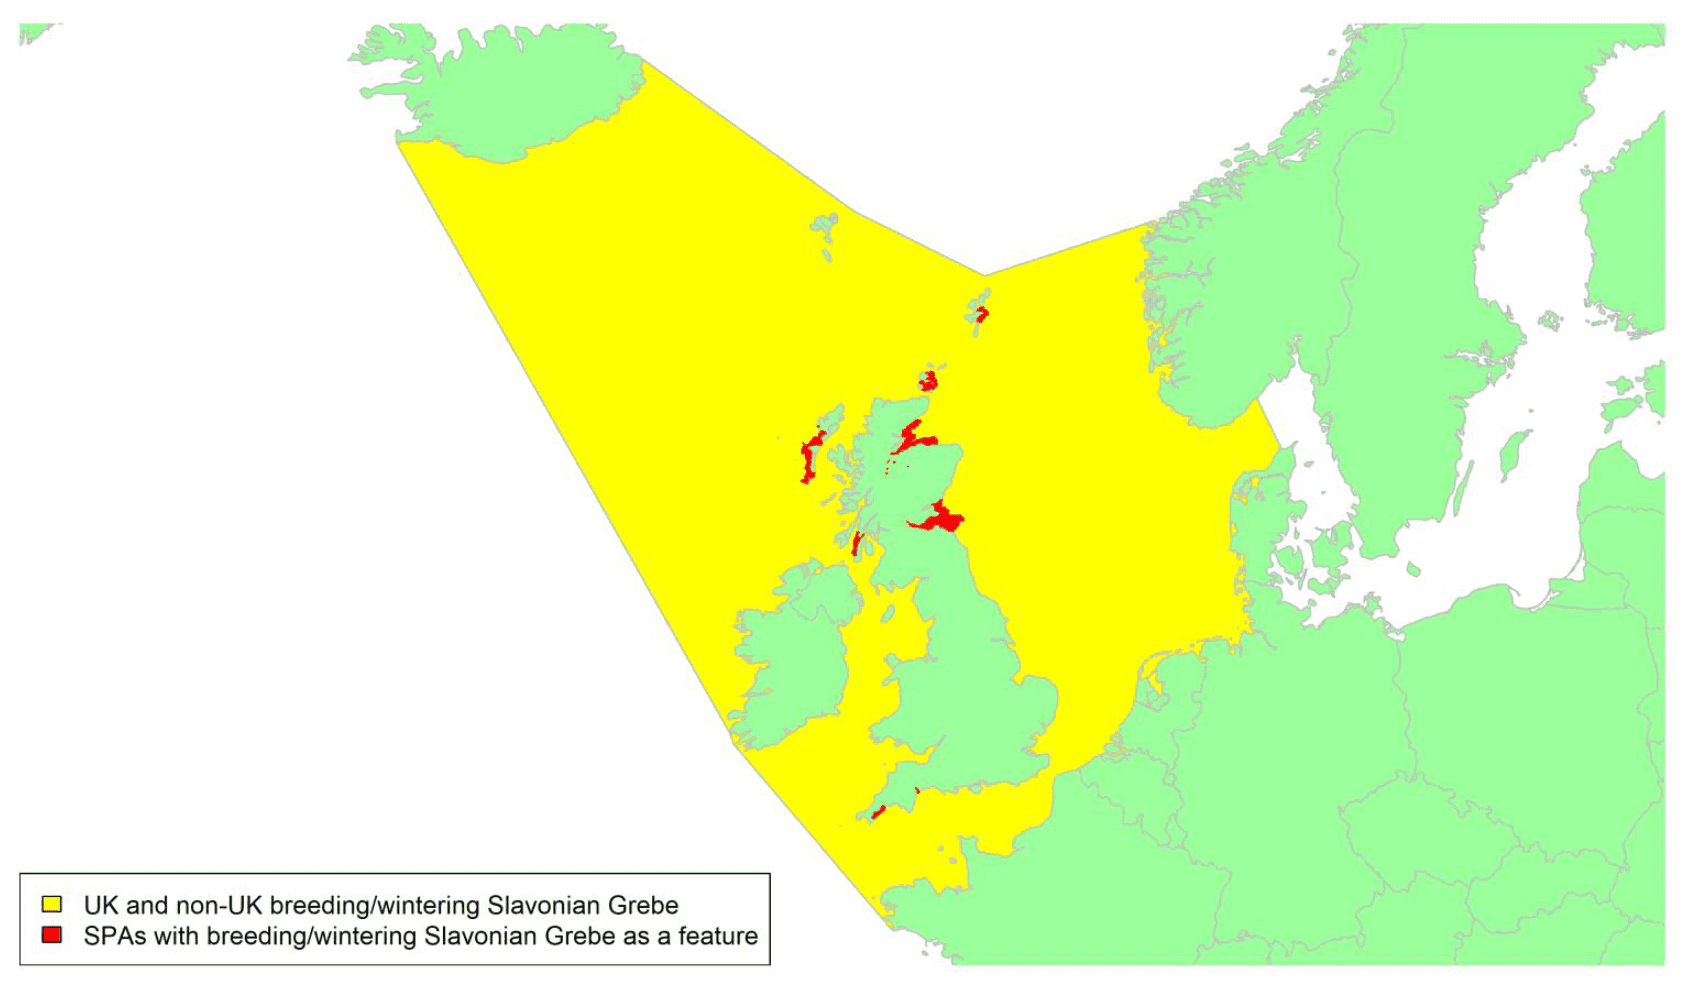
Migratory routes
Confidence: Low
Slavonian Grebe has a wide breeding distribution across the Holarctic with several subspecies, with the nominate P.a. auritus occurring in Britain and Ireland. The large-billed NW European form (sometimes considered a separate subspecies P. a. arctica) breeds in Scotland, Iceland and northern Norway, and winters predominantly off northwest Scotland and Ireland, Iceland, Greenland, and northwest Norway (Wernham et al. 2002). The small-billed NE European formbreeds east from Sweden, Finland and the Baltic states and is thought to winter predominantly off the east coast of Britain and the southern North Sea (Wernham et al. 2002). Slavonian Grebes often stay on wintering grounds for extended periods, though some weather-induced movements have been seen (Wernham et al. 2002). However, the lack of ringing recoveries or tracking studies of birds from Britain and Ireland means that migration routes are poorly understood, and a broad migratory corridor must be assumed.
Slavonian Grebes breeding in Scotland are therefore likely to pass through waters to the north and northwest, while birds arriving to the UK from the east are likely to pass across the North Sea. However, our lack of understanding of migratory routes used means that we should assume that birds could pass through any waters, indicated by the yellow shading on the above map. The proportion of the wintering biogeographic population (including birds from both NE European and NW European populations) that could potentially be at risk of collision with wind turbines in UK wintering waters will be at least 4.3%. It may be substantially higher if large numbers of Slavonian Grebes from the NW European population pass through UK waters on passage. Similarly, the proportion of the breeding population at potential risk will be at least 1% but may be higher (NE European population only).
Timing of migration
Confidence: Medium
Slavonian Grebes breeding in Scotland often remain at their breeding lochs until late October but have mostly left by November. Passage begins during August, presumably of birds of the NW European formbreeding further north. Concentrations at wintering sites peak in midwinter, particularly in the Firth of Forth and off the Northern Isles (Wernham et al. 2002). Peak movements of the NE European formare in October and November, with birds leaving their eastern breeding grounds from late August (Wernham et al. 2002).
The arrival of birds from different breeding populations around the Scottish coast is reflected in a protracted increase in BirdTrack reporting rates between late August and mid-November, with a double peak (see Appendix 2). Elsewhere in the UK, wintering birds arrive mostly between mid-September and late October, although the timing varies slightly across different regions. Spring departures then begin in March and April, with Scottish breeders usually back on breeding grounds in March (Forrester et al. 2007). BirdTrack reporting rates indicates peak spring movement between mid-February and late April.
Most Grebe migration occurs at night (Wernham et al. 2002).
Flight heights
Confidence: Low
No flight heights have been reported for this species. In the absence of any flight height data for this species, it is recommended that a precautionary estimate of 100% of birds at collision risk height is assumed.
Flight speeds
Confidence: Low
Binford and Youngman (2010) estimated the flight speed of 28 Slavonian grebes over 3 days by recording the time taken by birds observed flying between two fixed points. Over these 3 days, the speeds estimated were 21.13 m/s (SD 1.55, n = 14), 20.19 m/s (SD 1.30, n = 8) and 22.36 (SD 0.75, n = 6). We recommend that the speed recorded on the first day, when the greatest number of birds was recorded, of 21.13 m/s (SD 1.55) is used for the purposes of collision risk modelling.
Avoidance rates and behaviour
Confidence: Very Low.
No avoidance rates have been reported for this species. A macro-avoidance rate of 0.28 has been reported for grebes as a group, based on the percentage of radar tracks entering a windfarm, but the associated confidence is low. In the absence of a suitable species-specific avoidance rate or, one for a related group, it is recommended that an all-species avoidance rate of 0.9954 (± 0.00002) is used for collision risk modelling.
Stone-curlew Burhinus oedicnemus
SPA Species? |
Yes (breeding population) |
|---|---|
SPA site codes (Introduction, Table 2) |
10:52:56 |
Population size breeding (UK) |
365 pairs (APEP4, 2020); uncertainty: high |
Population size non-breeding (UK) |
0 (APEP4, 2020); uncertainty: high |
Population size (Biogeographic flyway, SPA season) |
107,000-176,000 individuals (Europe, breeding; BirdLife International 2021); uncertainty: high |
Percentage of biogeographic population at risk of collision in UK waters (passage / breeding / non-breeding) |
0.5%(breeding); uncertainty: high |
Movement of breeding birds
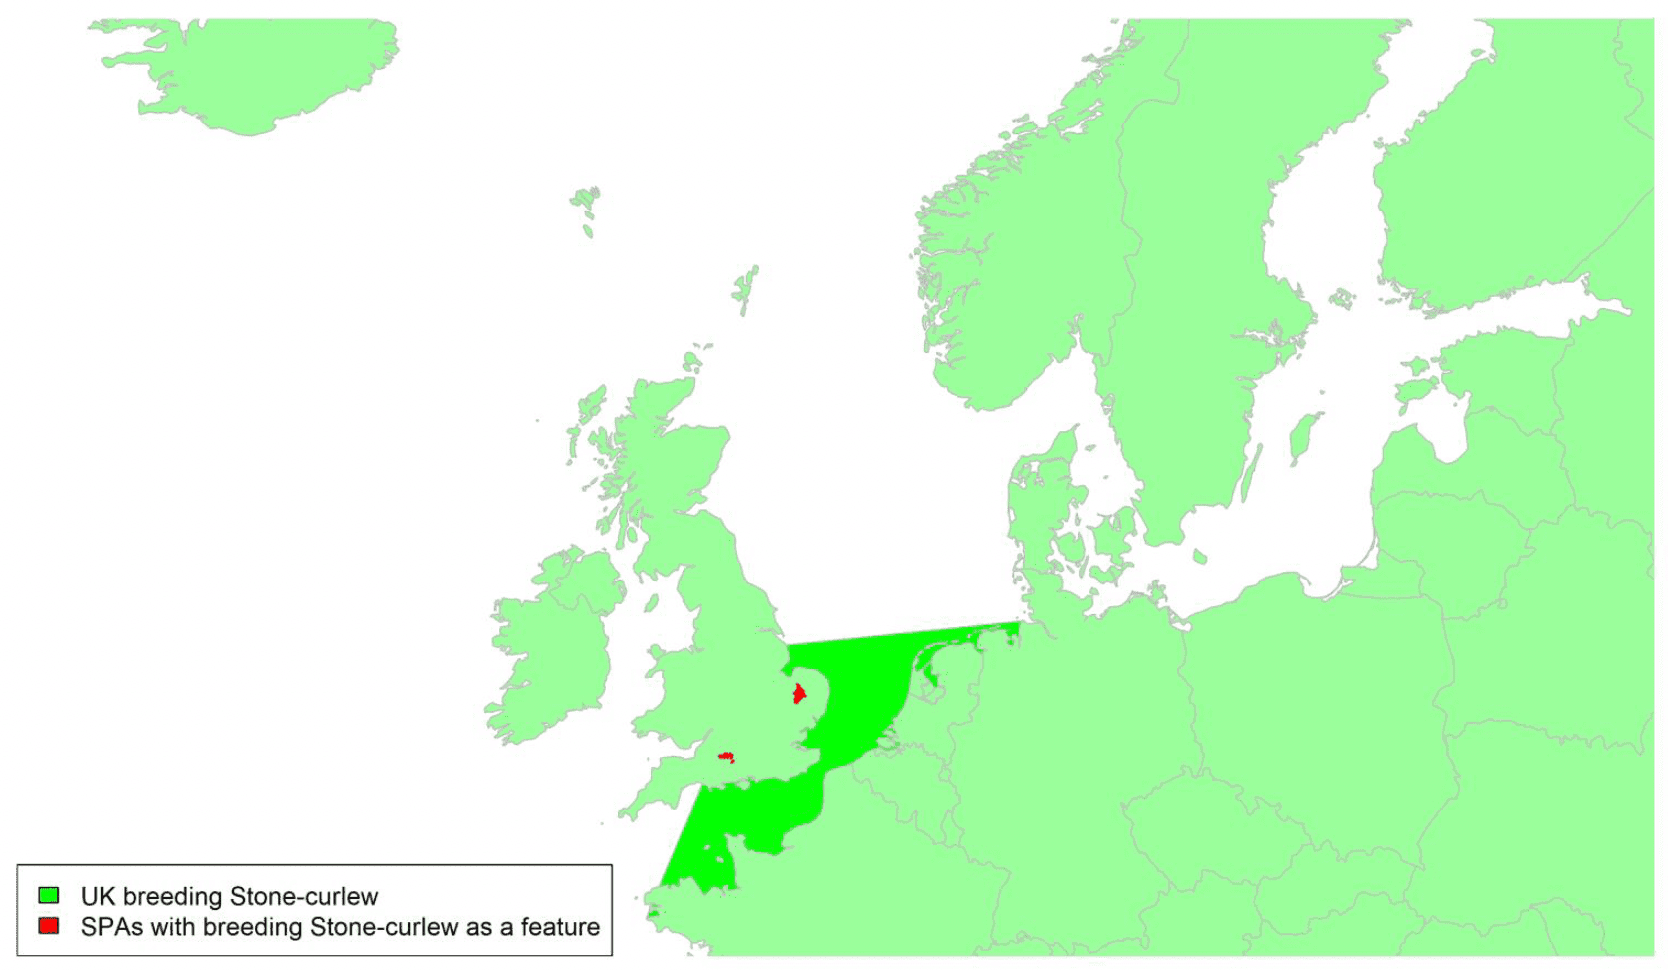
Migratory routes
Confidence Low
The breeding range of Stone-curlew ranges from the UK across southern and central Europe to Kazakhstan. In the UK, it is restricted to southern and eastern England, represented by the three SPAs for Stone-curlew in Breckland, Porton Down and Salisbury Plain. UK breeding Stone-curlews winter in the Mediterranean and West Africa with ringing recoveries indicating that individuals probably migrate across the Channel to France in autumn before continuing southwards. In spring, individuals may follow a more easterly route across the southern North Sea on their return migration, as indicated by recoveries and sightings of colour-ringed birds in the Netherlands and Belgium at this time. Birds may therefore cross the areas of UK waters shaded green on the above map. There is no indication of significant passage of Stone-curlews from breeding sites elsewhere in Europe across UK waters. Consequently, the proportion of the biogeographic population that could potentially be at risk of collision with wind turbines in UK waters is less than 1%. Understanding of precise migration routes and timings could be improved, with no new studies on UK breeding Stone-curlews since Wright et al. (2012).
Stone-curlews are short-distance migrants, often making migratory movements at night (Giunchi et al. 2015).
Timing of migration
Confidence Low
Breeding Stone-curlews are typically present on their UK breeding grounds between March and October (Glue & Morgan, 1974). Ringing recoveries suggest that autumn migration of Stone-curlew typically occurs in October (Green et al. 2007, Wernham et al. 2002). Based on the BirdTrack reporting rates for eastern England (see Appendix 2), spring migration occurs between mid-March and mid-May, and autumn migration between early August and late September. There is no clear pattern for other regions of the UK, with reporting rates generally being very low.
Flight heights
Confidence: Low
No data is available on flight heights of Stone-curlew. In the absence of data on flight heights, it is recommended that a precautionary assumption of 100% of flights at collision risk height is used.
Flight speeds
Confidence: Low
No data is available on flight speeds of Stone-curlew. In the absence of species-specific estimates, it is recommended that the same flight speed used for the Oystercatcher, the most closely related species covered in this review, of 13 m/s ± 2.5 is used for the purpose of collision risk modelling.
Avoidance rates and behaviour
Confidence: Very Low
No macro-, meso- or micro-avoidance rates have been reported for this species. A low macro-avoidance rate of 0.28 has been reported for waders as a group, based on the percentage of radar tracks entering offshore wind facilities (Krijgsveld et al. 2011). However, post-construction monitoring data collected from onshore windfarms where wader species were observed suggests that avoidance rates are likely to be high (Table 5). Drawing from these data, for the purposes of collision risk modelling, the recommended value for all wader species is 0.9996 ± 0.00002 (Table 5).
Oystercatcher Haematopus ostralegus
SPA Species? |
Yes (breeding and non-breeding populations) |
|---|---|
SPA site codes (Introduction, Table 2) |
23:24:30:37:39:41:54:69:70:78:80:114:116: 123:124:135:165:166:172:185:187:205:210 |
Population size breeding (UK) |
95,500 pairs (APEP4, 2020); uncertainty: medium |
Population size non-breeding (UK) |
305,000 individuals (APEP4, 2020); uncertainty: low |
Population size (Biogeographic flyway, SPA season) |
309,987 – 421,756 pairs (Europe, breeding; van de Pol et al, 2014) 750,000 – 970,000 wintering individuals (Europe, wintering); uncertainty: medium (Wetlands International, 2021) |
Percentage of biogeographic population at risk of collision in UK waters (passage / breeding / non-breeding) |
23–31% (breeding); uncertainty: high >37% (wintering); uncertainty: high |
Movement of breeding birds
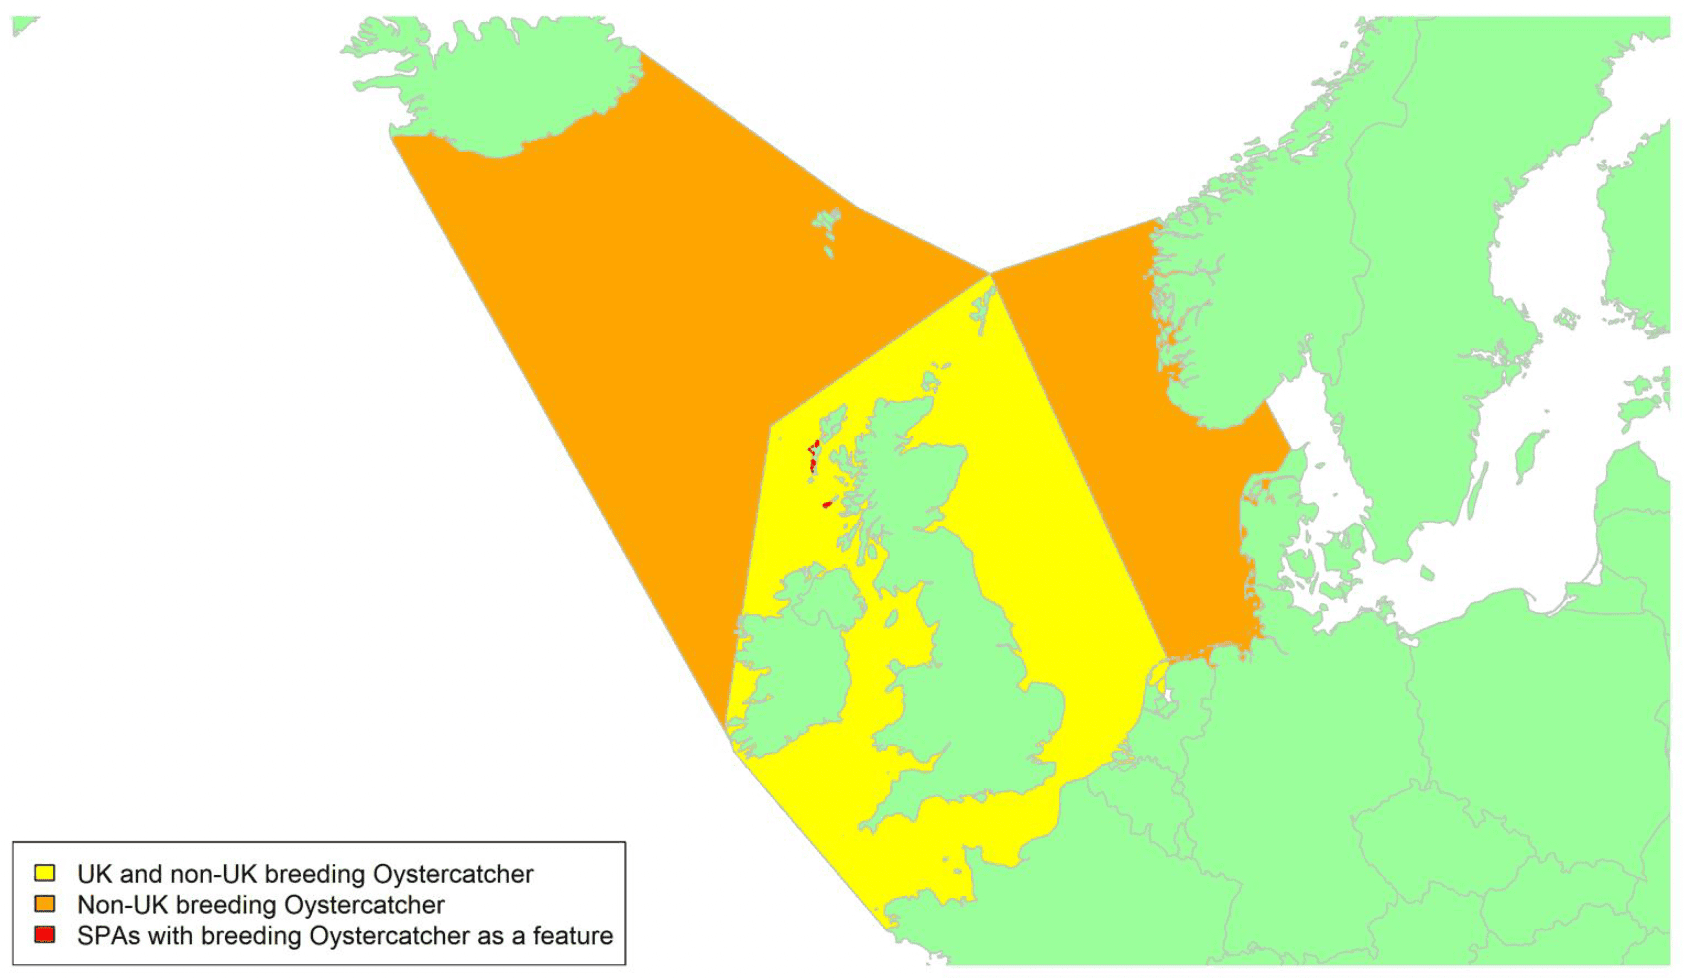
A)
Movement of wintering birds
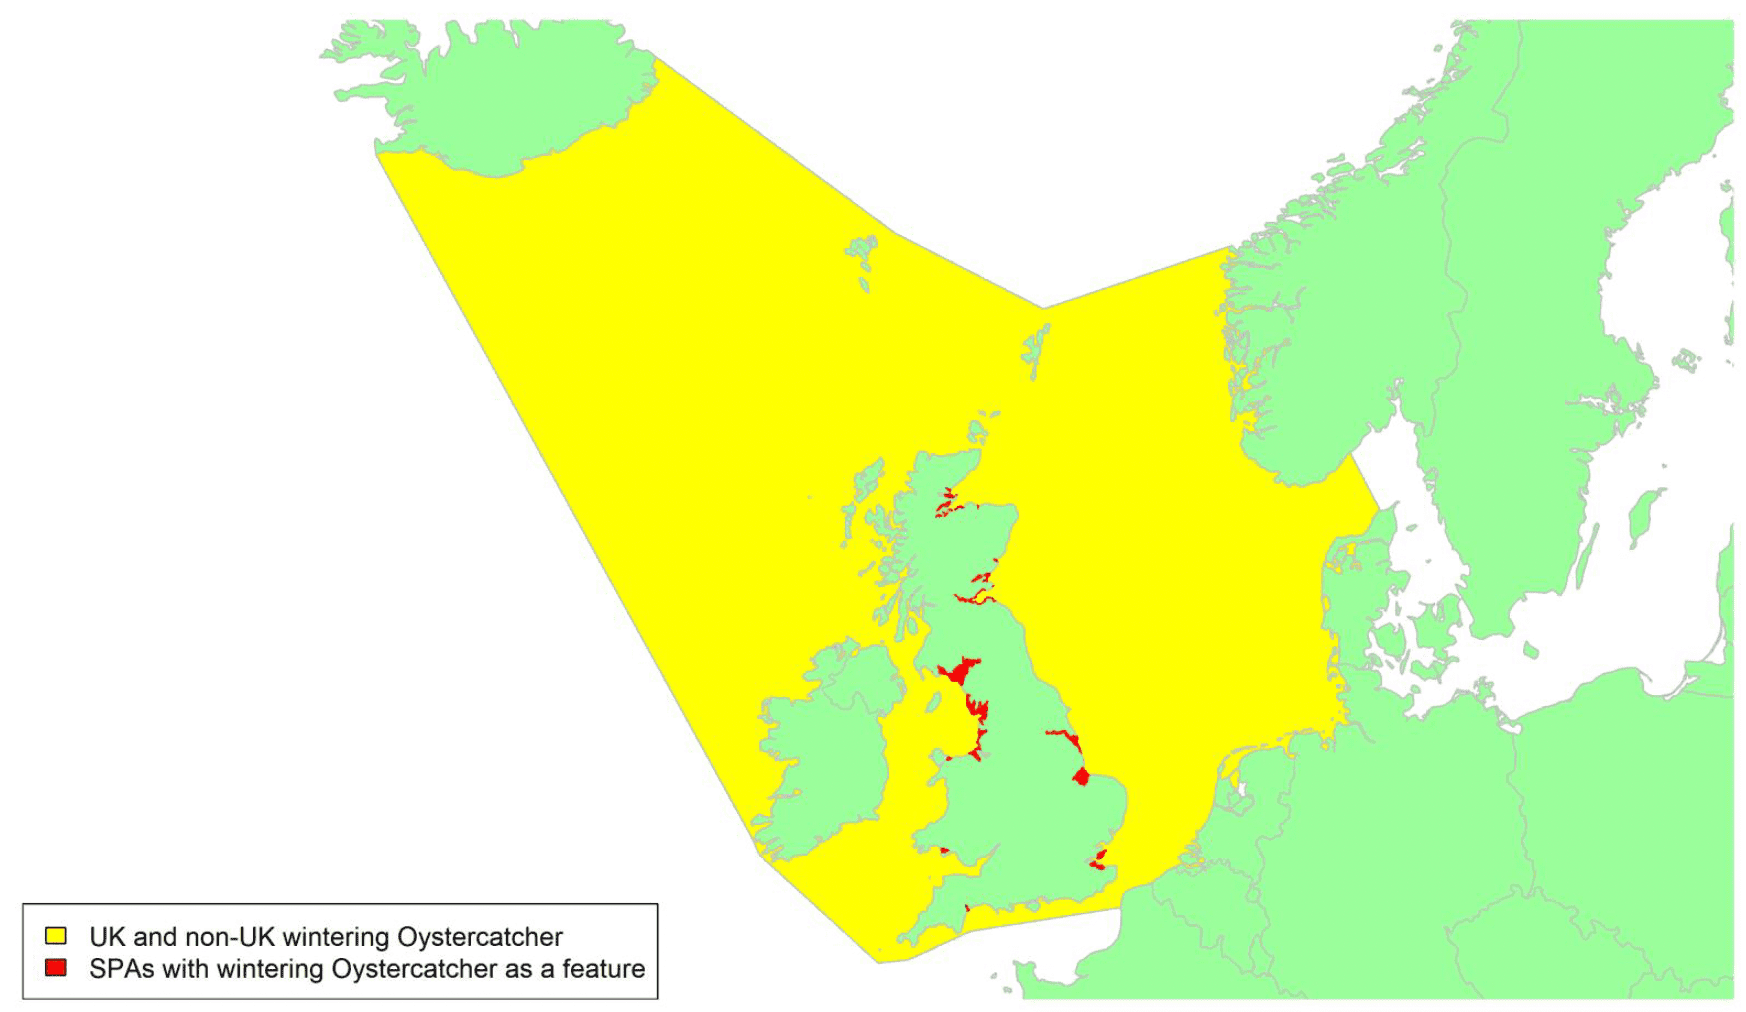
Migratory routes
Confidence: Low
The Eurasian oystercatcher is a widespread species found across Europe and in east Asia, comprising three flyway populations. The main breeding and wintering areas of the subspecies found in Britain and Ireland, H. o. ostralegus,are centred on the North Sea, with the UK hosting important populations of both breeders and non-breeders (Van De Pol et al. 2014).
The British breeding population of Oystercatchers tends to move south in the non-breeding season, with birds in the north of Britain generally moving furthest. These movements take some birds across the Irish Sea or English Channel to France, Spain, or Ireland (particularly during severe winters), but many breeding birds, especially adults, will remain as residents in the UK throughout the winter. British breeding birds are hence most likely to cross the areas shaded yellow on the breeding map above. There is also a large influx of Oystercatchers to Britain and Ireland in the non-breeding season, from Norway, Iceland, the Faroe Islands, Belgium, and the Netherlands. Birds that migrate to winter in the east of the UK mostly come from Norway, Belgium, or the Netherlands, those that winter in Ireland come from Iceland and the Faroe Islands, while those wintering elsewhere in the UK come from both directions (Wernham et al. 2002).
Around 200,000 Oystercatcher migrate to the UK to spend the winter. Approximately 26,000 Icelandic Oystercatchers migrate to western Europe to overwinter, three-quarters of which go to the British Isles (Þórisson et al. 2018, van de Pol et al. 2014). Additionally, large numbers of birds come from Norway, Belgium and the Netherlands and will cross the North Sea. Non-breeding populations of Oystercatchers form designated features of 19 different SPAs all around the coast of the UK, which supports 37% of the H. o. ostralegus population during the non-breeding season, based on the population estimates given above. This can be considered a minimum estimate of the proportion of the biogeographic non-breeding population that could potentially be at risk of collision with wind turbines in UK waters, as it does not include an additional unknown number of individuals from overseas which cross UK waters on passage but do not overwinter. Ringing recoveries indicate that Oystercatchers wintering in the UK could migrate across all parts of UK waters as shown by the yellow shading on the wintering map, though specific routes followed remain unknown. GPS tracking was carried out on a small sample of ten wintering individuals caught by the Wash Wader Ringing Group in November and December 2020 (Clewley et al. 2021). These birds crossed the North Sea in spring 2021, with birds leaving the UK from points ranging between south Norfolk and the Scottish border, and making initial landfall in the Netherlands, Denmark, and Norway, with all birds subsequently turning north and following the Norwegian coast (see map in Appendix 1). Although based on only a very small sample, the wide spread of tracks suggests that a broad migration front can be assumed for this species
Timing of migration
Confidence: Low
Oystercatchers are present in the UK year-round. Peak migration times can be inferred from BirdTrack reporting rates (see Appendix 2), although these are difficult to interpret due to variation in timing of movements of different populations. There is a marked increase on the Scottish coast between the end of January and the beginning of March indicating spring migration to breeding areas, and a marked decrease between mid-July and mid-November. The protracted migration periods indicated are likely to be a result of slightly different timings in the movements of resident breeders and those that migrate to the UK for the winter from a range of different breeding areas. The BirdTrack reporting rates in eastern and northwest England show a similar pattern. Inland breeding is most widespread in these regions and in Scotland (Balmer et al. 2013) and hence the similar patterns may largely reflect local movements involving resident breeders. Elsewhere in England, Wales and Northern Ireland, numbers increase from July onwards and then decrease in autumn, reflecting the movements of British and European breeders into and out of these regions during the post-breeding period. The timing of these movements varies regionally and the peak in south-west England is notably later than elsewhere, occurring in mid-October.
It is likely that overseas migration by Oystercatchers is largely at night, though some movement during the day may also occur (Dirksen et al. 1998; Newton, 2010).
Flight heights
Confidence: Low
There is very little available data on flight heights of migrating Oystercatcher. A radar study reported flight heights of migrating waders on the coast of the Netherlands of between 50 and 90 m, with Oystercatchers appearing to fly at lower altitudes on average than the other species (Dirksen et al. 1998). Visual assessments of birds flying closer to the seashore indicated lower flight heights, of below 30 m (Dirksen et al. 1998). In the absence of more detailed data from migratory movements over sea, it is recommended that a precautionary estimate of 100% of birds at collision risk height is used.
Flight speeds
Confidence: Medium
Two studies have recorded flight speeds of migrating Oystercatcher. Tracking radar measurements of 19 birds migrating over Sweden and the Arctic recorded a mean airspeed of 13 m/s (± 2.5 SD; Alerstam et al. 2007). Theodolite measurements of 3 birds migrating in the Baltic recorded airspeeds of 15.9 m/s (± 0.6 SD; Pennycuick et al. 2013). GPS tracks of 13 non-migratory flight movements made during the breeding season in the Netherlands recorded a mean speed of 10.9 m/s (± 4.5 SD), though whether speeds were air or ground was not specified (Shamoun-Baranes et al. 2012). As the estimate based on the largest sample size of birds on migration, it is recommended that a flight speed estimate of 13 m/s ± 2.5 is used for the purposes of collision risk modelling.
Avoidance rates and behaviour
Confidence: Low
No macro-, meso- or micro-avoidance rates have been reported for this species. A low macro-avoidance rate of 0.28 has been reported for waders as a group, based on the percentage of radar tracks entering offshore wind facilities (Krijgsveld et al. 2011). However, post-construction monitoring data collected from onshore windfarms where wader species were observed suggests that avoidance rates are likely to be high (Table 5). Drawing from these data, for the purposes of collision risk modelling, the recommended value for all wader species is 0.9996 ± 0.00002 (Table 5).
Avocet Recurvirostra avosetta
SPA Species? |
Yes (breeding and non-breeding populations) |
|---|---|
SPA site codes (Introduction, Table 2) |
2:11:18:21:23:24:27:30:37:40:44:51:63:64:65:67 |
Population size breeding (UK) |
1,950 pairs (APEP4, 2020); uncertainty: high |
Population size non-breeding (UK) |
8,700 individuals (APEP4, 2020); uncertainty: high |
Population size (Biogeographic flyway, SPA season) |
100,000 – 110,000 individuals (NW Europe, breeding); uncertainty: high (Wetlands International, 2021) |
Percentage of biogeographic population at risk of collision in UK waters (passage / breeding / non-breeding) |
2.7% (breeding); uncertainty: high 11.9% (non-breeding); uncertainty: high |
Movement of breeding birds
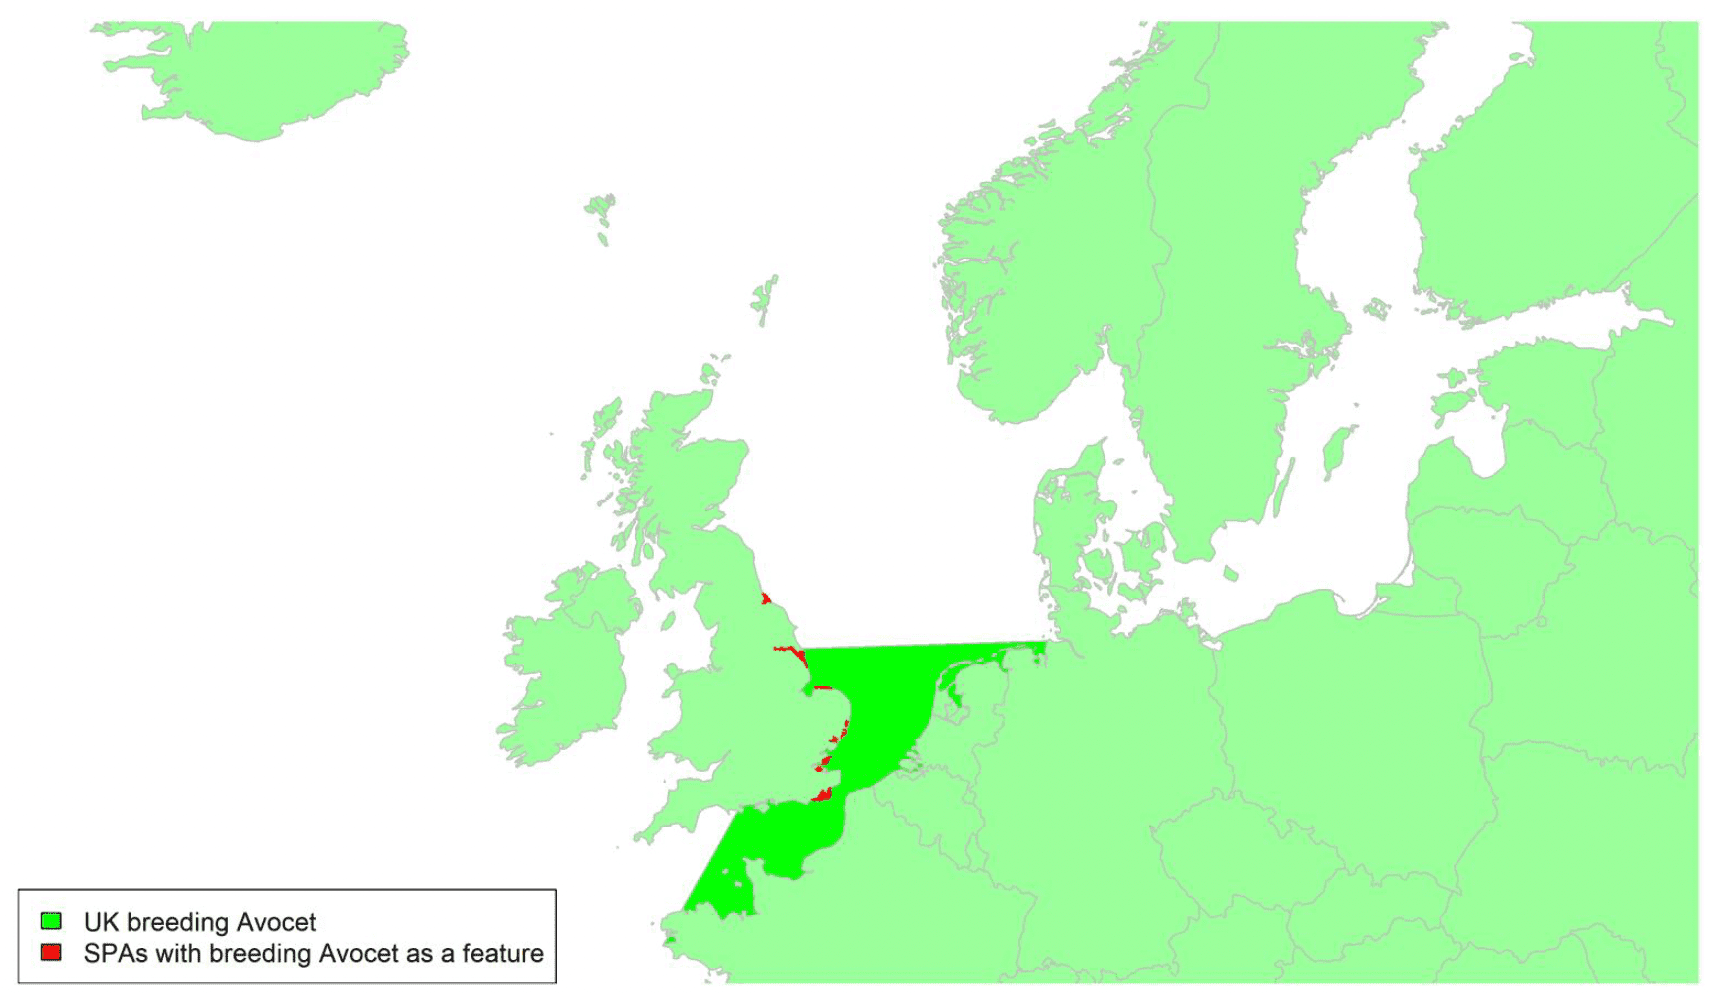
Movement of wintering birds
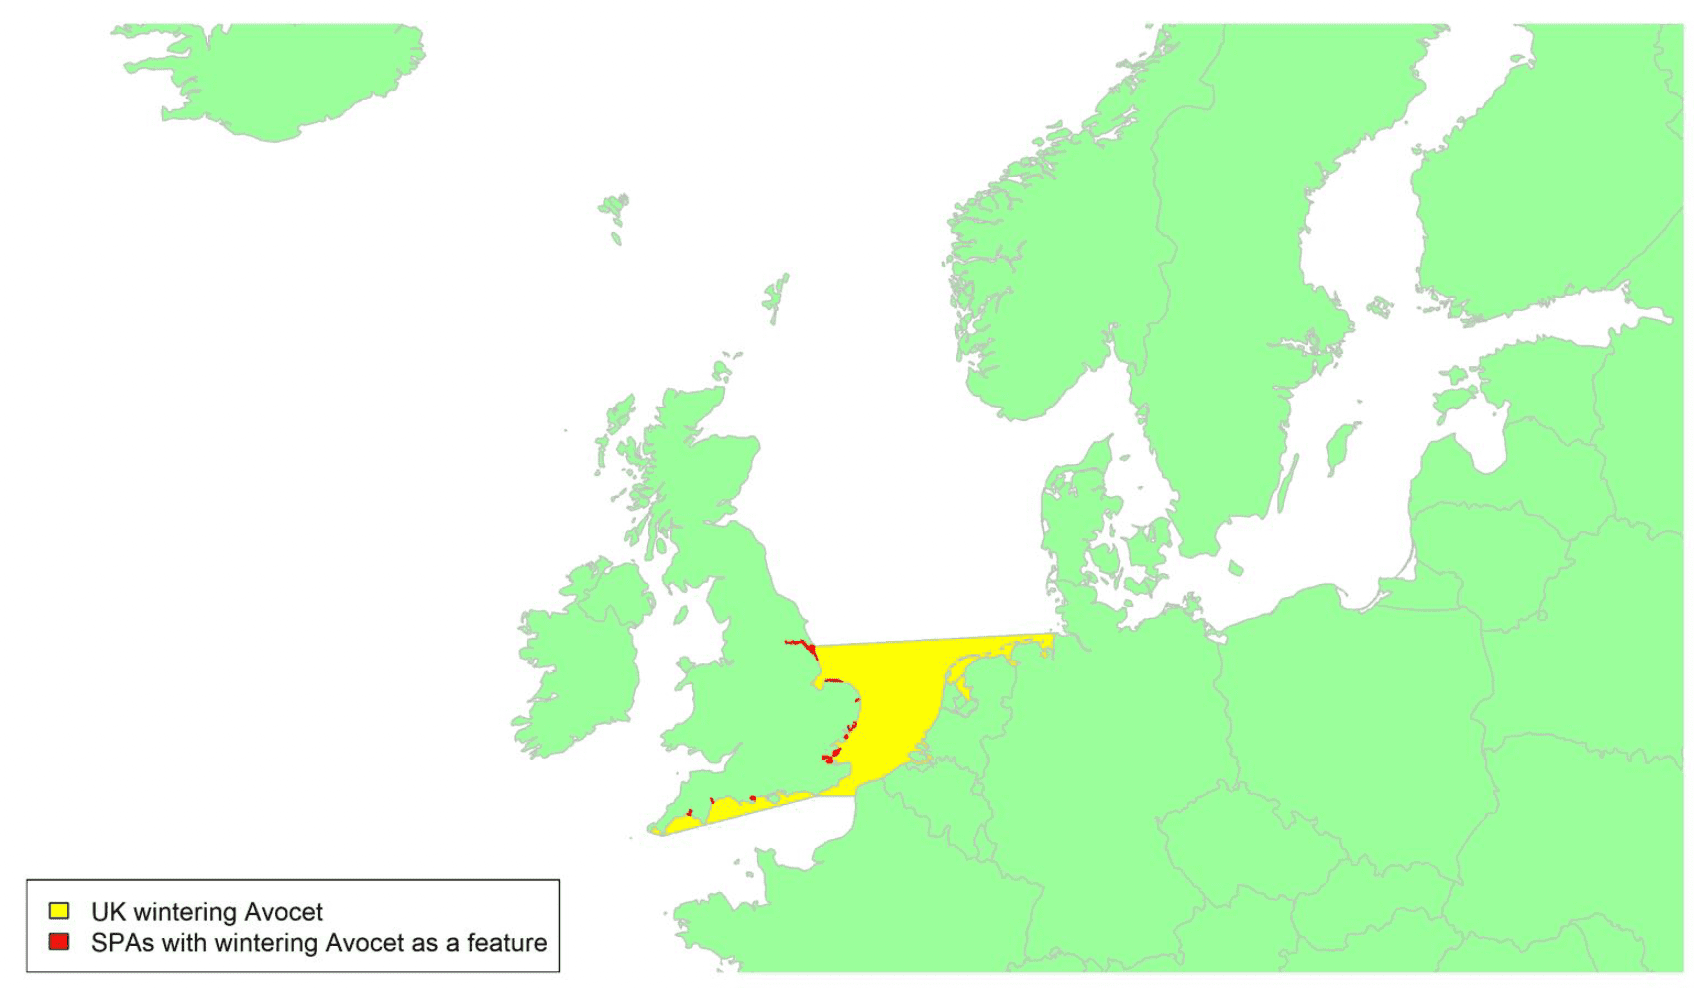
Migratory routes
Confidence: Low
The Avocet (sometimes also referred to as the Pied Avocet) can be found across central and southern Europe and in Africa. The breeding and wintering range of Avocet in the UK has expanded over recent years but remains largely concentrated in the east and southeast of England (Balmer et al. 2013, Eaton et al. 2020). Avocets are partial migrants with some UK breeding individuals migrating south to France, Iberia, or North Africa, and may cross the English Channel and the southernmost part of the North Sea as shown by the green shading on the breeding map. An unknown proportion of the population remains in the UK to winter alongside an influx of individuals from the continent (Chambon et al. 2018, 2019). These wintering birds are thought to mostly migrate across the southern part of the North Sea as shown by the yellow shading on the map of wintering birds Precise migration routes and timings are unknown, with no new studies on the migration of UK breeding or wintering Avocet since Wright et al. (2012). Around 12% of the biogeographic population could be potentially at risk of collision with wind turbines in UK waters (c. 9% of these are birds which breed on the continent and the remainder are UK breeding birds).
Timing of migration
Confidence: Low
From ringing recoveries, the key migration times for Avocet are from July to November for autumn migration and mid-March to mid-April for spring migration (Wernham et al. 2002). The pattern of BirdTrack reporting rates (see Appendix 2) for Avocet varies across regions. In general spring migration occurs between early February and late-April, and autumn migration between mid-June and early October. Maintained reporting rates through the summer likely involve breeding individuals, whilst the higher reporting rates in during winter and spring in south-west and southern England relate to wintering individuals. Avocets are still scarce in Ireland.
Flight heights
Confidence: Low
No data is available on flight heights of Avocet. In the absence of such data, it is recommended that a precautionary assumption of 100% of birds at collision risk height is used.
Flight speeds
Confidence: Low
No data are available on flight speeds of Avocet. In the absence of species-specific estimates, it is recommended that the same flight speed used for the Oystercatcher, the most closely related species covered in this review, of 13 m/s ± 2.5 is used for the purpose of collision risk modelling.
Avoidance rates and behaviour
Confidence: Low
No macro-, meso- or micro-avoidance rates have been reported for this species. A low macro-avoidance rate of 0.28 has been reported for waders as a group, based on the percentage of radar tracks entering offshore wind facilities (Krijgsveld et al. 2011). However, post-construction monitoring data collected from onshore windfarms where wader species were observed suggests that avoidance rates are likely to be high (Table 5). Drawing from these data, for the purposes of collision risk modelling, the recommended value for all wader species is 0.9996 ± 0.00002 (Table 5).
Lapwing Vanellus vanellus
SPA Species? |
Yes (non-breeding population) |
|---|---|
SPA site codes (Introduction, Table 2) |
11:30:38:54:59:62:63:73:78:123:195 |
Population size breeding (UK) |
97,500 pairs (APEP4, 2020); uncertainty: medium |
Population size non-breeding (UK) |
635,000 individuals (APEP4, 2020); uncertainty: medium |
Population size (Biogeographic flyway, SPA season) |
6,300,000 - 9,500,000 individuals (Europe); uncertainty: medium (Wetlands International, 2021) |
Percentage of biogeographic population at risk of collision in UK waters (passage / breeding / non-breeding) |
22%–41.5%; uncertainty: high |
Movement of wintering birds
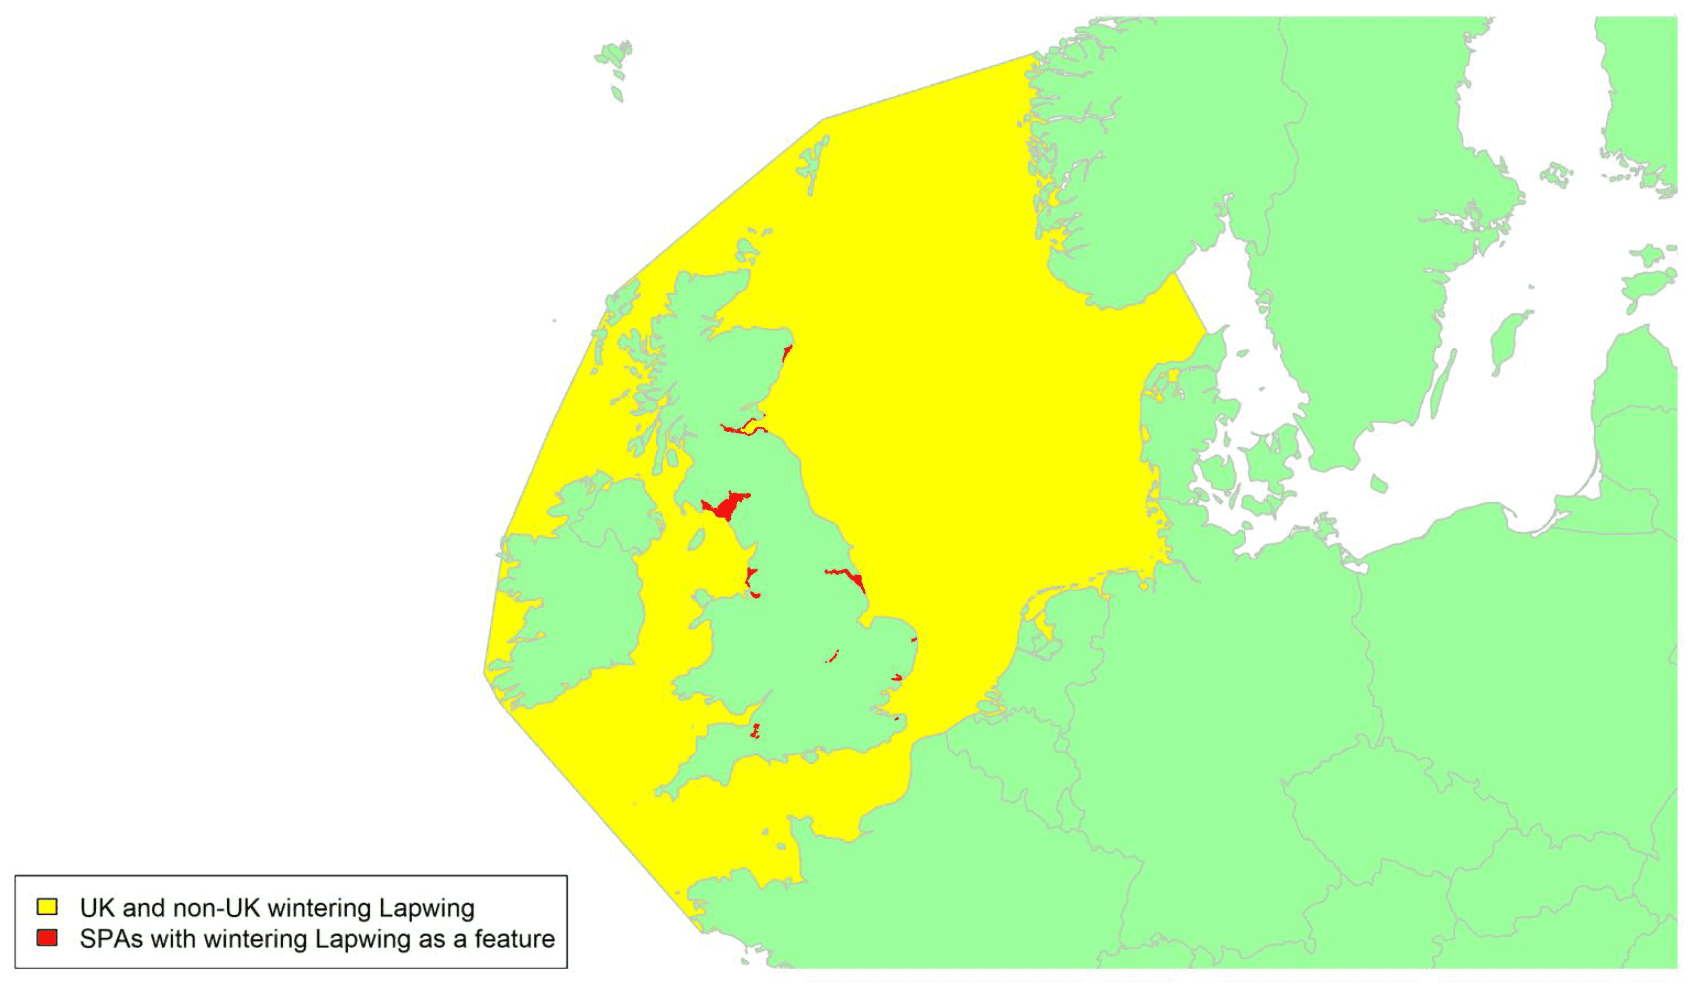
Migratory routes
Confidence: Low
Lapwing has a wide breeding distribution across the whole of Eurasia. There are some limited tracking data for this species, but movements can be irregular and hence difficult to interpret. Lapwings breed on open farmland and moorland in Britain and Ireland, and are partially migratory, with some wintering close to their breeding areas and others moving substantial distances (Wernham et al. 2002). Birds breeding in northern regions of Britain tend to move west to winter in Ireland, while birds from the south tend to move to coastal areas of western Europe (Wernham et al. 2002). British breeders wintering in Britain and Ireland are joined in winter by migrants from continental Europe, with numbers increasing throughout the autumn with the onset of frosts in continental Europe. Of eight Lapwing tagged with geolocators in the Netherlands, two migrated northwest to winter in Britain and Ireland, arriving in December and returning in February (Eichhorn et al. 2017). Early migrants undergo post-breeding moult in Britain, but most moult before arriving later in the year. During winter, bouts of cold weather can prompt further mass movements of Lapwing in Britain and Ireland to estuarine habitats where feeding is easier, as well as invasions of birds from the north and east (Wernham et al. 2002). A small number of British birds also undertake abmigration, joining birds heading north or east on spring migration, with recoveries during the breeding season from Iceland, Fennoscandia, and Russia. Ireland is under-represented in both numbers of Lapwing ringed and recoveries, and movements are still not well-understood (Wernham et al. 2002).
There is likely therefore to be substantial movement of wintering Lapwing across the North Sea, with some birds also crossing the Irish Sea and the Channel, as indicated by the yellow shading on the above map. However, there is still no specific information on routes taken and broad migratory corridors must be assumed. The proportion of the biogeographic population potentially at risk of collision with wind turbines in UK waters will depend on how many British breeding birds move to the continent over winter and may range from 22% of the biogeographic population (if all UK breeders remain in the UK) to 41.5% (if all UK breeders leave the UK and are replaced by continental birds in winter). The ringing recoveries detailed above confirm that the proportion at risk will be above the lower limit, but it remains unclear whether it will be towards the lower or higher end of the range. Note, however, that these estimates also assume that no additional passage Lapwing pass through Britain on route from the continent to winter in the Republic of Ireland.
Timing of migration
Confidence: Low
Migrant Lapwings begin to arrive in Britain and Ireland as early as May, but peak movements are between late September and early November (Wernham et al. 2002). In spring, British breeders are back on territory from February, and birds of continental origin return to breeding areas from March, with peak movements between March and May (Wernham et al. 2002).
The BirdTrack reporting rates (see Appendix 2) show very variable regional patterns across the UK and are hence difficult to interpret, as they can be influenced by a complicated combination of local movements from residents and by passage movements and cold weather movements by both British and continental breeding birds. Lapwing is largely a winter visitor only in the south-west of England (Balmer et al. 2013), and hence this region shows the clearest pattern with birds arriving from October to mid-November and departing in February. Decreased BirdTrack reporting rates on Scottish coasts indicates peak movements to wintering areas further west and south occur between late-October and early December, with corresponding increases in some English regions and in Wales and Northern Ireland at this time; these movements could possibly be linked with the onset of frosts. An increase in BirdTrack reporting rates from early February in Scotland and northeast and northwest England corresponds with decreased reporting rates in the three regions in south England and in Wales and Northern Ireland and may indicate the movement of UK breeders and passage migrants towards the north and east of the UK. Numbers peak in eastern England in mid-May and decline thereafter in this region and in Scotland and northeast and northwest England, perhaps reflecting the movements of continental breeders leaving the UK.
Flight heights
Confidence: Low
No flight heights have been recorded for this species. In the absence of such data, it is recommended that a precautionary assumption of 100% of flights at collision risk height is used.
Flight speeds
Confidence: Low
Two radar studies have recorded flight speeds of Lapwing. Mean airspeeds were found of 11.9 m-s (±2 SD) across 2 tracks in Europe (Bruderer and Boldt, 2001); and 12.8 m/s (± 1.3 SD) across 14 tracks in the Arctic and Sweden (Alerstam et al. 2007). Given the greater sample size of this second study, it is recommended that an estimate of 12.8 m/s ± 1.3 is used for the purposes of collision risk modelling.
Avoidance rates and behaviour
Confidence: Very Low
No macro-, meso- or micro-avoidance rates have been reported for this species. A low macro-avoidance rate of 0.28 has been reported for waders as a group, based on the percentage of radar tracks entering offshore wind facilities (Krijgsveld et al. 2011). However, post-construction monitoring data collected from onshore windfarms where wader species were observed suggests that avoidance rates are likely to be high (Table 5). Drawing from these data, for the purposes of collision risk modelling, the recommended value for all wader species is 0.9996 ± 0.00002 (Table 5).
Golden Plover Pluvialis apricaria
SPA Species? |
Yes (breeding and non-breeding populations) |
|---|---|
SPA site codes (Introduction, Table 2) |
11:21:30:33:34:38:41:45:46:50:54:59:60: 63:68:73:78:90:91:107:123:143:168 |
Population size breeding (UK) |
32,500 – 50,500 pairs (APEP4, 2020); uncertainty: medium |
Population size non-breeding (UK) |
410,000 individuals (APEP4, 2020); uncertainty: medium |
Population size (Biogeographic flyway, SPA season) |
110,000 - 170,000 individuals (P. a. apricaria breeding; Wetlands International 2021); uncertainty: medium 2,400,000 - 3,300,000 individuals (P. a. altifrons non-breeding); uncertainty: medium (Wetlands International, 2021) |
Percentage of biogeographic population at risk of collision in UK waters (passage / breeding / non-breeding) |
36%–78% (breeding); uncertainty: high <90%–95% (non-breeding); uncertainty: high |
Movement of breeding birds
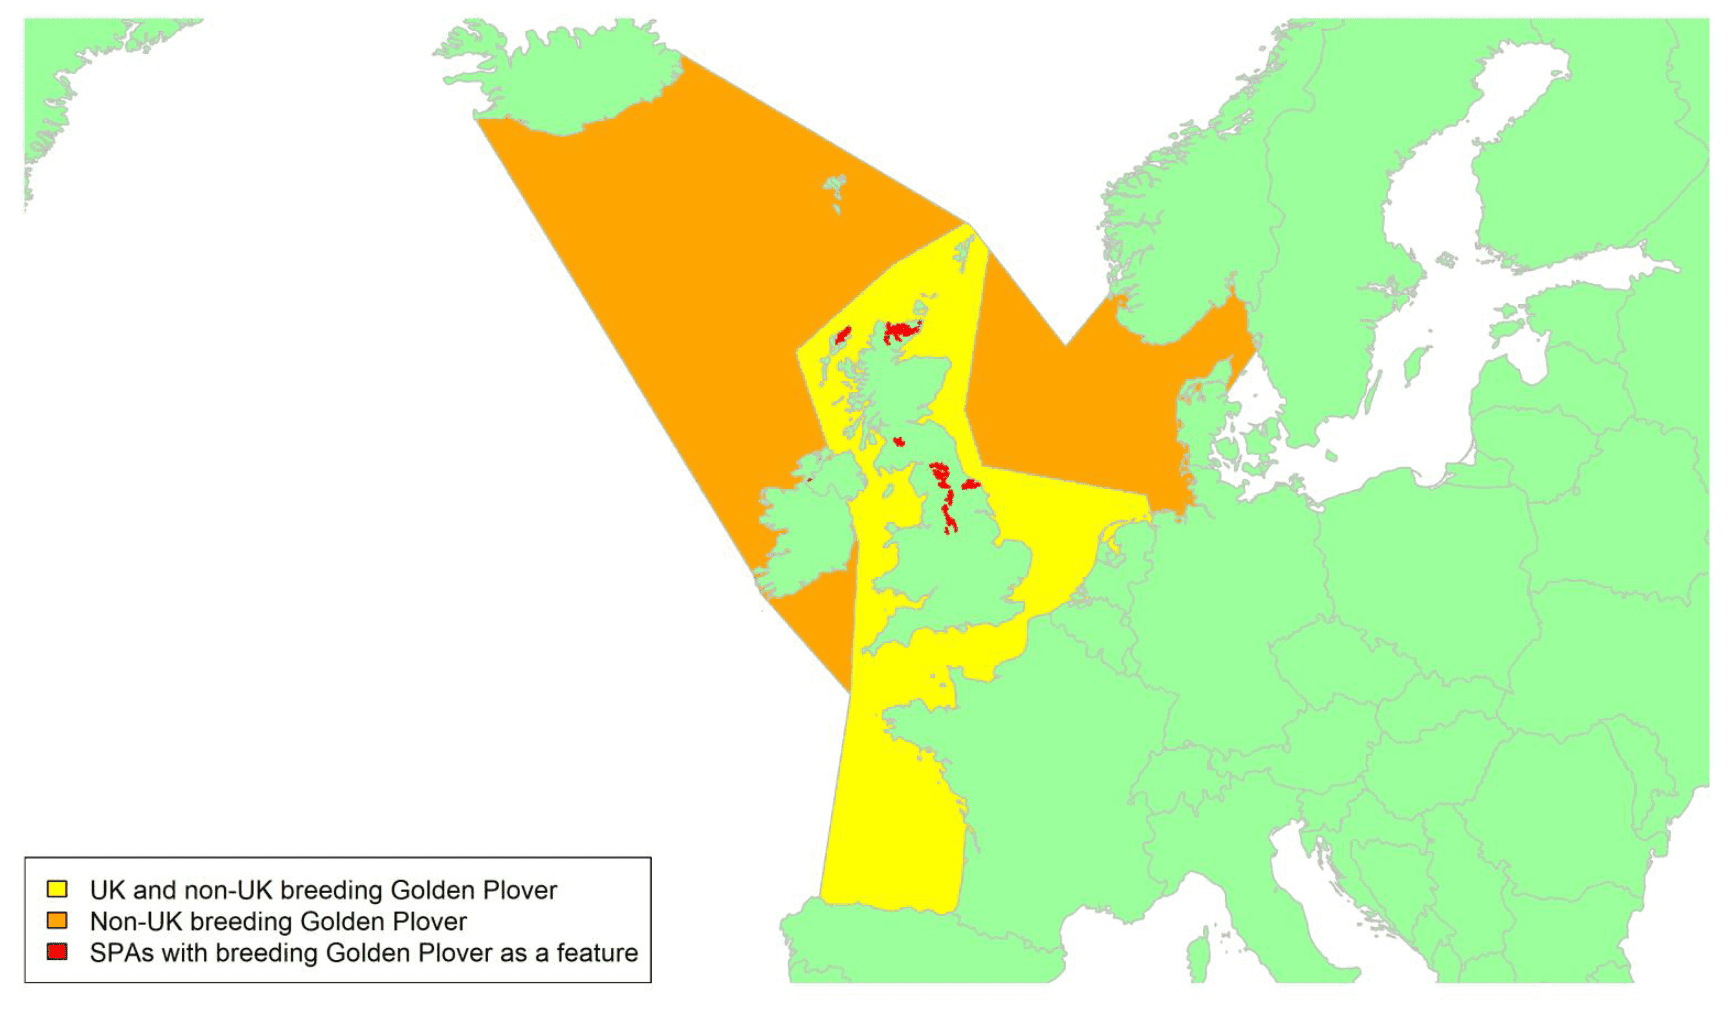
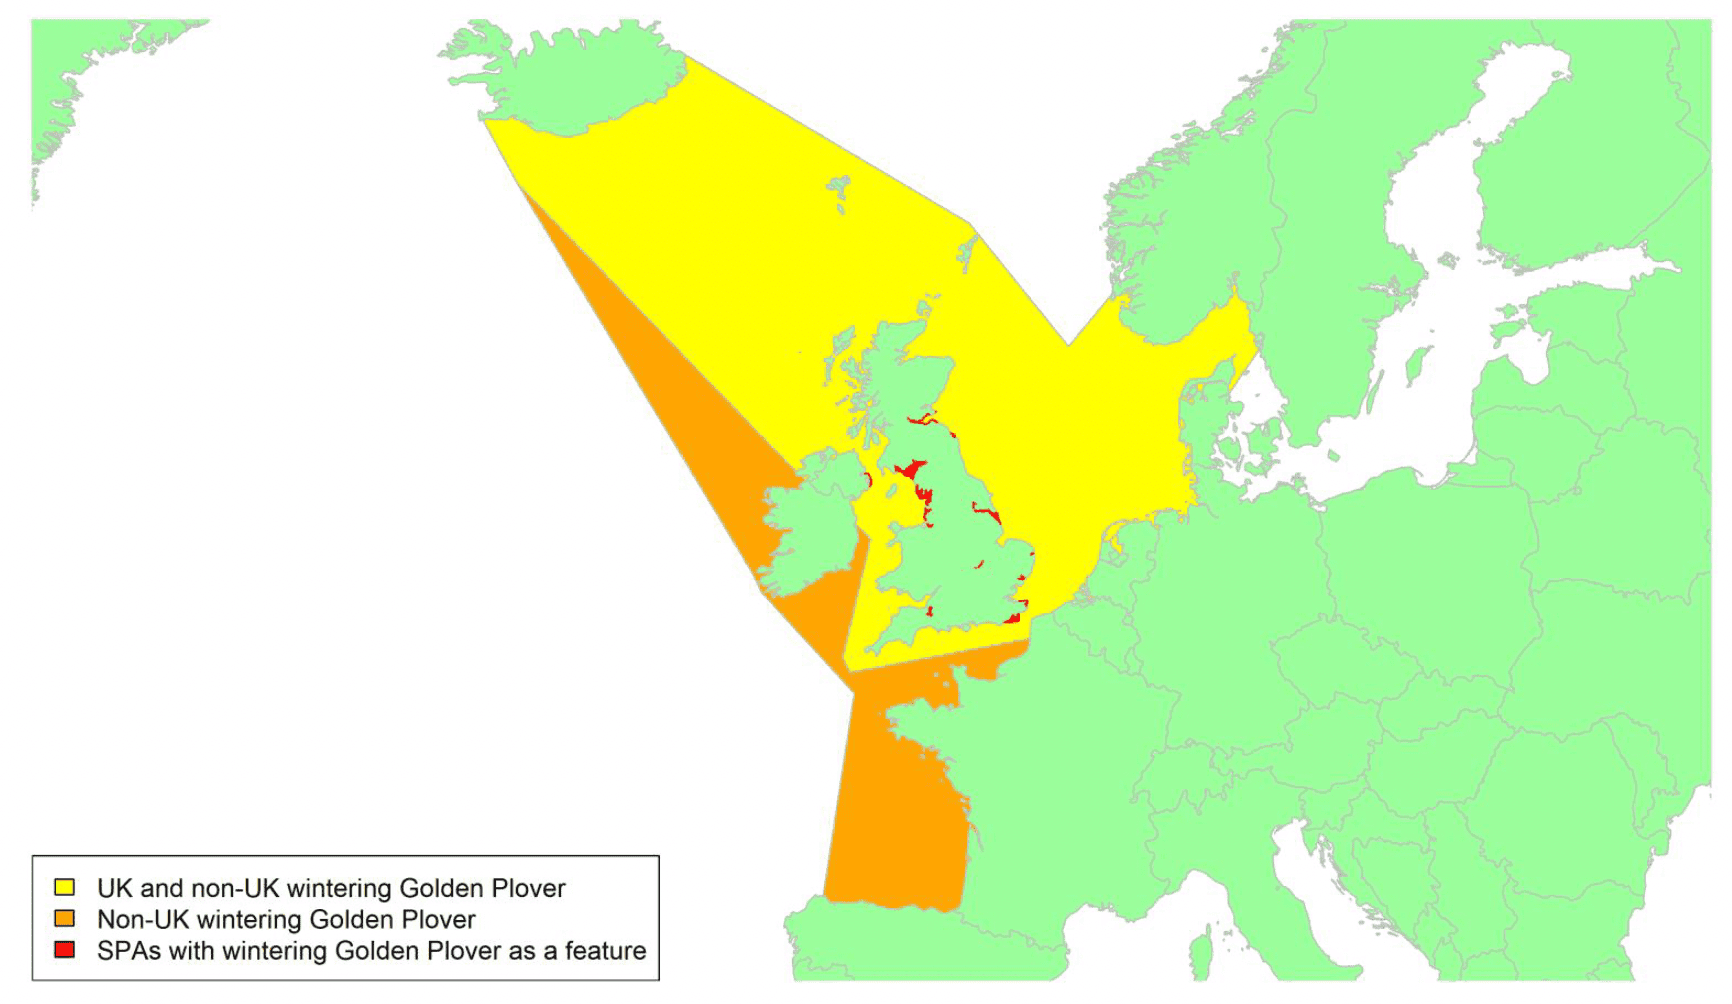
Migratory routes
Confidence: Low
The Golden Plover breeds from Greenland, Iceland, and the British Isles in the west, across Fennoscandia and northern Europe, to central Siberia in the east. Birds generally move south in autumn to winter across western and southern Europe, North Africa, and the Middle East. The British and Irish populations are partial migrants, with some birds remaining for the winter, joined by birds from more northerly breeding populations, and some moving long distances to south-west Europe or north Africa, or east to the Wadden Sea (Wernham et al. 2002). Most Scottish breeders move short distances in winter to coastal areas, though some birds move south (Forrester et al. 2007). Birds from more northerly populations will also pass-through Britain and Ireland on passage to wintering grounds further south. Winter and passage migrants found in Ireland are mainly Icelandic breeders P. a. altifrons, while in Britain Icelandic breeders are mixed with British and Scandinavian breeders P. a. apricaria, with the Icelandic birds mainly found in the western parts of the country (Wernham et al. 2002; Machín et al. 2015). Large movements of birds in response to severe cold weather have also been noted in Britain and Ireland, but little is known about either the scale or frequency of these movements. In spring, birds wintering in northwest Africa and the Iberian Peninsula pass through Britain and Ireland, the Netherlands and Belgium on their way back to breeding grounds in Fennoscandia and Iceland (Wernham et al. 2002). However, our understanding of these migratory movements is limited.
High numbers of Icelandic breeders are likely to travel between Iceland and Ireland and the west coast of the UK, and passage migrants from Scandinavia are likely to make movements across the North Sea, as indicated respectively by the yellow shading on the above wintering map. British breeders could make movements across the North Sea and the Channel, as indicated on the breeding map.
The proportion of the biogeographic population potentially at risk of collision with wind turbines in UK waters is highly uncertain. The breeding estimate of 36% to 78% being potentially at risk makes the assumption that all Fennoscandian breeders will move to Europe whilst all UK breeders remain in the UK, although, in reality, some European birds will winter on the continent and some UK breeders will cross to France and Ireland. However, given the wide range for the estimate due to uncertainties about the population, it is likely that the proportion of birds at risk falls somewhere within the range given. The proportion of non-breeding birds at risk is also uncertain but is likely to be high as much of the population of P. a. albifrons will pass through UK waters. However, it is likely that the proportion is lower than the estimate of 90% to 95% of birds being potentially at risk, as an unknown proportion of albifons will pass through the Republic of Ireland and hence may bypass UK waters.
Timing of migration
Confidence: Medium
Most Golden Plover breeding in Britain and Ireland are back on breeding territories by late February, at least during mild winters (Ratcliffe, 1976; Wernham et al. 2002). Birds in the southernmost wintering grounds in northwest Africa begin spring migration in mid-February, with numbers peaking in Britain and Ireland in April and May where birds stop before onwards movement north. The double peak seen in increased BirdTrack reporting rates (see Appendix 2) in spring around the Scottish coast likely reflects the arrival of first Scottish migrants to breeding territories, and then northern migrants. Outside Scotland and northern England, the species is mainly a winter visitor passage migrant, and the BirdTrack data reflect this with reporting rates declining in most regions between February and May. Autumn migration begins as soon as the chicks have left the nest, from late June, with concentrations of birds building at coastal sites during August and September (Wernham et al. 2002). A sharp increase in BirdTrack reporting rates indicates peak passage across Scottish coasts from late July until late September. Peak passage in most English regions also commences in late July, but the data suggest that migration in Wales, Northern Ireland and south-west England may start slightly later (from late August).
Flight heights
Confidence: Low
There is no available data on flight heights of Golden Plover. In the absence of data, it is recommended that a precautionary assumption of 100% of birds at collision risk height is used.
Flight speeds
Confidence: Low
There is no available data on flight speeds of Golden Plover. In the absence of such data, it is recommended that the estimate of 16.5 m/s (SD 1.8) obtained for Grey Plover, as the most closely related species covered in this review, is used for the purposes of collision risk modelling.
Avoidance rates and behaviour
Confidence: Very Low
No macro-, meso- or micro-avoidance rates have been reported for this species. A low macro-avoidance rate of 0.28 has been reported for waders as a group, based on the percentage of radar tracks entering offshore wind facilities (Krijgsveld et al. 2011). However, post-construction monitoring data collected from onshore windfarms where wader species were observed suggests that avoidance rates are likely to be high (Table 5). Drawing from these data, for the purposes of collision risk modelling, the recommended value for all wader species is 0.9996 ± 0.00002 (Table 5).
Grey Plover Pluvialis squatarola
SPA Species? |
Yes (non-breeding population) |
|---|---|
SPA site codes (Introduction, Table 2) |
7:8:15:19:23:24:25:27:30:33:37:38:39:41:54:63: 67:69:70:78:80:123:124:205 |
Population size breeding (UK) |
n/a |
Population size non-breeding (UK) |
33,500 (APEP4, 2020); uncertainty: low |
Population size (Biogeographic flyway, SPA season) |
200,000 (W Siberia/W Europe); uncertainty: low (Wetlands International, 2021) |
Percentage of biogeographic population at risk of collision in UK waters (passage / breeding / non-breeding) |
62% (16.8%–c.100%) (non-breeding); uncertainty: high |
Movement of wintering birds
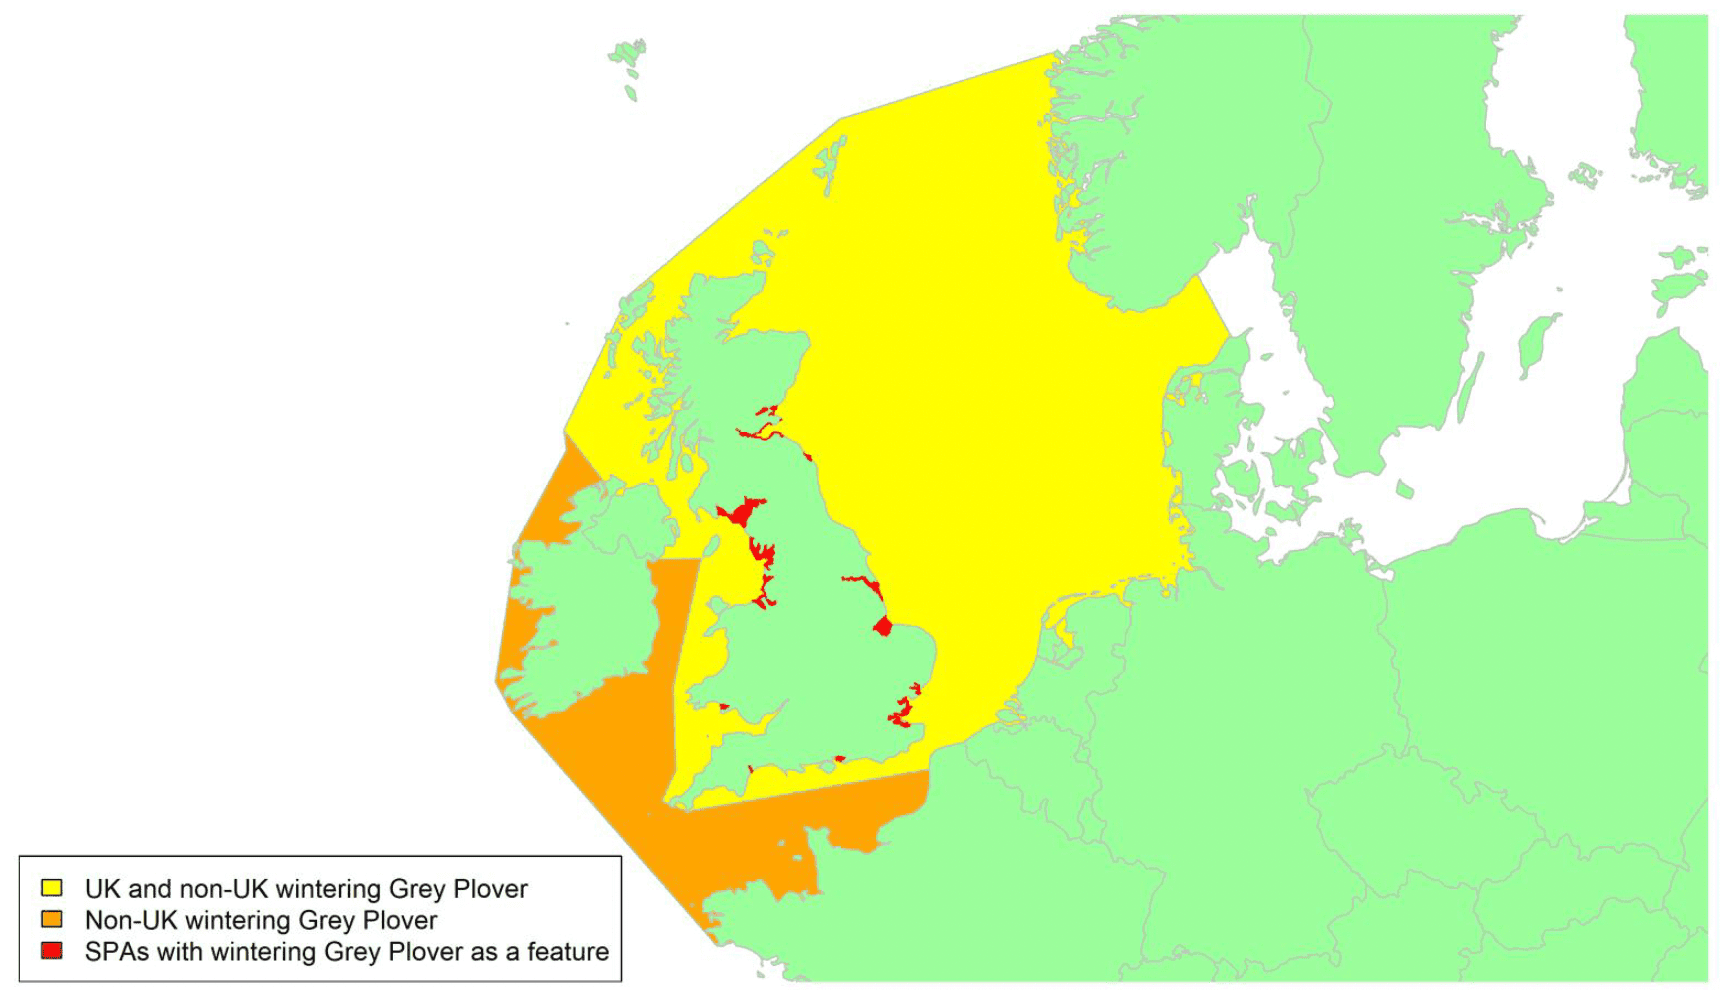
Migratory routes
Confidence: Medium
Grey Plover breed across the high arctic of Russia and North America and are long-distance migrants with a wide wintering range extending to Africa, Asia, Australasia, and South America. The most northerly wintering areas in the world are found in Britain and Ireland and nearby continental Europe. Passage migrants also stop in Britain and Ireland on their way further south to southwest Europe and western Africa, and some immatures can be found over-summering (Wernham et al. 2002). Grey Plover found in Britain and Ireland are from the populations breeding in western Russia, and therefore are likely to cross various parts of the North Sea to reach wintering and stopover sites in the UK. Some birds may make further winter movements, particularly across the southern North Sea between the east of England and Denmark and the Netherlands, and movements in response to cold weather have also been documented (Wernham et al. 2002). Wintering Grey Plover in the UK are mostly found on larger estuaries with intertidal mudflats and sandflats (Frost et al. 2021). In Scotland, they are mostly found in the south and east, as well as the Solway Firth, and passage movements are predominantly on the east coast (Forrester et al. 2007). Of 11 Grey Plover migrations recorded by GPS tags from birds staging in the Wadden Sea, six included stopovers in Britain (Exo et al. 2019). Three birds stopped during the autumn passage and three birds during the spring passage, making movements across most parts of the North Sea. Three birds wintered in northwest Ireland, crossing the North Sea, Britain and the Irish Sea en route (Exo et al. 2019).
There is likely therefore to be substantial movement of Grey Plover wintering and staging in the UK across the North Sea, as indicated by the yellow shading on the above map, as well as movement across the Irish Sea and the Channel by birds wintering in Ireland. Consequently, the proportion of the biogeographic population potentially at risk of collision with wind turbines in UK waters will be substantially higher than the 16.8% of the population that winters in the UK. Whilst, theoretically, it could include the whole population, this is unlikely as an unknown proportion of passage birds will not visit Britain. However, the tracking and ringing data suggest that a large proportion of the biogeographic population could cross UK waters during passage. The estimate of 62% of the population potentially at risk is based on the tracking study mentioned above (Exo et al. 2019) but is highly uncertain due to the low sample size in this study, hence the range of 16.8% to 100% is also given.
Timing of migration
Confidence: Medium
There is a strong early autumn migration in August and September, largely of adults moving to important moult areas in the southeast North Sea and southern England (Forrester et al. 2007). Juveniles follow in September and October. An increase in BirdTrack reporting rates (see Appendix 2) on Scottish coasts and in most English regions indicates peak movements between mid-July and the end of September. Peak movements occur at a similar time in most English regions, although the start of passage is slightly later in south-west England and in Wales, occurring from late August. Wernham et al. (2002) state that passage migrants then move south to wintering areas in October and November, and this is supported by a decrease in reporting rates in late autumn and early winter in some regional plots. In spring, Grey Plover begin moving northwards to breeding grounds in early March, though some individuals remain in the UK until May. Birds wintering in northwest Africa depart in mid-April and continue along the western European coast before staging in the southeast North Sea. This is reflected by increased BirdTrack reporting rates around UK coasts between early March and mid-May in some regions, most notably in eastern England. However, fewer birds are seen on passage during the spring migration than in autumn (Forrester et al. 2007).
Flight heights
Confidence: Low
Whilst data have been collected describing the altitude of Grey Plover migrating over land (Green, 2004), no such data have been collected in relation to migratory movements over sea. In the absence of data from migratory movements over sea, it is recommended that a precautionary estimate of 100% of birds at collision risk height is used for the purposes of collision risk modelling.
Flight speeds
Confidence: Medium
Several studies have recorded flight speeds for Grey Plover, using various methods. A radar study recorded mean airspeeds of 17.9 m-s across 14 tracks (± 3.9 SD; Alerstam et al. 2007); theodolite measurements of 8 birds flying over the Baltic in autumn recorded mean airspeeds of 16.5 m-s (± 1.8 SD; Pennycuick et al. 2013); and observations of 11 birds departing from Mauritania on spring migration found mean airspeeds of 12.1 m-s (± 3 SD) while in climbing flight (Piersma et al. 1997). A study using PTT tags recorded mean groundspeeds of 18.3 m-s in spring (N = 7, 6 birds), and 14.3 m-s in autumn (N = 9, 7 birds; Exo et al. 2019).
Reflecting these data, it is recommended that a speed of 16.5 m/s ± 1.8, known to reflect birds during a migration period, is used for the purposes of collision risk modelling.
Avoidance rates and behaviour
Confidence: Very Low
No macro-, meso- or micro-avoidance rates have been reported for this species. A low macro-avoidance rate of 0.28 has been reported for waders as a group, based on the percentage of radar tracks entering offshore wind facilities (Krijgsveld et al. 2011). However, post-construction monitoring data collected from onshore windfarms where wader species were observed suggests that avoidance rates are likely to be high (Table 5). Drawing from these data, for the purposes of collision risk modelling, the recommended value for all wader species is 0.9996 ± 0.00002 (Table 5).
Ringed Plover Charadrius hiaticula
SPA Species? |
Yes (breeding and non-breeding populations) |
|---|---|
SPA site codes (Introduction, Table 2) |
7:8:15:16:24:27:30:33:37:38:41:54:58:63: 67:69:78:90:123:172:176:185:187 |
Population size breeding (UK) |
5,450 (5,250 – 5,600) pairs; APEP4, 2020); uncertainty: low |
Population size non-breeding (UK) |
42,500 individuals (APEP4, 2020); uncertainty: low |
Population size (Biogeographic flyway, SPA season) |
50,000 – 68,000 individuals (hiaticula, breeding and wintering); uncertainty: medium 240,000 individuals (psammodromus, passage); uncertainty: medium (Wetlands International, 2021) |
Percentage of biogeographic population at risk of collision in UK waters (passage / breeding / non-breeding) |
17%–24% (breeding/wintering hiaticula); uncertainty: high <94% (passage psammodromus); uncertainty: high |
Movement of breeding birds
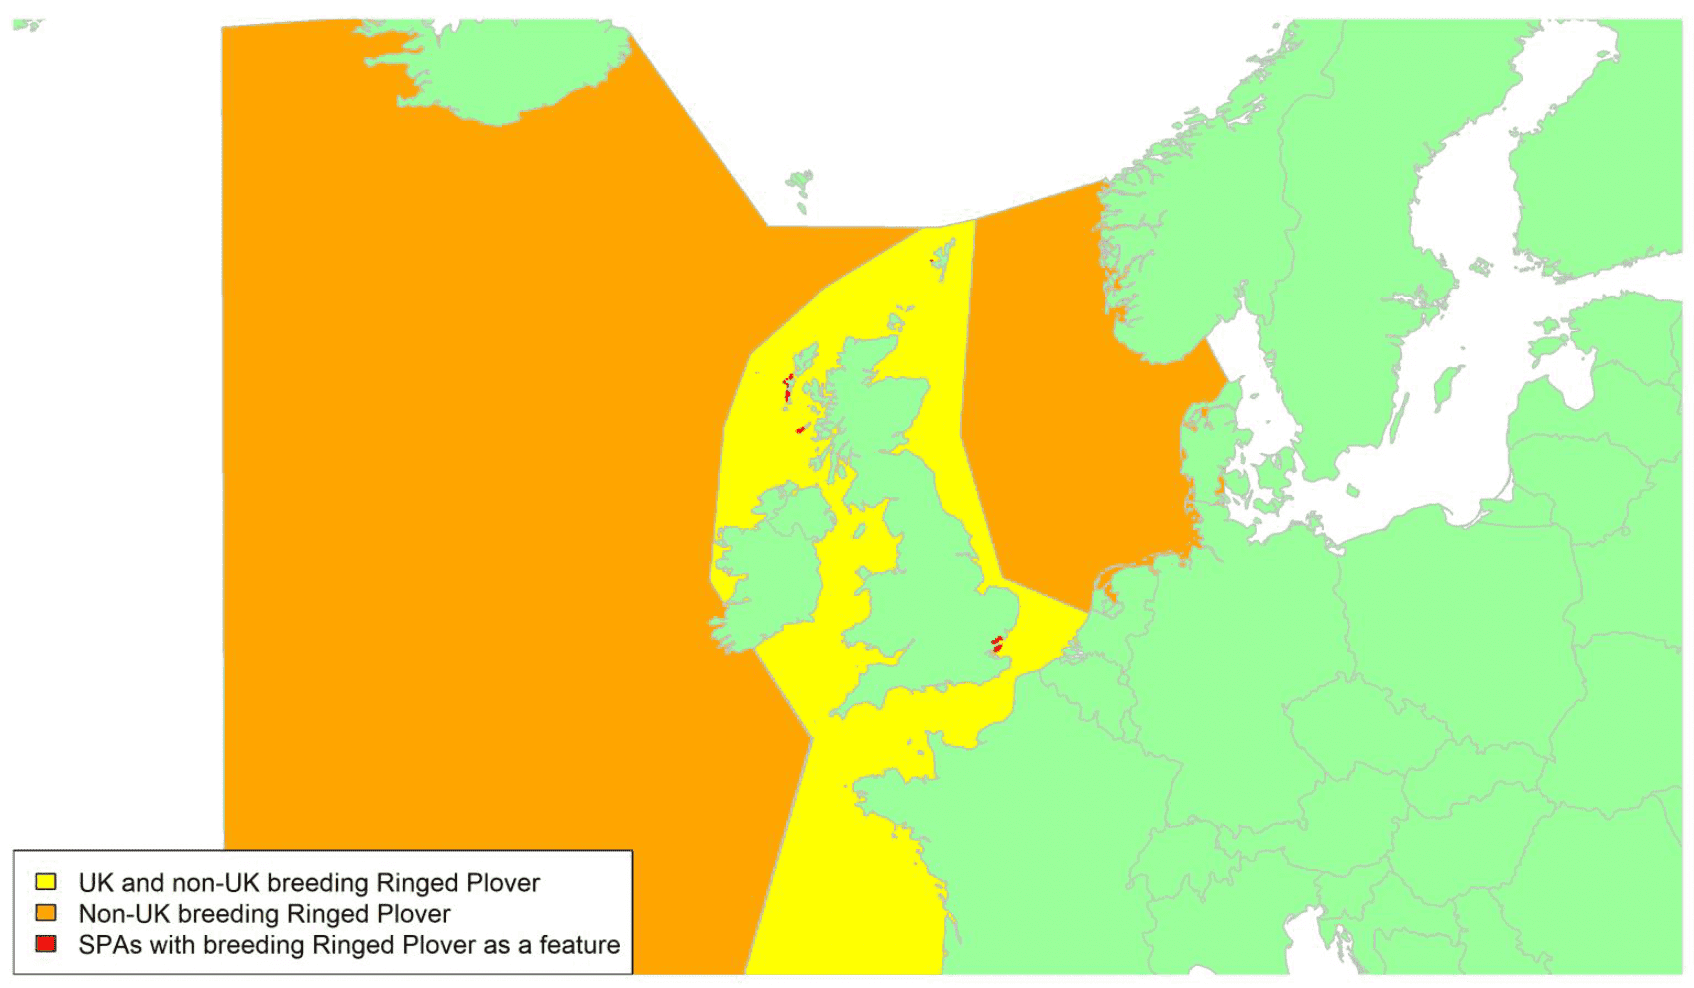
Movement of wintering birds
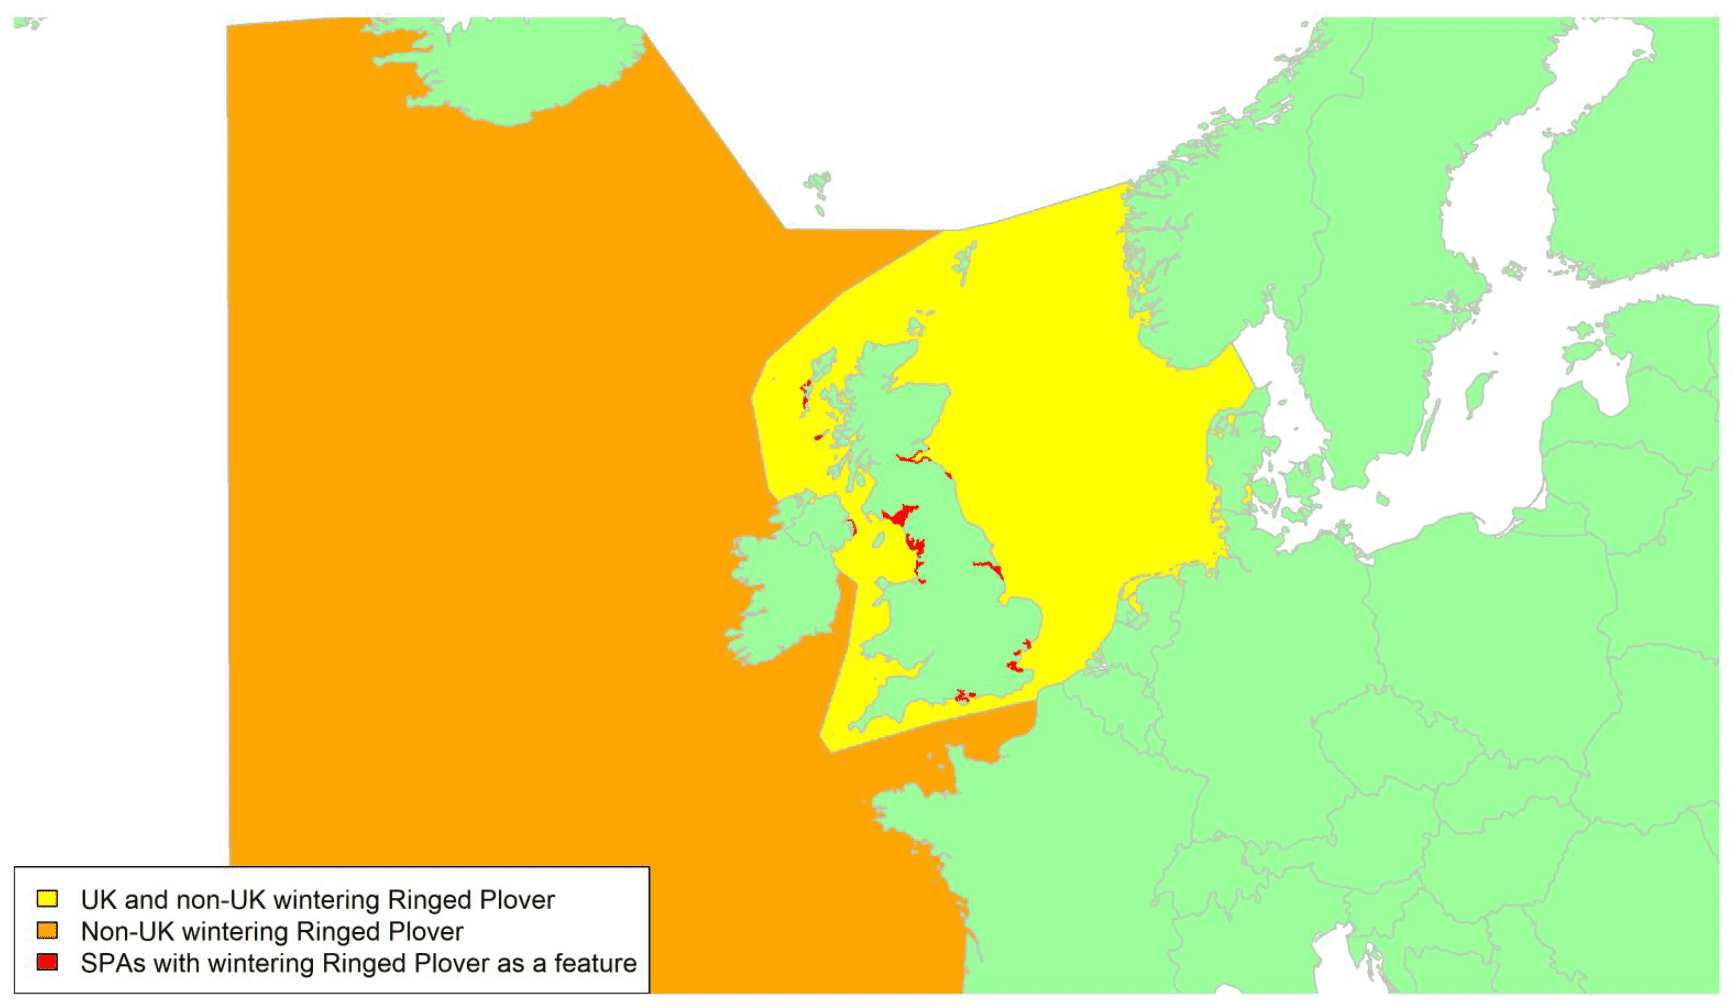
Migratory routes
Confidence: Medium
The Ringed Plover is widely distributed across arctic, subarctic, and temperate regions. Britain and Ireland are extremely important both for breeding and wintering populations and as a stopover site for birds on passage. The nominate C. h. hiaticula occurs across northern and western Europe, and mainly winters in western Europe and the Iberian Peninsula. Breeding birds are widely distributed around the coasts of Britain and Ireland, but particularly in Scotland which supports nearly two-thirds of UK breeding pairs (Conway et al. 2019). The subspecies C. h. psammodromus breeds in Iceland, Greenland and Canada and winters in western and southern Africa. A third subspecies, C. h. tundrae, breeds on arctic tundra across northern Fennoscandia and Russia, and migrates south to winter in eastern and southern Africa or west Asia (Wernham et al. 2002) but can be found on the east coast of Britain on passage.
Non-breeding Ringed Plover occur all around the British and Irish coastline in winter, with resident birds joined by birds from different breeding populations at different times of year. Post-breeding movements of British and Irish birds away from breeding sites are not well understood. Birds tend to winter locally or move short distances only (Forrester et al. 2007), though some cross the Irish Sea or the Channel to winter in France and Ireland, as shown by the yellow shading on the breeding map above. Movements can be highly variable between individuals from the same breeding site, with birds potentially moving north, south, or cross-country (Wernham et al. 2002). British and Irish birds wintering around the UK coast are joined by high numbers of passage migrants from breeding populations in Greenland, Canada, Iceland, and Fennoscandia, which pass through Britain and Ireland (particularly the coasts around the Irish Sea) on their way to winter in Spain and West Africa (Wernham et al. 2002). Autumn passage occurs on both the east and west coasts of Britain, indicating that birds will make crossings of the North Sea as well as the Irish Sea. Of 17 birds tagged with geolocators in the Canadian high-Arctic, all but one stopped in the northern part of the British Isles during the spring migration (Léandri-Breton et al. 2019). During the autumn migration some birds flew directly from Greenland to south-west Europe, but 10 of 20 birds stopped in the British Isles, largely in Ireland and Scotland (Léandri‐Breton et al. 2019). A map showing the tracks from this study is included in Appendix 1.
There is likely therefore to be substantial movement of passage migrants and wintering individuals throughout all UK waters, with movements also likely across the North Sea, the Irish Sea, and the Channel. Birds wintering in the UK are more likely to come from northern Europe, as indicated by the yellow shading on the wintering map.
The biogeographic flyway population estimates given above include only C. h. hiaticula and C. h. psammodromus as it is unclear how many birds from C. h. tundrae use the flyway given that most of the population winters in Asia and east Africa. Around 17% to 24% of C. h. hiaticula are estimated to be potentially at risk of collision with wind turbines in UK waters. The proportion of the biogeographic population of C. h. psammodromus potentially at risk of collision in UK waters is difficult to estimate but could be close to 100% if the vast majority of C. h. psammodromus pass through the UK, as suggested by the geolocators. The estimate of 94% given in the summary above is based on the findings of the geolocator study (Léandri‐Breton et al. 2019); however, this is highly uncertain as birds from other parts of the breeding range will not necessarily follow the same migration route.
Timing of migration
Confidence: C. h. hiaticula: Low; C. h. psammodromus: Medium
Migratory movements of the Ringed Plover are protracted throughout spring, with passage migrants from various wintering sites stopping in Britain and Ireland throughout February to May on their way to breeding sites. British and Irish birds are on territory from February, but birds wintering further south and breeding in Iceland and Fennoscandia will only reach breeding grounds in May, and those in Greenland and Canada not until June (Wernham et al. 2002; Léandri‐Breton et al. 2019). The BirdTrack graphs (see Appendix 2) show a lack of clear migration windows in spring in Scotland, with variable patterns across different regions. This is most likely caused by the movements of resident birds, as around two-thirds of the British breeding population nest in Scotland (Conway et al. 2019). However, major movements as indicated by all Scottish coastal regions combined show peak migration between mid-April and mid-May. This timing matches the clearer spring passage movement shown by the BirdTrack graphs for eastern, northeast and northwest England, and for Wales. In these regions the vast majority of records will involve Arctic or sub-arctic migrants moving through the UK. Failed Scottish breeders leave breeding territories from early June, with all birds departing by late July (Forrester et al. 2007). Autumn passage occurs from August, with all twenty birds tagged with geolocators in the Canadian Arctic leaving breeding grounds in the first two weeks of August (Léandri‐Breton et al. 2019). Peak movements as inferred from BirdTrack reporting rates occur between early August and late September and peak in late August, reflecting movements from more northerly birds passing through on their way south.
Flight heights
Confidence: Low
There is no available data on flight heights of Ringed Plover. In the absence of such data, it is recommended that a precautionary assumption of 100% of birds at collision risk height is used.
Flight speeds
Confidence: Low
Three studies have reported flight speeds of Ringed Plover, but with very small sample sizes. Two radar studies, based on one track each at an unspecified time of year, found mean airspeeds of 19.5 m/s in southern Sweden and the Arctic, and 10.6 m/s and Europe, the Mediterranean and Israel (Alerstam et al. 2007; Bruderer and Boldt, 2001). One study based on theodolite measurements found mean airspeeds of 16.0 m/s (± 1.1 SD) across four runs of Ringed Plover migrating along the east coast of Sweden in the autumn (Pennycuick et al. 2013). Given the greater sample size of the Pennycuick et al. (2013) study, it is recommended that a flight speed of 16.0 m/s ± 1.1 is used for the purposes of collision risk modelling.
Avoidance rates and behaviour
Confidence: Very Low
No macro-, meso- or micro-avoidance rates have been reported for this species. A low macro-avoidance rate of 0.28 has been reported for waders as a group, based on the percentage of radar tracks entering offshore wind facilities (Krijgsveld et al. 2011). However, post-construction monitoring data collected from onshore windfarms where wader species were observed suggests that avoidance rates are likely to be high (Table 5). Drawing from these data, for the purposes of collision risk modelling, the recommended value for all wader species is 0.9996 ± 0.00002 (Table 5).
Dotterel Charadrius morinellus
SPA Species? |
Yes (breeding population) |
|---|---|
SPA site codes (Introduction, Table 2) |
100:101:102:105:106:113:117:161 |
Population size breeding (UK) |
425 pairs (APEP4, 2020); uncertainty: low |
Population size non-breeding (UK) |
0 |
Population size (Biogeographic flyway, SPA season) |
32,000 - 65,000 individuals (Europe, breeding); uncertainty: medium (Wetlands International, 2021) |
Percentage of biogeographic population at risk of collision in UK waters (passage / breeding / non-breeding) |
0.6%; uncertainty: high |
Movement of breeding birds
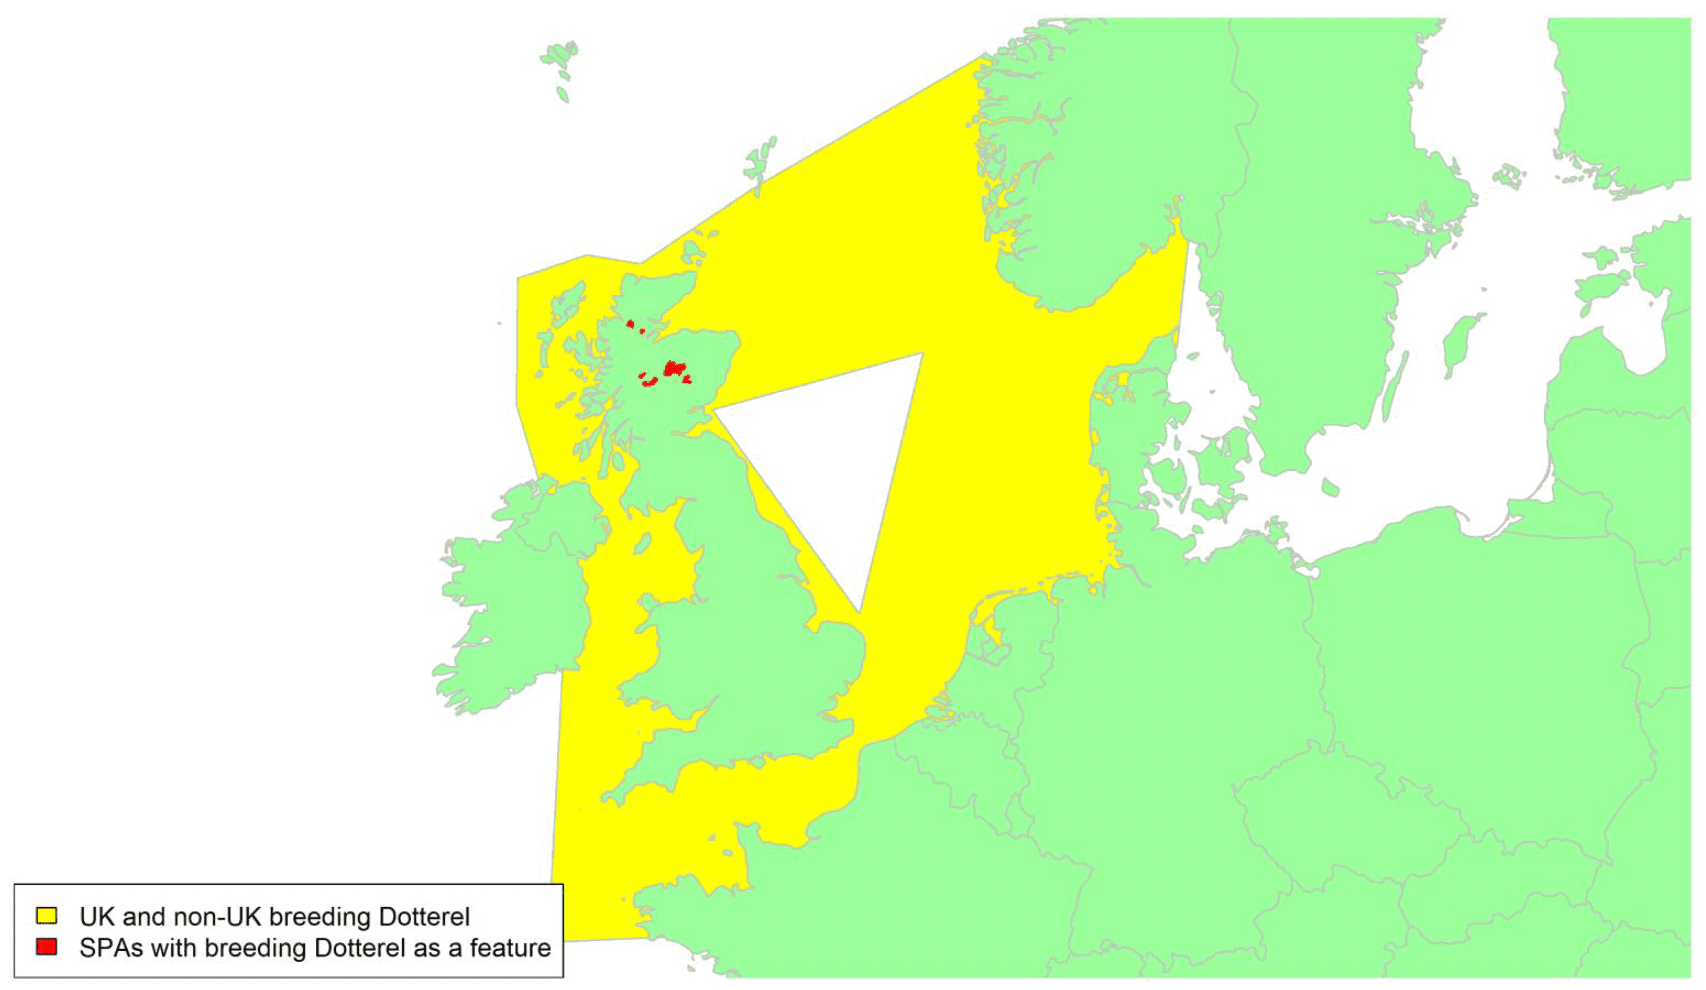
Migratory routes
Confidence: Low
Dotterel breed throughout much of the Palearctic with the UK being at the western limit of their breeding range. In the UK, declines in the abundance and distribution of Dotterel mean that they are now restricted to breeding northern Scotland (Hayhow et al. 2015). Both male and female Dotterel can move between Scottish and Norwegian breeding grounds during the breeding season (May-July), with small numbers of individuals presumably crossing the northern North Sea at this time (Wernham et al. 2002).
Individuals disperse around the Scottish Highlands prior to migrating southwards to their wintering grounds in Morocco, possibly via the south-west of the country. Although there is a reasonably good high-level knowledge of migration patterns of this species, details of the routes Dotterel take across UK waters, the times at which sea crossings occur and the numbers of birds involved, are not known, with no new studies on the migration of Dotterel breeding in the UK since Wright et al. (2012). In the absence of more precise information, the yellow shaded area on the map above assumes that most Dotterel will take a direct route to or from their breeding and wintering areas, or between the Scottish and Norwegian breeding grounds. This seems likely based on the fact that relatively few Dotterels are observed at stopover sites during migration.
The proportion of the biogeographic population which could potentially be at risk of collision with wind turbines in UK waters is likely to be small and perhaps less than 1%, although this is uncertain as it assumes a limited exchange between Scotland and Norway and does not take into account the unknown number of birds that might cross the North Sea from Norway and other Scandinavian countries en route to and from their wintering grounds. Further understanding of precise migration routes and movements within the breeding season are therefore needed.
Timing of migration
Confidence: Low
Spring passage of Dotterel across Western Europe occurs between mid-April and late May on a broad overland front (Wernham et al. 2002; Whitfield et al. 1996) with most individuals arriving at Scottish breeding grounds in early May. Autumn migration of Dotterel out of the UK is thought to occur in September and October. Based on BirdTrack reporting rates of Dotterel across the UK (see Appendix 2), there is a pulse of spring migration between mid-April and mid-June. In autumn, there is a smaller pulse of migration between late August and mid-October in England and Wales, and a later, small pulse between early and late November in some regions of Scotland (Moray and the northeast).
Flight heights
Confidence: Low
No data is available on flight heights of Dotterel. In the absence of such data, it is recommended that a precautionary assumption of 100% of birds at collision risk height is used.
Flight speeds
Confidence: Low
No data are available on flight speeds of Dotterel. In the absence of species-specific estimates, it is recommended that the same flight speed used for the Grey Plover, as the most closely related species covered in this review, of 16.5 m/s ± 1.8 is used for the purpose of collision risk modelling.
Avoidance rates and behaviour
Confidence: Very Low
No macro-, meso- or micro-avoidance rates have been reported for this species. A low macro-avoidance rate of 0.28 has been reported for waders as a group, based on the percentage of radar tracks entering offshore wind facilities (Krijgsveld et al. 2011). However, post-construction monitoring data collected from onshore windfarms where wader species were observed suggests that avoidance rates are likely to be high (Table 5). Drawing from these data, for the purposes of collision risk modelling, the recommended value for all wader species is 0.9996 ± 0.00002 (Table 5).
Whimbrel Numenius phaeopus
SPA Species? |
Yes (breeding and non-breeding populations) |
|---|---|
SPA site codes (Introduction, Table 2) |
30:54:122 |
Population size breeding (UK) |
310 pairs (APEP4, 2020); uncertainty: low |
Population size non-breeding (UK) |
41 individuals (APEP4, 2020); uncertainty: low >3,840 individuals (spring passage); uncertainty: high |
Population size (Biogeographic flyway, SPA season) |
770,000 – 780,000 individuals (islandicus, Iceland, Faeroes, Scotland breeding). 240,000 – 390,000 individuals (phaeopus, N Europe breeding); uncertainty: high (Wetlands International, 2021) |
Percentage of biogeographic population at risk of collision in UK waters (passage / breeding / non-breeding) |
>0.2% of islandicus (breeding); uncertainty: high <80% (islandicus, spring passage only), Unknown (phaeopus, spring and autumn passage); uncertainty: high |
Movement of breeding birds
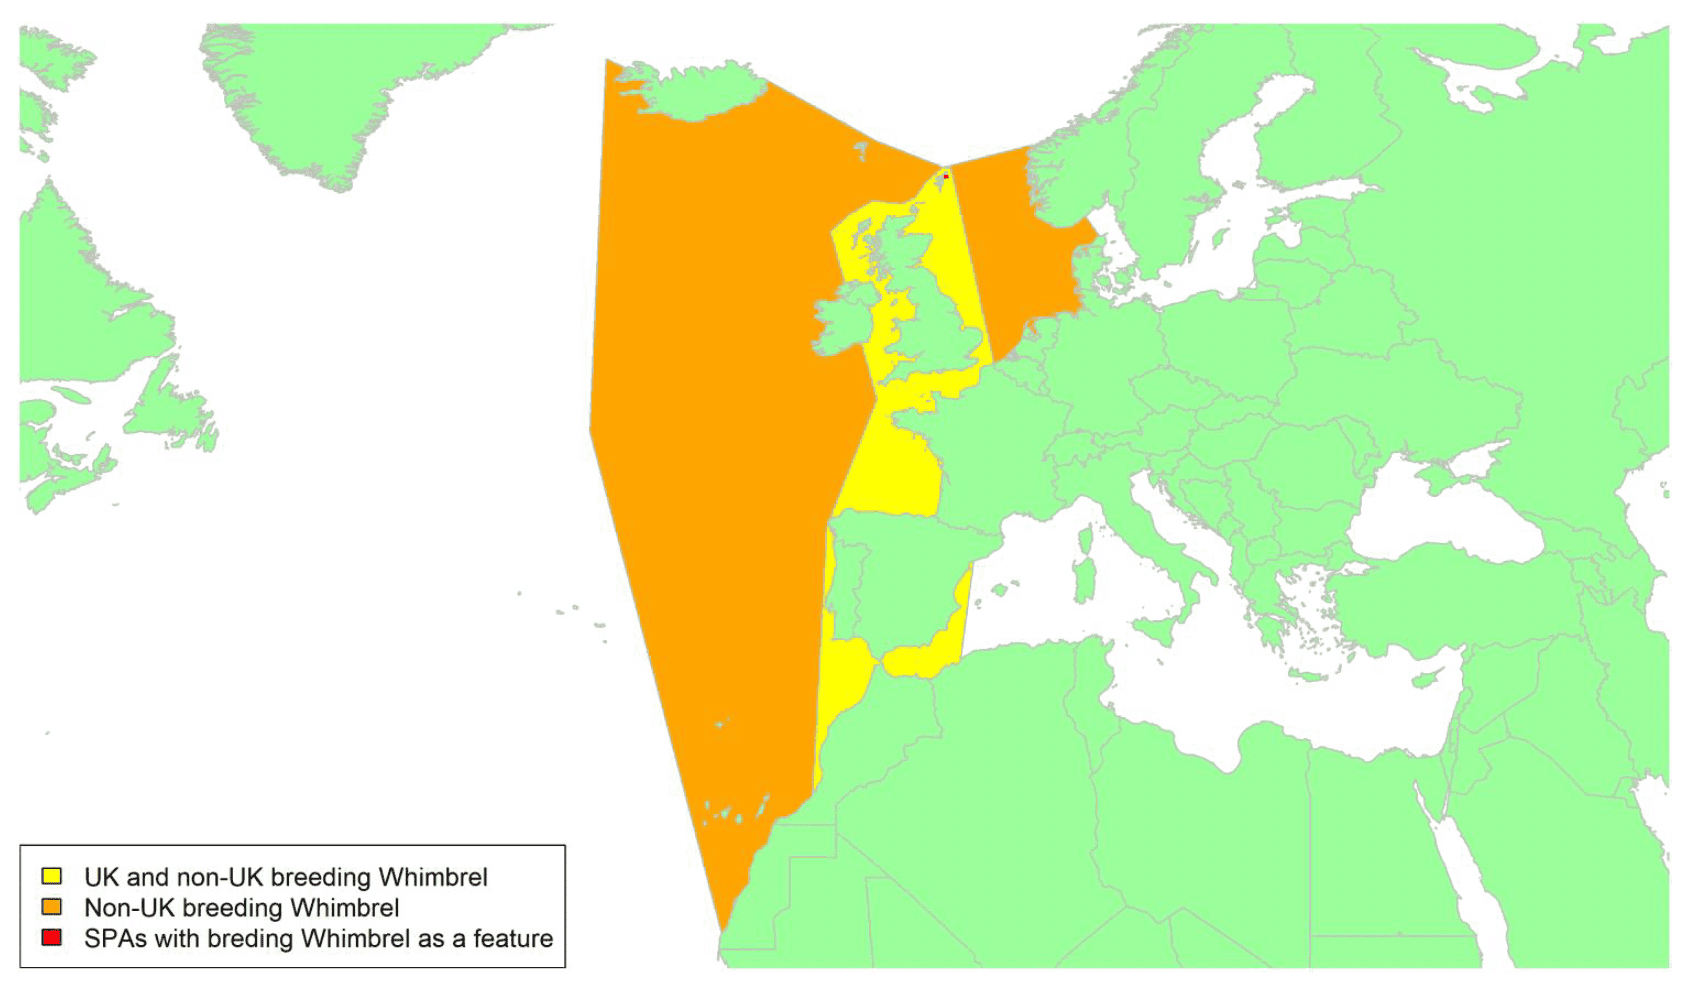
Migratory routes
Confidence: Medium
Whimbrel has a very restricted breeding distribution in the UK, with the majority of the population breeding in Shetland and very small numbers on Orkney and the Outer Hebrides / Na h-Eileanan Siar. Much larger numbers occur on passage migration, particularly in spring, but also in autumn, when they can be found on all coasts of the UK and Ireland (Wernham et al. 2002). Passage individuals breed in Iceland, Scandinavia and Russia and winter in West Africa, therefore their migration routes take them across most parts of UK waters. Based on GPS tracked individuals from Iceland (N. p. islandicus), individuals migrate non-stop south in autumn to West Africa, passing through western UK waters. During their spring migration, most individuals stopover along their route north, including in western Britain and Ireland (Alves et al. 2016; Carneiro et al. 2019; Gunnarsson & Guðmundsson, 2016).
There have been no new studies on Scottish breeding or UK passage Whimbrel since Wright et al. (2012). The largest concentrations of Whimbrel generally occur on the major UK estuaries with five-year mean peak counts of more than two hundred during the 2015/16 to 2019/20 winters on the Ribble Estuary, in Morecambe Bay and on the Severn Estuary (Frost et al. 2021). The biggest recent counts have come from Barnacre Reservoir and Grizedale Lea near Preston where roost counts are carried out and a peak of 780 were counted in 2018/19 (Lancashire Bird Report; Frost et al. 2021). However, Whimbrel are recorded all around the UK coasts and a broad front migration across UK waters must be assumed until better data are available to demonstrate otherwise. UK breeding birds are most likely to arrive in the UK from the south, as shown by the yellow shaded area on the above map, with passage birds crossing both the yellow and orange shaded areas.
The proportion of the biogeographic population that could be potentially at risk of collision with wind turbines in UK waters is difficult to estimate. Although the UK breeding birds represent less than 1%, the estimate for the number of passage birds that are potentially at risk is extremely uncertain and the recent tracking work mentioned above suggests that a substantial proportion of the Icelandic population might be at risk during spring migration but not during autumn migration. The estimate that less than 80% of the population of Icelandic birds could potentially be at risk given the above is based on the fact that 21 out of 26 Whimbrel tracked using geolocators staged in western Europe during spring (Carneiro et al. 2016) and hence could potentially cross UK waters. However, this estimate is highly uncertain, and it is based on a very small sample, and most of the tracked birds stopped in the Republic of Ireland some of which may not cross UK waters. The proportion potentially at risk could therefore be substantially less than 80% and further tracking work to understand migration routes would therefore be valuable.
Timing of migration
Confidence: Medium
Whimbrel breeding in Iceland start their autumn migration to West Africa between the end of July and August, with individuals returning to Iceland between the end of April and mid-May (Alves et al. 2016; Carneiro et al. 2019; Gunnarsson & Guðmundsson, 2016). Based on the BirdTrack reporting rates of Whimbrel (see Appendix 2), there is a pulse of spring migration between the mid-April and mid-June, followed by an autumn pulse towards the end of June to early October, with this pattern being observed across the UK. These timings fit well with the arrival and departure times of Whimbrel in Iceland (Gunnarsson & Guðmundsson, 2016). A higher reporting rate in spring compared to autumn can be seen in many regions, particularly across Scotland.
Whimbrel from Iceland to West Africa migrate non-stop over the sea for several days during the autumn, migrating day and night (Alves et al. 2016), therefore migration is likely to occur both during the day and at night.
Flight heights
Confidence: Low
Estimates of Whimbrel flight heights during spring and autumn migration are only available from one study, using GPS data, for the Central Asian and the East Asian‑Australasian Flyways (Li et al. 2020). During Trans-Himalayan flight, mean flight height was 977 ± SD 102 m (four individuals), whilst along the East Asian flyway the mean flight height was 316 ± 56 m (six individuals). However, these mean values include flight heights over land and sea.
Whilst Whimbrel migration may take place at significant altitudes, these mostly appear to occur over land. Where migration takes place over sea, altitudes appear to be lower, and potentially within the rotor sweep of offshore wind turbines. Reflecting this uncertainty, it is recommended that it is assumed 100% of flights potentially take place at collision risk height.
Flight speeds
Confidence: Medium
Based on data from geolocators on Whimbrel migrating between Iceland and west Africa, flight speeds ranged from 5.36 – 24.18 m/s during autumn migration and 2.19 – 21.29 m/s during spring migration (four individuals, Alves et al. 2016). Based on a larger samples size of individuals, Carneiro et al. (2019) reported a mean flight speed of 16.50 ± SE 5.99 m/s during autumn migration, and 13.07 ± SE 5.82 m/s during spring migration (19 individuals).
Two studies provided data on Whimbrel flight speeds based on estimates of multiple individuals from PTT satellite transmitters. The first involved 121 estimates from five Whimbrel migrating between Russia and Southeast Asia, which reported a mean flight speed of 15.3 ± SD 4.3 m/s (range 5.9 – 25.9; Li et al. 2020). The second involved 97 flight segments recorded during migration along the Western Atlantic Flyway, providing a mean flight speed of 13.8 ± SE 0.4 m/s (Watts et al. 2020).
Whilst there is low confidence surrounding estimates of flight speed, those based on PTT data are likely to be more robust than those based on geolocator data. Reflecting data collected from the Western Atlantic Flyway, it is recommended that a value of 13.8 ± SE 0.4 m/s is used for collision risk modelling.
Avoidance rates and behaviour
Confidence: Very Low
No macro-, meso- or micro-avoidance rates have been reported for this species. A low macro-avoidance rate of 0.28 has been reported for waders as a group, based on the percentage of radar tracks entering offshore wind facilities (Krijgsveld et al. 2011). However, post-construction monitoring data collected from onshore windfarms where wader species were observed suggests that avoidance rates are likely to be high (Table 5). Drawing from these data, for the purposes of collision risk modelling, the recommended value for all wader species is 0.9996 ± 0.00002 (Table 5).
Curlew Numenius arquata
SPA Species? |
Yes (non-breeding population and one concentration) |
|---|---|
SPA site codes (Introduction, Table 2) |
15:30:37:38:41:54:63:69:70:78:80:114:116: 123:135:205:210 |
Population size breeding (UK) |
58,500 pairs (APEP4, 2020); uncertainty: medium |
Population size non-breeding (UK) |
125,000 individuals (APEP4, 2020); uncertainty: high |
Population size (Biogeographic flyway, SPA season) |
610,000 – 830,000 individuals (wintering); uncertainty: high (Wetlands International, 2021) |
Percentage of biogeographic population at risk of collision in UK waters (passage / breeding / non-breeding) |
>17%; uncertainty: high |
Movement of wintering birds
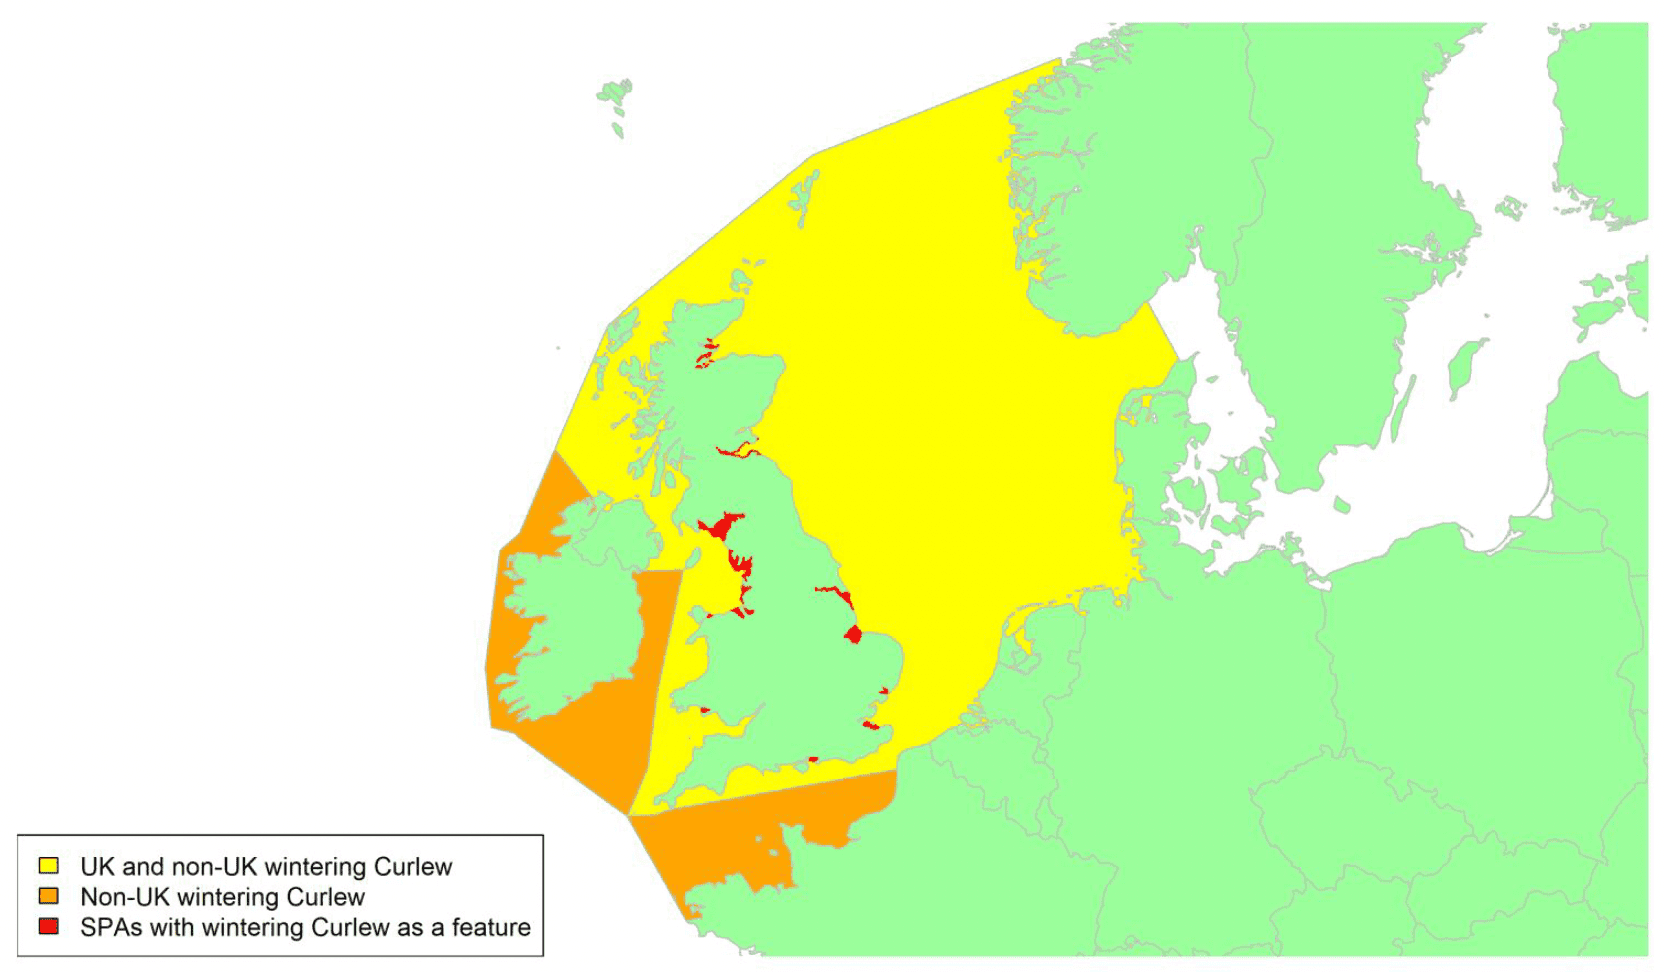
Migratory routes
Confidence: Low
The Curlew has a wide breeding distribution across Eurasia. The UK breeding population of Curlew has declined dramatically since Wright et al. (2012). Large numbers of Curlew migrate across the North Sea and Irish Sea, with much smaller numbers crossing the English Channel (Wernham et al. 2002). Ringing recoveries have shown that Curlews wintering in the Moray Forth largely originate from northern Scotland or Fennoscandia. Satellite transmitter data from a single Curlew caught in Bunchrew Bay, west of Inverness, revealed a spring migration route northwest across the North Sea to Norway before heading west to breed in Finland, and returning to Scotland via the southern tip of Norway in the autumn (Dennis et al. 2011). It is not clear whether migration occurs on a broad front across the North and Irish Seas, or whether it is concentrated in particular areas. In the absence of more precise information, a broad front should be assumed, with UK wintering birds arriving across the North Sea, as shown by the yellow area on the above map, and passage birds will then continue on to Ireland or across the English Channel and hence will also cross the orange areas on the map.
At least 17% of the biogeographic population of Curlew are estimated to be potentially at risk of collision with wind turbines in UK waters. This estimate does not include the unknown numbers of birds which cross UK waters on passage but do not remain during the winter.
Timing of migration
Confidence: Medium
Autumn migration occurs from late June to October, with individuals returning early thought to be failed-breeders or females (Bainbridge & Minton, 1978). UK breeding individuals return on spring migration between late January and March. Spring migration is later for foreign-breeding Curlews that winter in the UK, especially for those that breed in Fennoscandia, with individuals leaving between March and May (Sanders & Rees, 2018; Wernham et al. 2002). This is also reflected in the BirdTrack reporting rates (see Appendix 2), which shows that peak spring migration is in March with reporting rates dropping until the end of May across the UK. Reporting rates increase again from mid-June to mid-August indicating that autumn migration occurs at this time. The exceptions are the north coast of Scotland and Orkney where the pattern of reporting rates is more complex, with no steep drop during the summer potentially due to the presence of breeding individuals.
Curlews generally depart for migration during the evening or early night-time indicating migration at night however, they do also migrate during the day (Scotland, Dennis et al. 2011; Wadden Sea, Schwemmer et al. 2021).
Flight heights
Confidence: Low
Whilst estimates are available for the flight heights of birds migrating over land (Schwemmer et al. 2021), no data are available for Curlew migrating over the sea. In the absence of data collected from the offshore environment, it is considered precautionary to assume that 100% of migratory flights take place within the collision risk window.
Flight speeds
Confidence: Medium
Flight speeds of Curlew have been estimated from four studies, two using GPS and two using radar. Flight speeds ranged between 12.7 and 22.7 m/s based on four GPS tracked individuals during their autumn and spring migration between the Wadden Sea and western Russia (Schwemmer et al. 2016). A larger sample of migrating individuals along this route, over six years, recorded a mean flight speed of 20.4 ± 5.1 m/s (range 11.6 – 32.1; 42 tracks) at the start of spring migration, and 15.4 ± 3.3 m/s (range 11.3 – 23.3; 33 tracks) at the start of autumn migration (Schwemmer et al. 2021).
Based on radar data from 16 Curlew tracks in the Arctic/south Sweden, an estimated mean airspeed of 16.3 ± 2.3 SD m/s was reported (flapping flight only, Alerstam et al. 2007). The second radar study involved just two Curlew tracks, giving a mean airspeed of 13.2 ± 1.2 m/s (Bruderer & Boldt, 2001).
Given the sample sizes of the studies reviewed, it is recommended that the data presented in Schwemmer et al. (2021) are used for the purposes of collision risk modelling. As a lower flight speed will result in a higher probability of a bird colliding (Masden et al. 2021), it is recommended that the estimate obtained for the autumn migration, of 15.4 m/s (SD 3.3) is used as a precautionary value.
Avoidance rates and behaviour
Confidence: Very low
No macro-, meso- or micro-avoidance rates have been reported for this species. A low macro-avoidance rate of 0.28 has been reported for waders as a group, based on the percentage of radar tracks entering offshore wind facilities (Krijgsveld et al. 2011). However, post-construction monitoring data collected from onshore windfarms where wader species were observed suggests that avoidance rates are likely to be high (Table 5). Drawing from these data, for the purposes of collision risk modelling, the recommended value for all wader species is 0.9996 ± 0.00002 (Table 5).
Bar-tailed Godwit Limosa lapponica
SPA Species? |
Yes (non-breeding population) |
|---|---|
SPA site codes (Introduction, Table 2) |
15:24:25:30:33:39:41:54:70:78:80: 83:88:114:116:118:123:124:166 |
Population size breeding (UK) |
n/a |
Population size non-breeding (UK) |
53,500 (APEP4, 2020); uncertainty: low |
Population size (Biogeographic flyway, SPA season) |
150,000 - 180,000 individuals (lapponica, wintering); 500,000 individuals (taymyrensis, passage); uncertainty: low (Wetlands International, 2021) |
Percentage of biogeographic population at risk of collision in UK waters (passage / breeding / non-breeding) |
35.7%–c.100% lapponica (wintering); uncertainty: high >100% taymyrensis (passage); uncertainty: high |
A) Movement of UK wintering birds
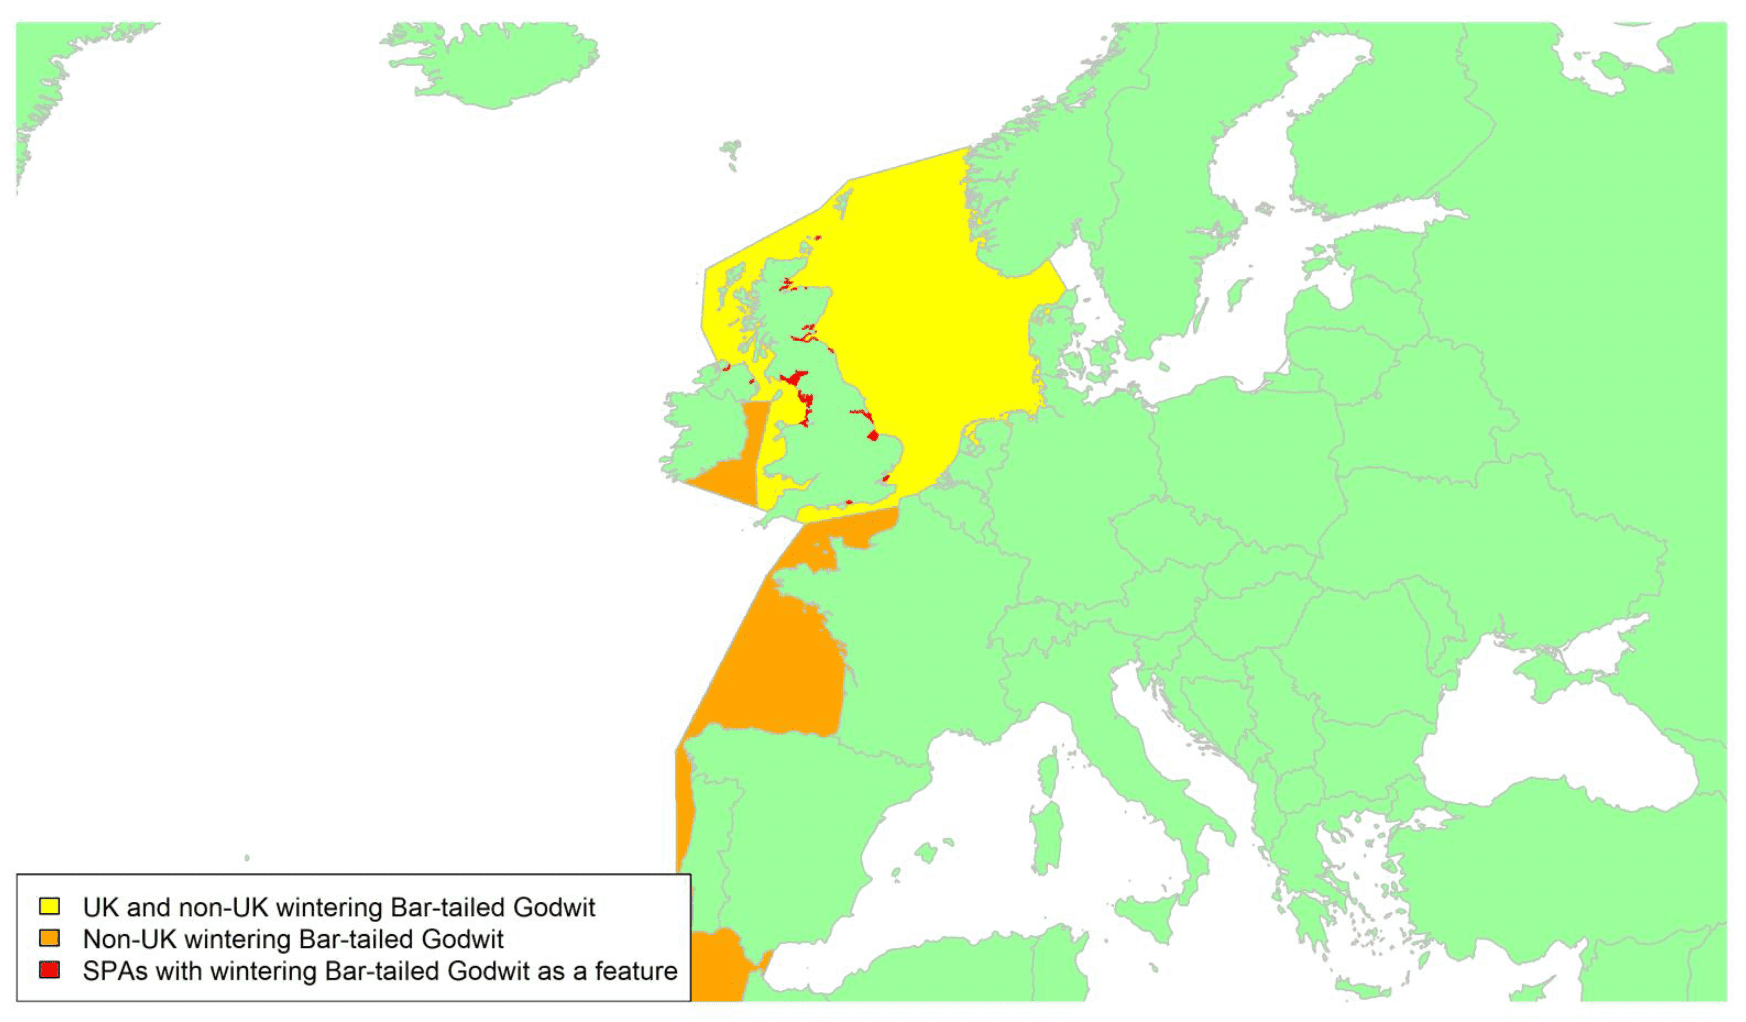
Migratory routes
Confidence: Medium
Bar-tailed Godwits breed in a number of distinct areas across the Arctic tundra, and different populations have different migratory strategies. Two sub-species can be found in Britain and Ireland, which hosts internationally important wintering, moulting and staging populations (Atkinson, 1996). Bar-tailed Godwits are reliant on a small number of wintering areas in Britain and Ireland and show strong site fidelity throughout the winter (Jourdan et al. 2021; Wernham et al. 2002) and are therefore vulnerable to disturbance in these areas.
The nominate L. l. lapponica breeds from northern Fennoscandia across northern Russia to western Siberia, and mainly winters on estuaries in northwest Europe and the West African coast (Wernham et al. 2002). L. l. lapponica accounts for the majority of the moulting population at the Wash, the most important estuary for Bar-tailed Godwits in Britain (Atkinson, 1996), which can then move elsewhere in northwest Europe to winter. The subspecies L. l. taymyrensis breeds in central Siberia and is a passage migrant that passes through Britain on the way to and from wintering grounds in West Africa (Atkinson, 1996). Ringing recoveries indicate that birds from both populations are found in Scotland (Forrester et al. 2007). Birds from both populations are thought to undergo their spring moult and accumulate fat deposits at continental spring staging areas such as the Wadden Sea, with some birds from more southerly wintering areas staging in Britain first (Atkinson, 1996). However, a lack of ringing recoveries from December to May means that little is known about wintering and migration strategies during this time. Small numbers of immature and non-breeding adults occur in Britain and Ireland during the breeding season (Wernham et al. 2002).
It is therefore unclear what proportion of the biogeographic population may be potentially at risk of collision with wind turbines in UK waters. However, there will likely be substantial movement of birds across the North Sea, with the arrival of wintering birds from northern Europe in autumn, and subsequent movement east to the Wadden Sea in spring, as indicated by the yellow shading on the above map. Birds on passage from breeding populations further east will also cross the North Sea to stage in Britain and Ireland, as well as the Irish Sea, the Channel, and the northeast Atlantic on continuation south to West Africa, as indicated by the orange shading on the above map. Consequently, the proportion of L. l. lapponica potentially at risk may be substantially higher than the 36% of the population that winters in the UK. Theoretically, it could include the whole population, although this is unlikely as an unknown proportion of passage birds will not visit Britain. Similarly, the proportion of L. l. taymyrensis could include most of the population but is likely to be smaller as an unknown proportion will stopover elsewhere in western Europe. The lack of specific information on passage numbers and migration routes means a broad corridor must be assumed (Wernham et al. 2002).
Timing of migration
Confidence: Medium
Post-breeding Bar-tailed Godwits of the subspecies L. l. lapponica arrive in Britain and Ireland from the end of July to moult at main wintering sites, where they are thought to mostly then stay for the winter, though some do move onto other areas in northwest Europe (Wernham et al. 2002). Birds of the subspecies L. l. taymyrensis arrive in mid- to late-August and are likely to be on passage to moulting and wintering grounds in West Africa (Wernham et al. 2002). Juveniles arrive later, with a large influx in September, which then move between estuaries before choosing a wintering location (Wernham et al. 2002). Peak autumn movements can be inferred from increased BirdTrack reporting rates (see Appendix 2) between late June and mid-October. The timings of the peaks vary across different regions and some regions show two peaks, reflecting the differing movements of the two subspecies and of adults and juveniles described by Wernham et al. (2002).
Major movements of birds wintering in Britain and Ireland to staging sites further east (predominantly the Wadden Sea) occur in February. Birds from wintering grounds further south arrive to continental staging areas later, with some stopping in Britain on the way, causing a second peak in late April and early May (Wernham et al. 2002), though there is no obvious spring passage in Scotland (Forrester et al. 2007). This is reflected in the contrast between the regional BirdTrack graphs in spring. A protracted decrease between early March and mid-May occurs in Scottish regions and in Northern Ireland, whilst in southern and eastern English regions and in Wales, a clear pulse movement of passage birds is apparent.
Bar-tailed Godwit from the eastern flyway wintering in Australia largely departed on spring migration in late afternoon, depending on wind and tidal conditions (Tulp et al. 1994).
Flight heights
Confidence: Low
Three studies have reported a range of flight heights for Bar-tailed Godwits. One radar study of 13 tracks of Bar-tailed Godwits migrating above Sweden (height above crude ground) in spring reported a mean height of 2223 m (± 481; Green, 2004). A second radar study that tracked one flock of bar-tailed godwit migrating over land and sea in autumn in the Russian Arctic reported a mean height of 61 m (Alerstam & Gudmundsson, 1999). A study drawing from visual observations of two flocks of bar-tailed godwit migrating over the North Sea in autumn reported a mean flight height of 119 m above sea level (± 14.1 SD; Christensen et al. 2004). Given the reported flight heights of migrating birds over the sea, and the height of offshore wind turbines (~22 – 300m a.s.l.), it is recommended that a precautionary assumption of 100% of birds at collision risk height is used.
Flight speeds
Confidence: Medium
Several studies have reported flight speeds of Bar-tailed Godwit using various methods. Two studies used satellite tags, reporting mean groundspeeds of 14.8 m/s (± 2.4 SD) to 21.2 m/s (± 4.2 SD) for between 5 and 11 birds migrating during both spring and autumn along the eastern Australia-Alaska/Asia flyway (Battley et al. 2012); and of 16.7 m/s (± 0.6 SE) for 9 tracks from 9 birds migrating in the Pacific in autumn (Gill et al. 2008). One study using a theodolite reported mean airspeeds of 14.4 m/s (± 2.0 SD) across 6 runs for birds migrating over the Baltic in autumn (Pennycuick et al. 2013). A rangefinder study of 15 birds departing from Mauritania on spring migration found mean airspeeds of 14.1 m/s (± 2.9 SD), though in climbing flight only (Piersma et al. 1997). A radar tracking study of Bar-tailed Godwit in flapping flight in south Sweden and the Arctic found mean airspeeds of 18.3 m/s (± 2.1 SD) across 15 tracks (Alerstam et al. 2007). Whilst the Alerstam et al. (2007) and Piersma et al. (1997) studies have similar sample sizes, as the Piersma et al. (1997) study is limited to climbing flight, the estimate of 18.3 m/s ± SD 2.1 is recommended as the most representative value for use in collision risk modelling.
Avoidance rates and behaviour
Confidence: Very Low
No macro-, meso- or micro-avoidance rates have been reported for this species. A low macro-avoidance rate of 0.28 has been reported for waders as a group, based on the percentage of radar tracks entering offshore wind facilities (Krijgsveld et al. 2011). However, post-construction monitoring data collected from onshore windfarms where wader species were observed suggests that avoidance rates are likely to be high (Table 5). Drawing from these data, for the purposes of collision risk modelling, the recommended value for all wader species is 0.9996 ± 0.00002 (Table 5).
Black-tailed Godwit Limosa limosa (limosa / islandica)
SPA Species? |
Yes (breeding population – limosa, non-breeding population – islandica) |
|---|---|
SPA site codes (Introduction, Table 2) |
8:23:27:30:37:38:41:42:48:51:53:54:58:63:67: 70:80:83:124 |
Population size breeding (UK) |
53 pairs (APEP4, 2020); uncertainty: low |
Population size non-breeding (UK) |
41,000 (APEP4, 2020); uncertainty: low |
Population size (Biogeographic flyway, SPA season) |
143,000 – 204,000 individuals (islandica, wintering); 63,000 – 99,000 individuals (limosa, breeding); uncertainty: low (Wetlands International, 2021) |
Percentage of biogeographic population at risk of collision in UK waters (passage / breeding / non-breeding) |
0.06% (breeding); uncertainty: medium 100 % (wintering); uncertainty: medium |
Movement of breeding birds (limosa)
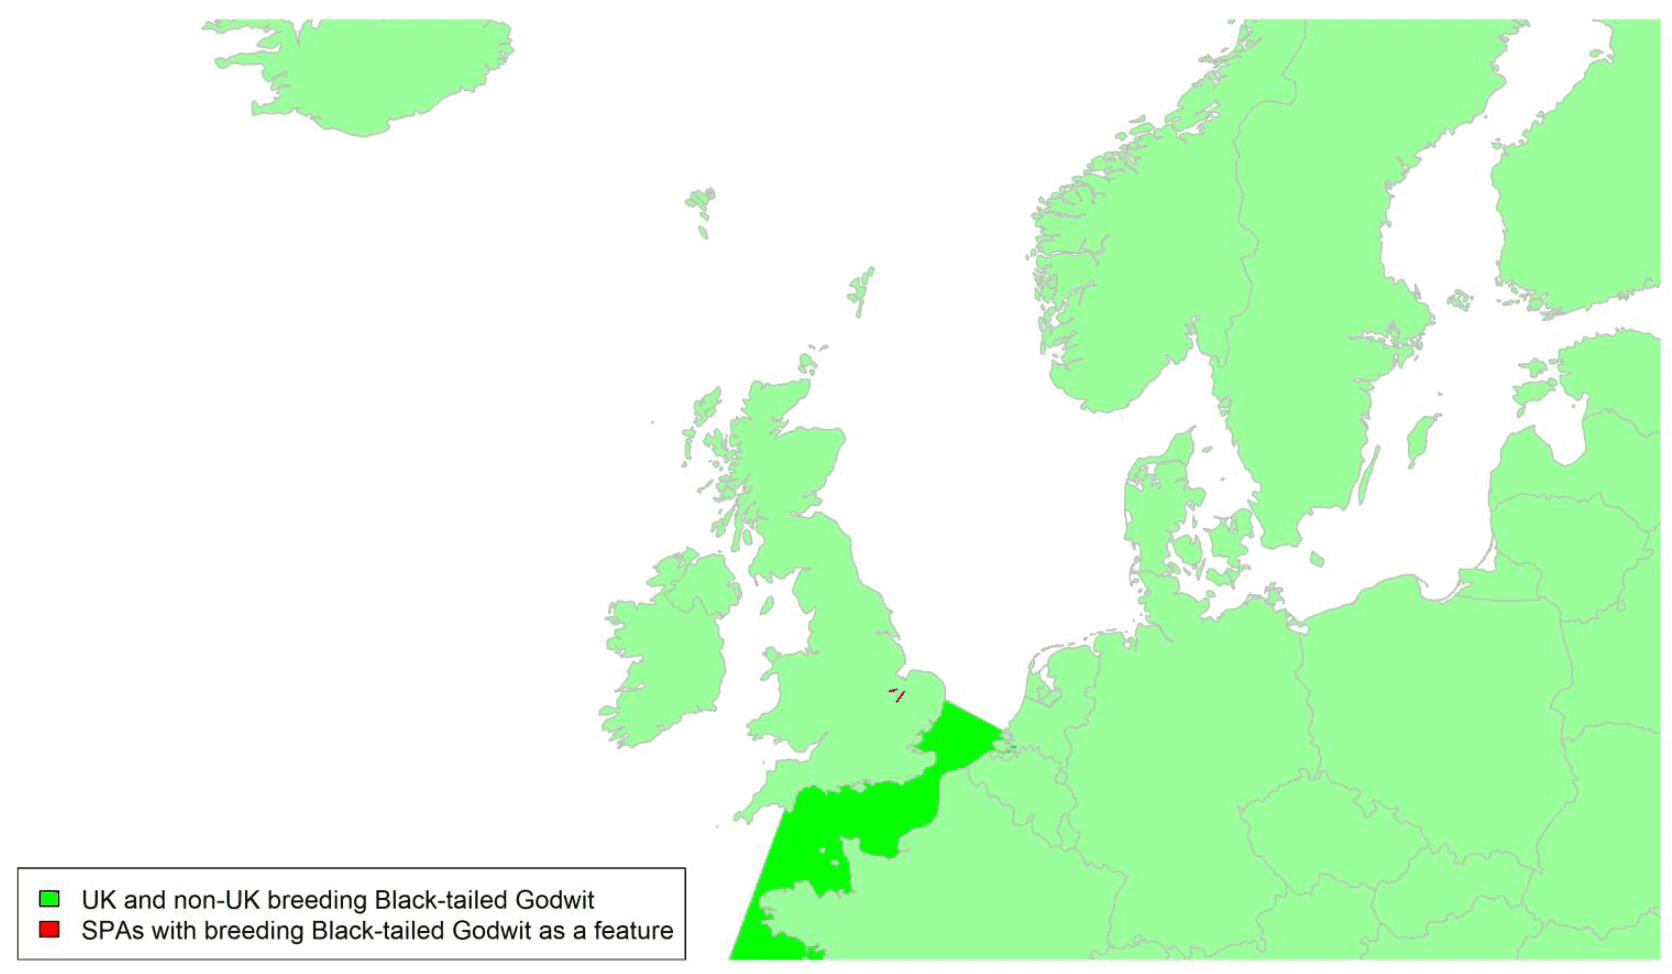
Movement of wintering birds (islandica)
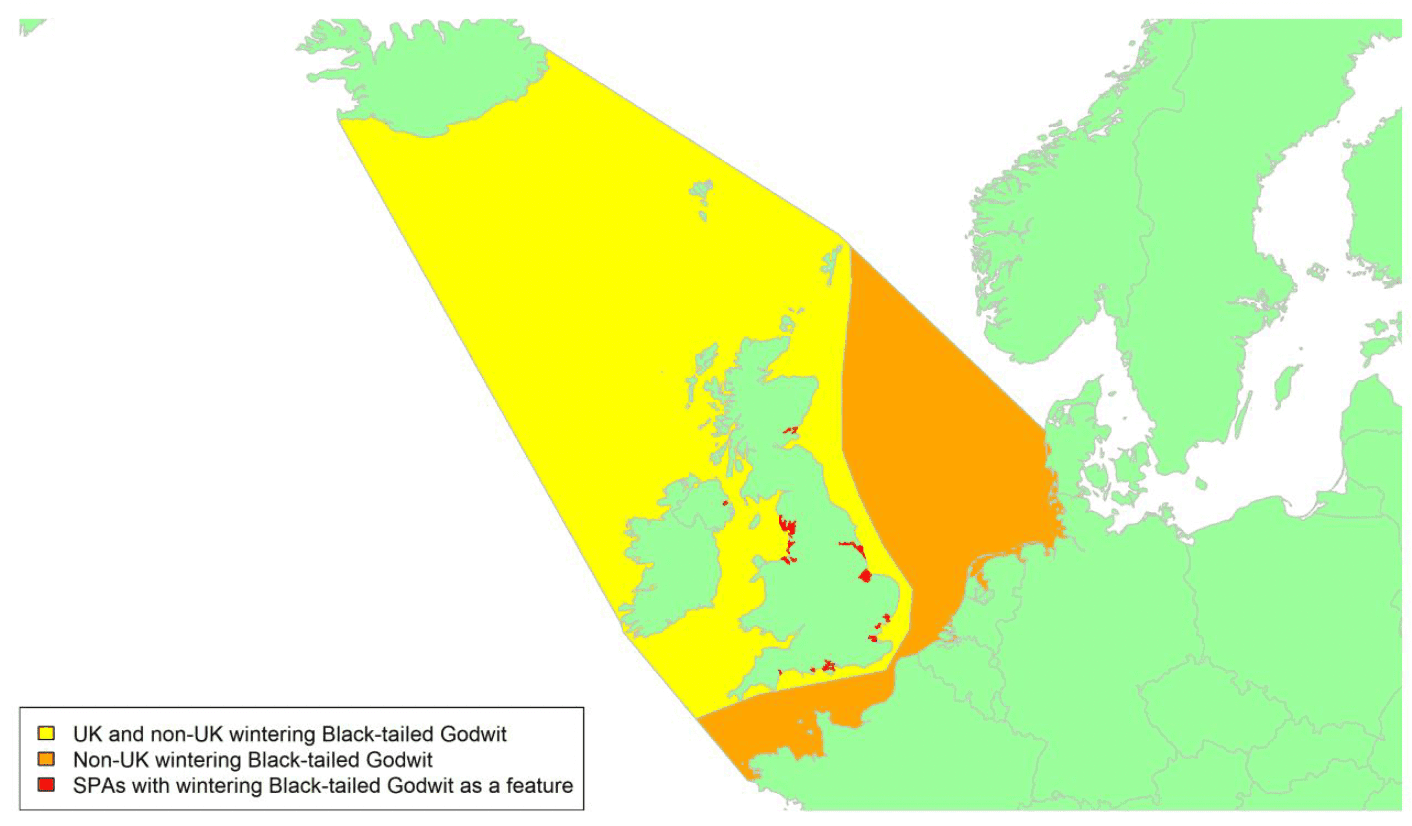
Migratory routes
Confidence: Low
Two subspecies of Black-tailed Godwit occur in the UK. L. l. limosa breeds in Europe and winters in Africa, and L. l. islandica breeds mostly in Iceland and winters in the UK and further south.
The UK breeding population of limosa Black-tailed Godwits is small and concentrated at two main breeding sites in East Anglia, which are designated as SPAs. Tracking of limosa Black-tailed Godwits breeding in the Netherlands show that the majority of individuals migrate to sub-Saharan Africa during the non-breeding season, with smaller numbers over-wintering in Iberia and Morocco (Verhoeven et al. 2021), and it is likely UK-breeding individuals do the same. Black-tailed Godwits migrate across a broad front, making long distance flights to and from their wintering areas (Van Gils et al. 2020). However, there are few ringing recoveries of UK-breeding individuals so precise migration routes are not known, and there is no evidence that continental-breeding individuals migrate across the UK on passage (Wernham et al. 2002). UK breeding L. l. limosa will be likely to cross the English Channel or the southernmost part of the North Sea, as shown by the yellow area on the breeding map above.
A very small number of islandica Black-tailed Godwits breed in northern Scotland. Otherwise, the majority, if not all, of the Icelandic population of Black-tailed Godwits either winters in or migrates through the UK. Precise migration routes between Iceland and the UK are not known. Colour-ringing has revealed major wintering areas in Morecombe Bay, the Wash, and the south coast of England (Alves et al. 2012), however individuals are recorded across the UK during autumn and therefore migratory routes may occur across any parts of UK waters. There have been no new tracking studies on the migration routes of islandica Black-tailed Godwits through the UK since Wright et al. (2012) to understand the precise routes across UK waters taken by migrating individuals to and from Iceland. However, a single islandica Black-tailed Godwit GPS tracked in the Tagus Estuary showed that after staging in the Netherlands, this individual migrated north along the east coast of the UK, through the North Sea and Scottish waters, arriving in Iceland in late April. Most L. l. islandica are therefore likely to cross the yellow shaded areas on the wintering map above, with passage birds continuing across the orange areas.
The breeding population of L. l. limosa makes up only a tiny part of the biogeographic population and hence the proportion of L. l. limosa potentially at risk of collision with wind turbines in UK waters is less than 0.1%. However, up to 100% of the population of L. l. islandica could be potentially at risk of collision. This estimate depends on the small but unknown numbers of birds which may migrate through the west of Ireland and hence bypass UK waters.
Black-tailed Godwits migrate across a broad front, making long distance flights to and from their wintering areas (Van Gils et al. 2020).
Timing of migration
Confidence: Medium
Spring migration of limosa Black-tailed Godwits returning to the UK occurs during late March and April, with autumn migration during July. Spring migration of islandica Black-tailed Godwits occurs from mid-April to early May (Gunnarsson et al. 2006) and autumn migration sees individuals returning to the UK in July and August where they congregate in large moulting flocks before dispersing to wintering locations elsewhere in the UK, Ireland or continental Europe (Wernham et al. 2002). These post-moult dispersals see birds crossing the southern North Sea, Irish Sea and English Channel in autumn and early winter, returning in early spring. The BirdTrack reporting rates of Black-tailed Godwits (see Appendix 2) shows that spring migration occurs across Scotland from mid to late March until mid-May, and autumn migration from the end of June to mid-October; with the exception of the north coast where recording rates are too low to determine a pattern, and the Solway where the pattern is more complex with a higher reporting rate over the winter. For most regions outside of Scotland, the reporting rates show a weak pulse of spring migration largely between mid-March and late May, potentially due to wintering individuals departing to breeding areas, and an autumn pulse between mid-June and mid-October.
Non-stop migratory flights with durations up to 48 hours indicate that migration can occur during the night (Senner et al. 2018).
Flight heights
Confidence: Low
Estimates of limosa Black-tailed Godwit flight heights are available from one GPS study, with a mean flight height of 3607 ± SD 1573 m above sea level (maximum 5956 m above sea level, from 24 migratory flights of four individuals) during spring and autumn migration, predominantly over land, but including a sea crossing, between the Netherlands and West Africa (Senner et al. 2018). Given the limited sample size of this study, the fact that the majority of the migratory route will have taken place over sea, and the fact that reports of migratory altitudes over sea in the related bar-tailed godwit (see above) are much lower than these values, it is recommended that a precautionary estimate of 100% of birds at collision risk height is used.
Flight speeds
Confidence: High
Based on GPS data during spring and autumn migration between the Netherlands and West Africa, a mean groundspeed of 18.1 ± 6.0 SD m/s was reported from 24 migratory flights of four limosa Black-tailed Godwits (Senner et al. 2018).
It is recommended that a value of 18.1 ± 6.0 m/s is assumed for collision risk modelling.
Avoidance rates and behaviour
Confidence: Very Low
No macro-, meso- or micro-avoidance rates have been reported for this species. A low macro-avoidance rate of 0.28 has been reported for waders as a group, based on the percentage of radar tracks entering offshore wind facilities (Krijgsveld et al. 2011). However, post-construction monitoring data collected from onshore windfarms where wader species were observed suggests that avoidance rates are likely to be high (Table 5). Drawing from these data, for the purposes of collision risk modelling, the recommended value for all wader species is 0.9996 ± 0.00002 (Table 5).
Turnstone Arenaria interpres
SPA Species? |
Yes (non-breeding population) |
|---|---|
SPA site codes (Introduction, Table 2) |
15:30:37:41:47:63:68:70:78:90:118:123: 172:185:205 |
Population size breeding (UK) |
n/a |
Population size non-breeding (UK) |
43,000 (APEP4, 2020); uncertainty: low |
Population size (Biogeographic flyway, SPA season) |
200,000 – 260,000 individuals (Canada & Greenland); 44,000 – 87,000 individuals (N Europe); uncertainty: medium (Wetlands International, 2021) |
Percentage of biogeographic population at risk of collision in UK waters (passage / breeding / non-breeding) |
c.100% (Canada & Greenland); uncertainty: high Unknown (N Europe) |
Movement of wintering birds
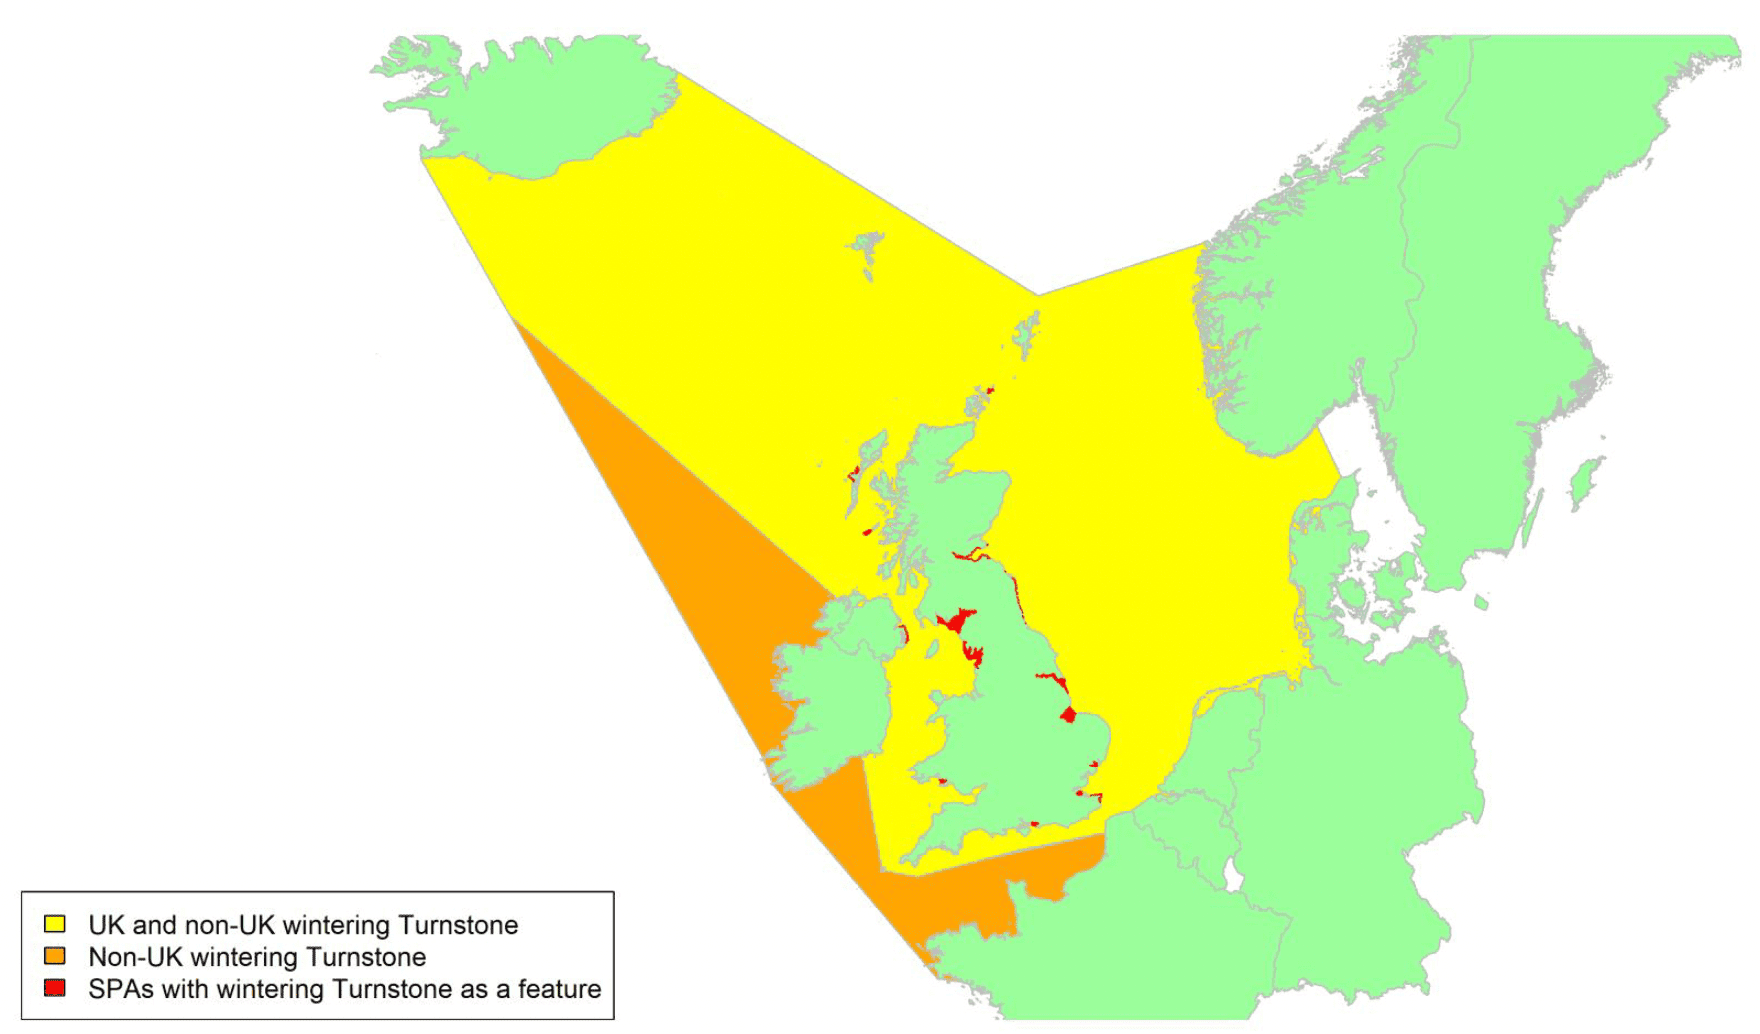
Migratory routes
Confidence: Low
The Turnstone has a wide breeding distribution across northern Eurasia and North America and is a fully migratory long-distance migrant. Typically, only non-breeding birds are found in Britain and Ireland. Most birds that overwinter in the UK breed in Canada and Greenland, many making a migratory stopover in Iceland, but many flying directly. There are also a smaller number of Fennoscandian breeders (Wernham et al. 2002). In addition, the UK hosts passages migrants from both breeding populations that arrive in the UK on autumn migration to build up fat reserves, before continuing further south to winter in continental Europe or Africa. Some birds that winter elsewhere will also stop in the UK during return migration to breeding grounds in spring (Wernham et al. 2002).
These migration patterns, and the widespread distribution of Turnstone around the UK coast, mean that birds could pass through almost all parts of UK waters. Birds wintering in the UK come from both the northwest and the northeast, as indicated by the yellow shading on the above map. Passage migrants that pass through Britain and Ireland on passage further south will follow the same route and then continue across the waters marked by the orange shading on the map. However, there are no data on specific routes taken, and so broad migratory corridors must be assumed. It is likely that a very high proportion of the population from Canada and Greenland could be potentially at risk of collision in UK waters, although some birds may bypass UK waters and travel via the west coast of the Republic of Ireland. In addition, an unknown but possibly high proportion of Fennoscandian breeders will move through UK waters on passage to their wintering grounds in western Africa.
Timing of migration
Confidence: Low
The first adults arrive to UK wintering grounds between late July and the end of August, with peak migration occurring in early August. Observations from North Ronaldsay indicate the main influx continues until early October (Forrester et al. 2007). Turnstones then begin to leave their wintering grounds again as early as late February, with peak movements occurring in Britain and Ireland in April and May (Wernham et al. 2002). Birds on the west coast are thought to breed in more westerly areas of Greenland and Canada and leave early in the year to stage in Iceland. Meanwhile birds on the east coast leave later and fly direct to breeding sites in northeast Greenland (Wernham et al. 2002). These patterns can be seen in BirdTrack reporting rates (see Appendix 2), with birds generally departing from the west of the UK by mid-May and from the east by mid-June although there is some variability, e.g., ongoing decreases in Wales occur until late June. Turnstones can be found in the UK virtually year-round however, with ringing recoveries and BirdTrack data indicating just a short period between mid-June and early July where very little migratory activity occurs.
Most Turnstone migration is likely to occur during late afternoon, early evening and at night. Peak departure of Turnstone leaving Iceland on spring migration is during the afternoon and evening, depending on the tidal cycle and wind conditions, with birds preferring to depart during rising or high tides and with tailwinds (Alerstam et al. 1990; Gudmundsson, 1993).
Flight heights
Confidence: Low
There is little data available on flight heights of migrating Turnstone. Alerstam et al. (1990) used a telescope and optical range finder to track migration movements of Turnstone departing from Iceland for Nearctic breeding grounds and found that upon departure birds climbed steeply to high altitudes, with typical vanishing heights (above which, birds could not be seen by observers) of between 400 and 1200 m a.s.l., in flocks of between 13 and 70 individuals. Some flocks descended immediately however to fly above the sea surface upon encountering unfavourable winds. High altitudes are likely to be reached particularly during nocturnal migration, but movements at low altitudes are also very possible (Krijgsveld et al. 2011).
Given the uncertainty and lack of directly measured data for Turnstone flight heights, it is recommended that a precautionary estimate of 100% of flights at collision risk height is used.
Flight speeds
Confidence: Low
There is little data available on flight speeds of migrating Turnstone. Two Turnstone migrating inland over south Sweden in autumn flew at mean airspeeds of 14.9 m/s (± 0.7 SD; Alerstam et al. 1990; Alerstam et al. 2007). Five birds departing from Mauritania to embark on long-distance migration in spring had airspeeds of 10.0 m/s (± 3.3 SD), though while climbing to reach altitude (Piersma et al. 1997). Airspeeds of 151 migrating Turnstone across North America, recorded using inferences from motus tracking, were slightly higher in autumn than spring, at 13.7 m/s in autumn compared to 12.0 m/s in spring, possibly to minimise predation by arriving earlier at stopover sites (no SD provided; Duijns et al. 2019).
Whilst the data collected by Duijns et al. (2019) reflect a far greater sample size than the other studies, it is felt that the direct measurements obtained using rangefinders by Piersma et al. (1997) reflect a more robust estimate of flight speed in this instance. Consequently, an estimate of 10.0 m/s (SD 3.3) is recommended for the purposes of collision risk modelling.
Avoidance rates and behaviour
Confidence: Very Low
No macro-, meso- or micro-avoidance rates have been reported for this species. A low macro-avoidance rate of 0.28 has been reported for waders as a group, based on the percentage of radar tracks entering offshore wind facilities (Krijgsveld et al. 2011). However, post-construction monitoring data collected from onshore windfarms where wader species were observed suggests that avoidance rates are likely to be high (Table 5). Drawing from these data, for the purposes of collision risk modelling, the recommended value for all wader species is 0.9996 ± 0.00002 (Table 5).
Knot Calidris canutus
SPA Species? |
Yes (non-breeding population) |
|---|---|
SPA site codes (Introduction, Table 2) |
7:19:24:30:37:41:44:54:63:65:67:70:78:80: 93:123:205 |
Population size breeding (UK) |
n/a |
Population size non-breeding (UK) |
265,000 (APEP4, 2020); uncertainty: low |
Population size (Biogeographic flyway, SPA season) |
310,000 - 360,000 individuals (C. c. islandica); uncertainty: medium (Wetlands International, 2021) |
Percentage of biogeographic population at risk of collision in UK waters (passage / breeding / non-breeding) |
50%–100% (non-breeding); uncertainty: medium |
Movement of wintering birds
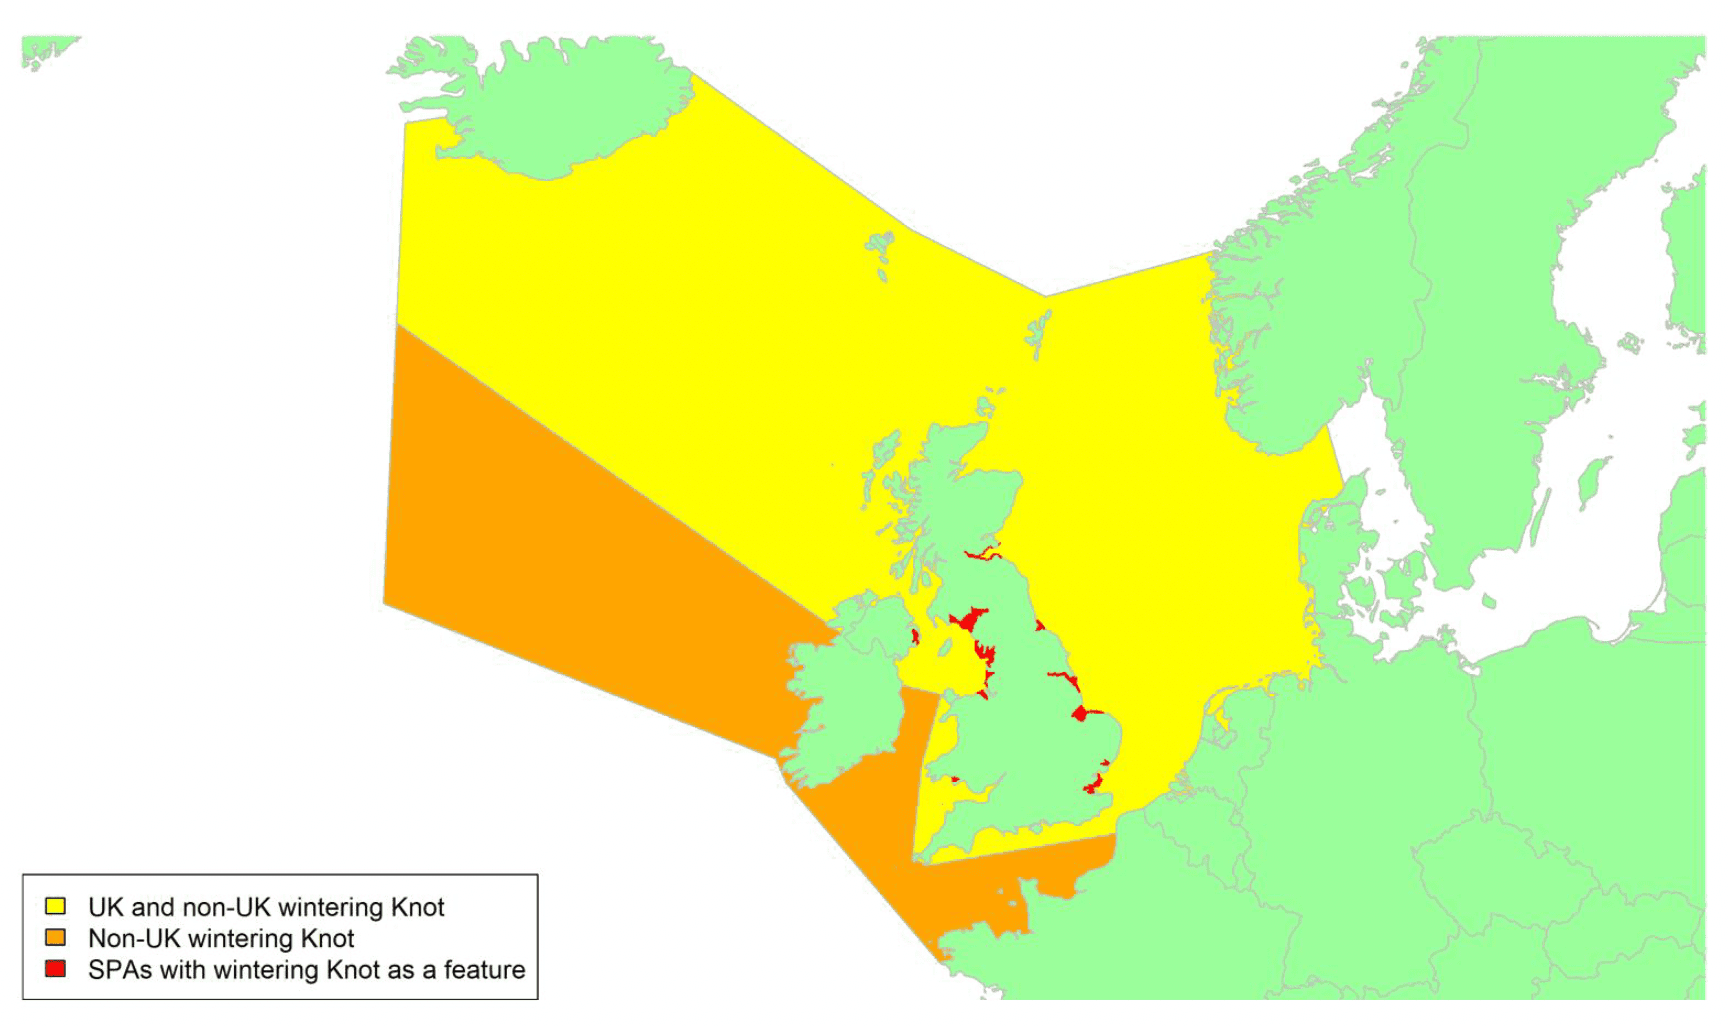
Migratory routes
Confidence: Low
Knot has a wide breeding distribution across the high Arctic, and is a fully migratory long-distance migrant, making some of the longest non-stop migrations of any wader (Wernham et al. 2002). Almost all birds found in Britain and Ireland are of the subspecies C. c. islandica, which migrate from breeding grounds in northern Greenland and high Arctic Canada, via staging areas in Iceland, to estuaries around Britain and the North Sea. These estuaries host internationally important numbers of birds, which use them as wintering grounds, autumn moulting areas, and early spring staging areas to accumulate fat reserves (Wernham et al. 2002). Some first-year birds of the nominate subspecies C. c. canutus may exceptionally occur on passage from breeding grounds in northern Russia to wintering grounds in west Africa. There is also a very small first-year over-summering population in the UK, probably of birds that were unable to build sufficient fat reserves to undertake the long migration to Iceland or Norway (Wernham et al. 2002).
Birds migrating between the UK and breeding grounds could travel across UK waters to either the west, east or north of mainland Britain depending on whether they fly direct from Iceland or via Norway and/or the Wadden Sea. The English Channel is also likely to be crossed by many birds that winter in France or further south. These migration patterns, and the widespread distribution of Knot around the UK coast, mean that birds could pass through almost all parts of UK waters, particularly during peak migration times. The vast majority of Knot are likely to pass through waters to the northwest and east of the UK, as indicated by the yellow shading on the above map. Birds on passage to winter further south may also cross the Channel and the Irish Sea, as indicated by the orange shading on the above map. However, though the destinations and timings of migrating Knot are relatively well-known, there is little information on specific routes taken, with no new information since Wright et al. (2012). Consequently, it is uncertain what proportion of the biogeographic population is potentially at risk of collision with wind turbines in UK waters. This will be at least 50% (i.e., all birds wintering in the UK) and is likely to be close to 100% as a substantial proportion of passage birds will cross UK waters. Note that the biogeographical population considered for these estimates is C. c. islandica only.
Timing of migration
Confidence: Medium
The first adults start to arrive at UK wintering grounds from early July, with the first birds likely to be failed breeders. Autumn passage numbers then continue to build steadily from mid-July, with most adults arriving in August and juveniles in September to moulting sites including the Wash, Dee and Ribble estuaries and Morecambe Bay (Wernham et al. 2002). Further substantial movements of birds between passage or moulting sites and wintering sites occurs between October and December, with many birds crossing the southern North Sea or the English Channel. Birds will also move between estuaries within the UK throughout the winter, depending on food supply (Wernham et al. 2002).
Knot then begin to leave again in mid-March, with many individuals moving east to the Wadden Sea to undergo a body moult and accumulate fat stores before continuing to breeding grounds. Other birds remain in Britain and congregate at large estuaries before leaving for breeding grounds in early May (Wernham et al. 2002).
The mixing of birds from different wintering grounds at spring staging areas likely accounts for the lack of obvious spring migratory movements indicated by BirdTrack reporting rates in most regions (see graphs in Appendix 2), with instead a protracted presence around coastal areas. However, marked decreases in reporting rates do occur in southeast England in February and March and in northwest England between mid-April and the end of May. The earlier departure of birds in southeast England may indicate a movement from this region to staging areas in the Wadden Sea. Autumn migration movements through and to the UK are clearly indicated by marked changes in BirdTrack reporting rates across many regions between early July and the beginning of October, peaking in early September. Knot can be found in the UK for most of the year however, with ringing recoveries and BirdTrack data indicating just a short period through June where very little migratory activity occurs.
Most migration is likely to occur during late afternoon, early evening and at night. Peak departure of Knot on spring migration in Iceland and New Zealand is during the afternoon and evening, depending on the tidal cycle and wind conditions, with birds preferring to depart during rising or high tides and with favourable tailwinds (Alerstam et al. 1990; Gudmundsson, 1993; Battley, 1997). Radar tracking of birds on spring migration moving across south Sweden showed median passage was three hours after sunset, with peak migration around midnight (Gudmundsson, 1994).
Flight heights
Confidence: Low
There is very little data available on flight heights of migrating Knot. Alerstam et al. (1990) used a telescope and optical range finder to track migration movements of Knot departing from Iceland for Nearctic breeding grounds and found that upon departure birds climbed steeply to high altitudes, with typical vanishing heights of between 400 and 1200 m above sea level, in flocks of between 100 and 200 individuals. Some flocks descended immediately however to fly above the sea surface upon encountering unfavourable winds. High altitudes are likely to be reached particularly during nocturnal migration, but movements at low altitudes are also very possible (Krijgsveld et al. 2011).
The data for Knot flight heights are primarily obtained from shore-based observations as birds leave on their migrations. It seems likely that birds descend as they move over sea. In the absence of detailed data on flight heights of birds over the sea, a precautionary assumption of 100% of flights at collision risk height should be used.
Flight speeds
Confidence: Low
There are some data available on flight speeds of migrating Knot, but these report variable measurements. Eleven Knot departing from Mauritania to embark on long-distance migration in spring had airspeeds of 11.4 m/s (± 3.3 SD), though while climbing to reach altitude (Piersma et al. 1997). Radar tracking of Knot migrating over south Sweden in autumn found mean groundspeeds of 24.6 m/s (± 4.6 SD; 505 tracks; Gudmundsson, 1994). Mean airspeeds of 912 migrating Knot across North America, inferred from motus tracking, were slightly higher in autumn than spring, at 13.9 m/s in autumn compared to 12.0 m/s in spring, possibly to minimise predation by arriving earlier at stopover sites (no SD provided; Duijns et al. 2019).
Whilst the data reported by Duijns et al. (2019) are based on a far higher sample size, the direct measurements recorded using radar by Gudmundsson (1994) are considered more robust in this instance. Consequently, an estimate of 24.6 m/s (SD 4.6) is recommended for the purposes of collision risk modelling.
Avoidance rates and behaviour
Confidence: Very Low
An evaluation of the risk of offshore wind to Knot in North America concluded that there was a high potential exposure at the macro-scale for long-distance migrants, moderate exposure at the meso-scale as birds descend to or ascend from migratory stopovers, and that there is little information about exposure at the micro-scale (Burger et al. 2011, 2012). However, no macro-, meso- or micro-avoidance rates have been reported for this species. A low macro-avoidance rate of 0.28 has been reported for waders as a group, based on the percentage of radar tracks entering offshore wind facilities (Krijgsveld et al. 2011). Post-construction monitoring data collected from onshore windfarms where wader species were observed suggests that avoidance rates are likely to be high. For the purposes of collision risk modelling, the recommended value is 0.9996 ± 0.00002.
Ruff Philomachus pugnax
SPA Species? |
Yes (breeding and non-breeding populations) |
|---|---|
SPA site codes (Introduction, Table 2) |
2:11:12:21:30:34:41:48:49:54:65 |
Population size breeding (UK) |
26 individuals (APEP4, 2020); uncertainty: low |
Population size non-breeding (UK) |
920 individuals (APEP4, 2020); uncertainty: low |
Population size (Biogeographic flyway, SPA season) |
2,900,000 – 6,200,000 individuals; uncertainty: high (Wetlands International, 2021) |
Percentage of biogeographic population at risk of collision in UK waters (passage / breeding / non-breeding) |
0.05% (non-breeding); uncertainty: high, Unknown (passage) |
Movement of passage birds
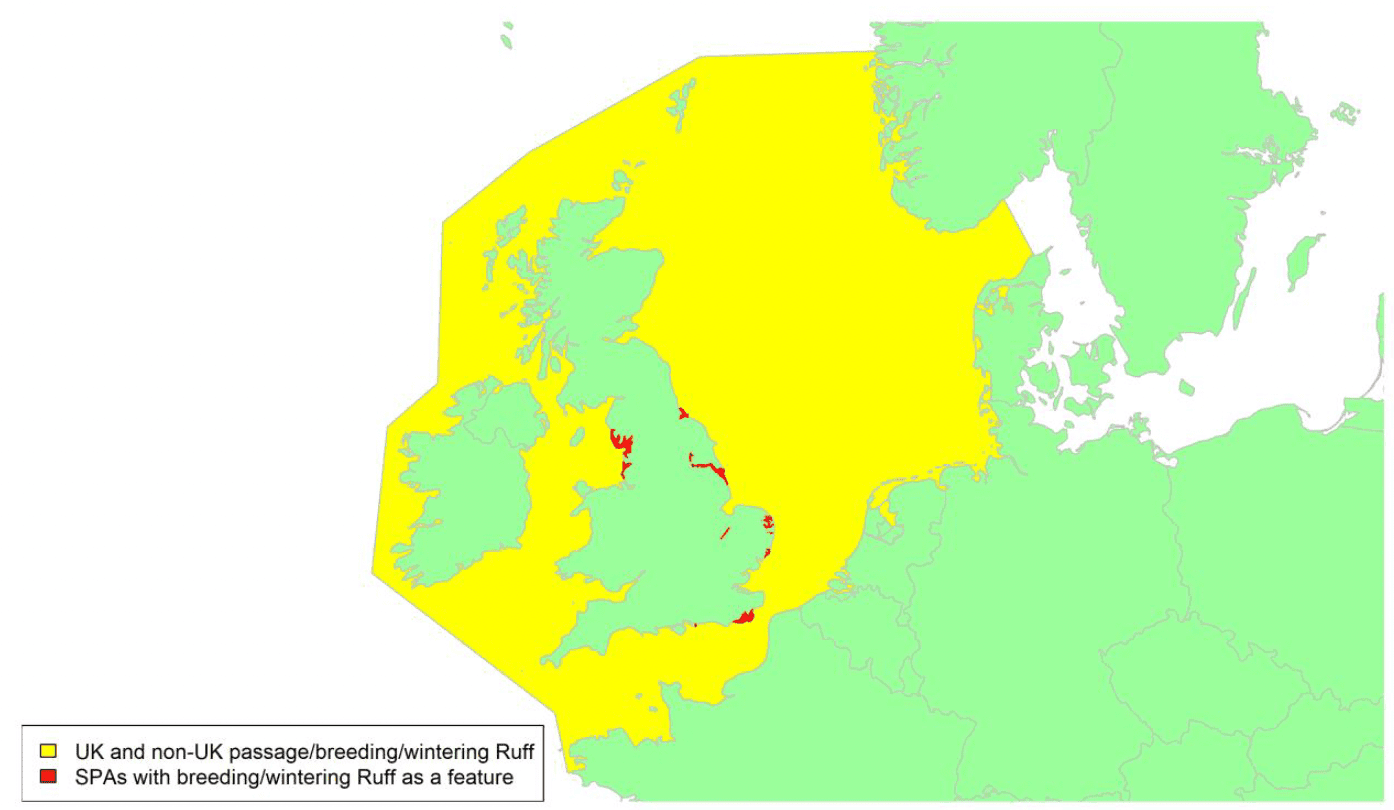
Migratory routes
Confidence: Low
Small numbers of Ruff breed in the UK, largely in the lowlands of eastern England. A small number of individuals also winter, but Ruff primarily occurs in the UK on passage migration, largely in the autumn. Passage individuals migrate between breeding sites in Scandinavia and Russia and wintering sites in sub-Saharan Africa, North Africa or further south in Europe. Ruff likely move primarily across the North Sea and English Channel as shown by the yellow areas on the above map, although migration routes are not well understood, and there have been no new studies on the passage of Ruff in the UK since Wright et al. (2012). Autumn migration occurs on a broad front over Europe (Van Gils et al. 2020). In spring individuals tend to follow a more easterly migration route with few passing across the UK (Wernham et al. 2002). In recent decades, the breeding distribution of Ruff has moved eastwards from the European Arctic to western Siberia. This has also been reflected in an easterly shift in their migration routes away from traditional staging areas in western Europe, particularly in the Netherlands, where habitat quality has deteriorated (Rakhimberdiev et al. 2011; Verkuil et al. 2012).
The number of birds wintering in the UK and hence potentially at risk of collision with wind turbines during passage makes up less than 0.1% of the biogeographic population. However, these birds make up only a small proportion of the birds crossing UK waters as the vast majority of passage birds do not remain to winter in the UK. The total number of passage birds is unknown and is difficult to estimate due to turnover as individuals move across the UK in autumn. However, the UK probably still only hosts a small proportion of the international population.
Timing of migration
Confidence: Medium
In autumn, passage numbers peak in the UK from July to October, with smaller numbers of individuals passing through UK waters at other times of year. This is also reflected in the BirdTrack reporting rates (see Appendix 2) with a pulse of migration shown between early July and mid-November, peaking in late August to early September, which is similar across most regions of the UK. The reporting rates also highlight small numbers passing through some regions of the UK (including the Hebrides and Orkney, and southern, northwest, and eastern England) during spring migration between late February and May.
Flight heights
Confidence: Low
Only one study has quantified flight heights of Ruff, based on radar observations of four flocks during autumn migration in the Russian Arctic, which estimated a mean flight height of 479 m (range 141 - 1030 m) over land and sea (Alerstam & Gudmundsson, 2016).
In the absence of data collected from the offshore environment, it is considered precautionary to assume that 100% of migratory flights take place within the collision risk window.
Flight speeds
Confidence: Medium
Flight speeds of Ruff have been estimated from three studies, one using a theodolite and two radar. The theodolite estimated a mean airspeed of 16.9 ± 1.81 SD m/s from Ruff migrating along the coast of Sweden in the Baltic during autumn, based on eight runs, a series of two or more observations on the same bird (Pennycuick et al. 2013).
A mean airspeed of 17.4 ± 1.0 SD m/s was estimated from three Ruff tracks in the Arctic / south Sweden (flapping flight only, Alerstam et al. 2007). The second radar study also involved three tracks, with an estimated mean airspeed of 13.6 ± 1.2 m/s (Bruderer & Boldt, 2001).
Given the sample sizes of these studies, it is recommended that an estimate of 16.9 m/s ± 1.81 is used for the purposes of collision risk modelling.
Avoidance rates and behaviour
Confidence: Very Low
No macro-, meso- or micro-avoidance rates have been reported for this species. A low macro-avoidance rate of 0.28 has been reported for waders as a group, based on the percentage of radar tracks entering offshore wind facilities (Krijgsveld et al. 2011). However, post-construction monitoring data collected from onshore windfarms where wader species were observed suggests that avoidance rates are likely to be high (Table 5). Drawing from these data, for the purposes of collision risk modelling, the recommended value for all wader species is 0.9996 ± 0.00002 (Table 5).
Sanderling Calidris alba
SPA Species? |
Yes, non-breeding populations |
|---|---|
SPA site codes (Introduction, Table 2) |
15:25:30:33:39:41:54:70:78:124:187 |
Population size breeding (UK) |
n/a |
Population size non-breeding (UK) |
20,500 (APEP4, 2020); uncertainty: low |
Population size (Biogeographic flyway, SPA season) |
200,000 individuals (alba, E Atlantic Europe); uncertainty: low (Wetlands International, 2021) |
Percentage of biogeographic population at risk of collision in UK waters (passage / breeding / non-breeding) |
>10%–c.100%; uncertainty: high |
Movement of wintering birds
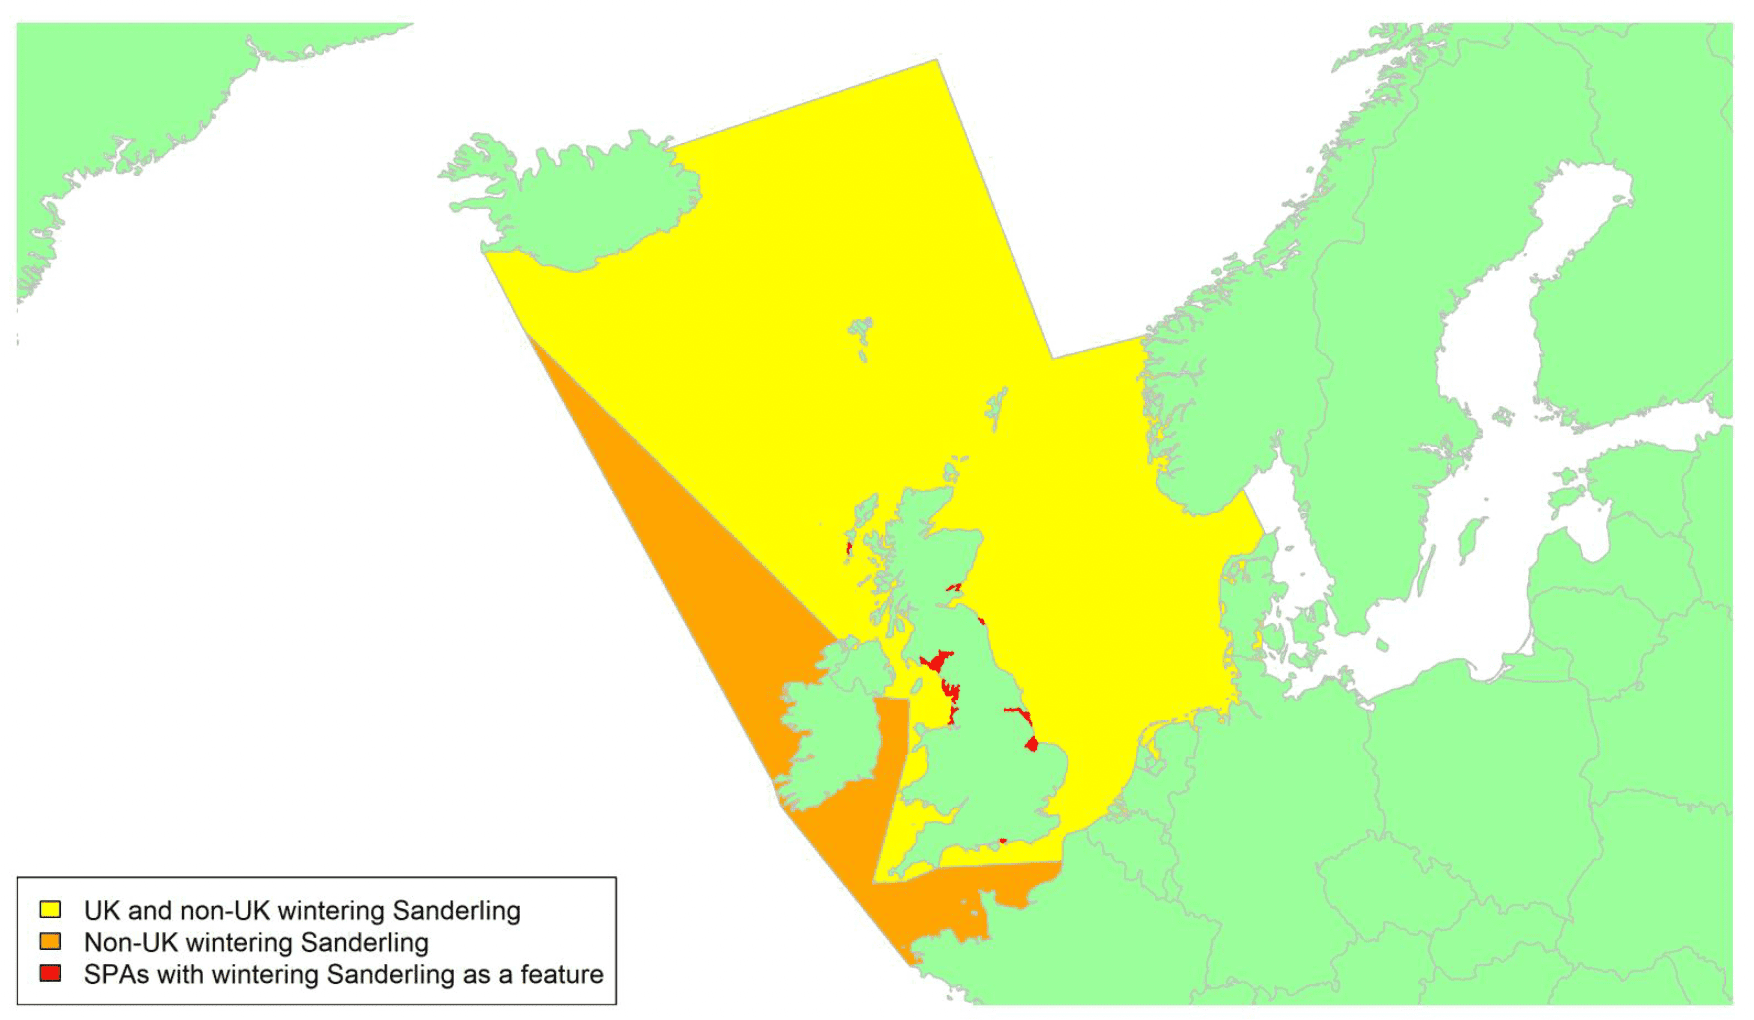
Migratory routes
Confidence: Medium
The Sanderling breeds on the High Arctic tundra across Canada, Greenland, and Siberia, and is a widespread long-distance migrant, wintering on temperate and tropical coasts worldwide. Britain and Ireland host internationally important sites for wintering, moulting, and staging Sanderlings, from breeding populations in both Greenland and Siberia (Wernham et al. 2002). Sanderlings from northeast Greenland migrate through northwest Europe to winter in Africa, while Siberian breeders follow various routes to widespread wintering areas (Wernham et al. 2002). Ringing recoveries of Sanderlings staging in Iceland in spring showed Britain and Ireland to be important wintering areas (Gudmundsson & Lindstrom, 1992), while all seven birds tagged with geolocators in northeast Greenland stopped in Britain and Ireland during the spring and/or autumn migration (Reneerkens et al. 2020). Several of these birds appeared to make direct flights north from the Netherlands to Greenland across the North Sea (Reneerkens et al. 2020). However, the origin of birds found in Britain and Ireland, and whether they remain for the winter or stop over before continuing onwards migration, remains uncertain and appears to be particularly complex due to mixing of birds from different breeding areas (Gudmundsson & Lindström, 1992). Small numbers of both adults and immatures over-summer in Britain and Ireland (Wernham et al. 2002).
There is likely therefore to be substantial movement of both passage migrants and wintering Sanderlings through northern UK waters, with movements also likely across the North Sea, the Irish Sea, and the Channel, as indicated by the above map. Birds wintering in the UK are likely to come from either the northwest or east, as indicated by the yellow shading, with passage birds continuing across the English Channel. The proportion of the biogeographic population potentially at risk of collision with wind turbines in UK waters is likely to be substantially higher than the 10% of the population that winters in the UK, as almost all birds breeding in Greenland and an unknown proportion of those breeding in Siberia will pass through UK waters on passage. However, it is difficult to produce a more robust minimum estimate of the proportion of the population potentially at risk as data on the size of each population are lacking.
Timing of migration
Confidence: Medium
Sanderlings arrive in Britain and Ireland from mid-July, with numbers peaking between late August and early October. Further movements occur during October and November, with post-moult movements of birds that either then winter in Britain and Ireland or continue onwards migration (Wernham et al. 2002). In spring, Sanderlings begin to leave Britain and Ireland from March, with numbers peaking in May with the arrival of northbound passage migrants that use Britain and Ireland as a migration stopover, particularly northwest England (Wernham et al. 2002).
Peak passage movements during the spring migration can be inferred from a pulse of BirdTrack reporting rates in many regions between late April and mid-June (see graphs in Appendix 2). The earlier movement of some birds wintering in Britain during February and March is also evident in some of the graphs, in particular the plot for eastern England. Peak movements during the autumn migration can be inferred from a pulse between early July and late October in many regions, which peaks in early September. A higher BirdTrack reporting rate occurs during autumn migration than during spring in most regions, reflected in a more pronounced peak on the graphs. This may indicate either that higher numbers of Sanderlings stage in Britain in autumn, or that individuals remain present for a longer period (or both).
Sanderlings departing from Iceland on spring migration mainly left during the late afternoon and evening (Gudmundsson & Lindström, 1992), peaking between 17:00 and 19:00 (Gudmundsson, 1993). The mean hour of departure for Sanderlings at a staging area in the Gulf of Mexico was 20:10, around an hour before sunset, while there was no clear pattern to arrival times (Howell et al. 2020).
Flight heights
Confidence: Low
There is no data on flight heights of migrating Sanderlings. In the absence of such data, it is recommended that a precautionary estimate of 100% of birds at collision risk height is used for the purposes of collision risk modelling.
Flight speeds
Confidence: Low
Radio-tagged Sanderlings in the Gulf of Mexico flew at mean groundspeeds of 21.4 m-s across 73 tracks (± 1.1 SD; Howell et al. 2019). Three birds observed in Mauritania in climbing flight flew at mean airspeeds of 10.1 m-s (± 1.3 SD; Piersma et al. 1997). Given the relative sample sizes of these studies, it is recommended that an estimate of 21.4 m/s ± 1.1 is used for the purposes of collision risk modelling.
Avoidance rates and behaviour
Confidence: Very Low
No macro-, meso- or micro-avoidance rates have been reported for this species. A low macro-avoidance rate of 0.28 has been reported for waders as a group, based on the percentage of radar tracks entering offshore wind facilities (Krijgsveld et al. 2011). However, post-construction monitoring data collected from onshore windfarms where wader species were observed suggests that avoidance rates are likely to be high (Table 5). Drawing from these data, for the purposes of collision risk modelling, the recommended value for all wader species is 0.9996 ± 0.00002 (Table 5).
Dunlin Calidris alpina
SPA Species? |
Yes, breeding, and non-breeding populations |
|---|---|
SPA site codes (Introduction, Table 2) |
7:8:15:23:30:33:37:38:39:41:53:54:63:67:69:70: 78:79:80:107:114:116:122:123:124:143:165:166:172:185:187:205 |
Population size breeding (UK) |
8,600 – 10,500 pairs (APEP4, 2020); uncertainty: medium |
Population size non-breeding (UK) |
350,000 individuals (APEP4, 2020); uncertainty: low |
Population size (Biogeographic flyway, SPA season) |
26,000 – 32,000 individuals (schinzii Britain & Ireland/SW Europe & NW Africa, breeding); uncertainty: medium 730,000 – 830,000 (schinzii Iceland & Greenland/NW & W Africa, passage); uncertainty: low 31,000 – 46,000 (arctica NE Greenland/W Africa, passage); uncertainty: medium 1,300,000 - 1,400,000 (alpina, wintering); uncertainty: low (Wetlands International, 2021) |
Percentage of biogeographic population at risk of collision in UK waters (passage / breeding / non-breeding) |
c.100% breeding schinzii Britain & Ireland; uncertainty: low 87.6% non-breeding (all races); uncertainty: low |
Movement of breeding birds
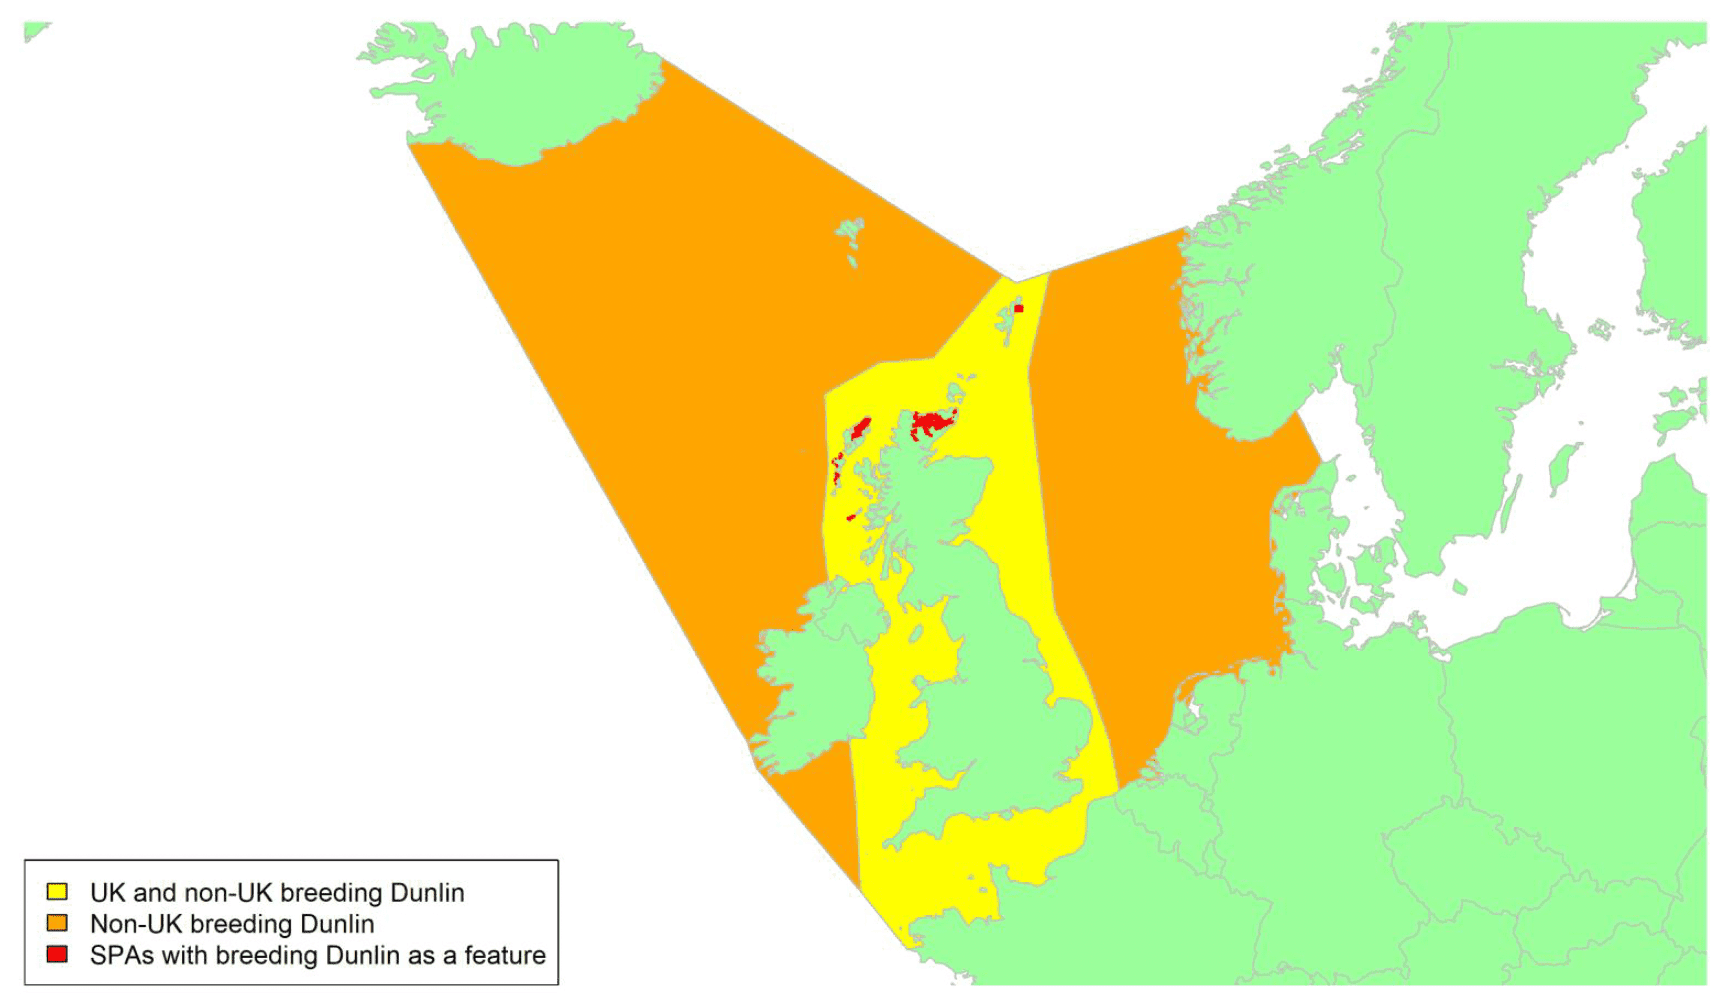
Movement of wintering birds
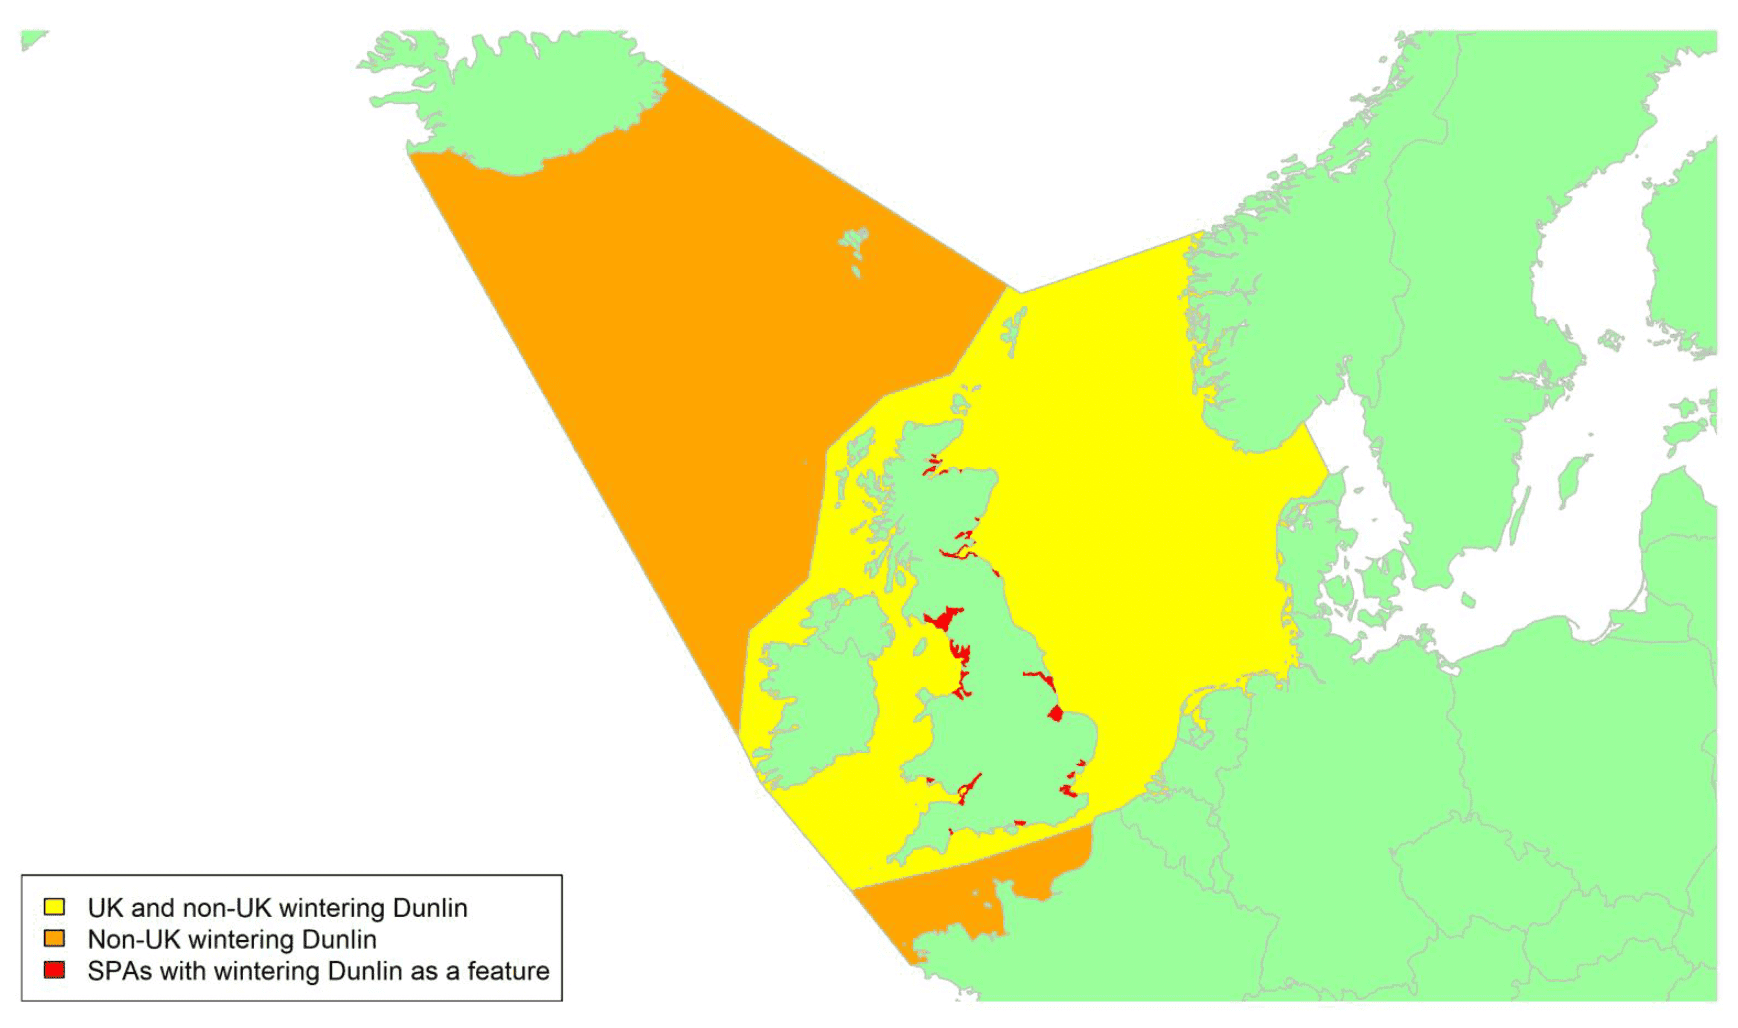
Migratory routes
Confidence: Medium
The Dunlin has a circumpolar breeding distribution in Arctic and sub-Arctic zones, with several sub-populations that have different migratory patterns. Three sub-species occur in Britain and Ireland. C. a. arctica breeds in northeast Greenland, and can be found briefly in Britain and Ireland as a passage migrant to and from its wintering grounds in West Africa (Lopes et al. 2006; Wernham et al. 2002). C. a. schinzii breeds in Iceland and southeast Greenland, with smaller breeding populations in Britain and Ireland and southern Norway. C. a. schinzii also mainly winters in West Africa, though some British and Baltic breeders winter on the Atlantic coast of Europe (Wernham et al. 2002; Lopes et al. 2006). The nominate C. a. alpina breeds in northern Fennoscandia and across western Siberia, and migrates to western Europe, including Britain and Ireland, to moult and spend the winter. C. a. alpina are the most abundant population found in Britain and Ireland outside the breeding season, forming huge flocks at estuaries, and account for most ringing recoveries (Wernham et al. 2002). Wintering C. a. alpina are widespread around UK coasts, with the main concentrations beingfound at estuaries, mostly in England (Frost et al. 2021). Birds tend to remain at wintering areas throughout the winter.
There is substantial movement of Dunlin(C. a. arctica and C. a. schinzii)across waters to the west and north of the UK, as most birds migrating from breeding populations in Greenland and Iceland stage in Britain and Ireland (Lopes et al. 2006) before continuing to wintering grounds further south, passing through parts of the North Sea, Atlantic, Irish Sea and the Channel en route to wintering grounds in West Africa. Most Dunlin on spring passage back to breeding grounds in Greenland and Canada stage on the west coast of Britain (Lopes et al. 2006). Breeding Dunlin in Britain and Ireland are largely found on moorland in the north and west of both islands, including the Outer Hebrides/Na h-Eileanan Siar and Northern Isles, and so are likely to pass through similar areas on migration to and from West Africa or northwest Europe, as indicated by the yellow shading on the breeding map above. There is also substantial movement across all parts of the North Sea with the arrival of a large proportion of Dunlin breeding to the east (C. a. alpina) to wintering grounds in Britain and Ireland, as indicated by the yellow shading on the wintering map above. Birds which only pass through the UK on passage may cross both the orange and yellow areas on both maps. No information is available on specific routes taken by migrating Dunlin, with no new studies since Wright et al. (2012) and so broad migratory corridors must be assumed.
As all birds from the C. a. schinzii population pass through UK waters on passage, and a large proportion of C. a. alpina winter in the UK, a substantial proportion of the biogeographic wintering population (possibly around 90% from both races) could consequently be potentially at risk of collision with wind turbines in UK waters. All birds from the breeding population (C. a. schinzii Britain & Ireland) could potentially be at risk.
Timing of migration
Confidence: Medium
Female Dunlin breeding in Britain and Ireland leave the breeding grounds as early as mid-June, with the males and juveniles leaving a few weeks later. The juveniles congregate together before migrating south in late July, and it is likely that most adult British breeders have already left the country by the middle of August (Wernham et al. 2002). Passage migrants from Greenland and Canada mostly pass through between July and September. In July and August, substantial numbers of C. a. alpina breeders from further east arrive at estuaries around the southern North Sea to undergo their main annual moult, including the Wash and some other sites in Britain, with a second wave of birds in October and November that moulted elsewhere before moving west to wintering grounds (Wernham et al. 2002). There is an influx of juveniles in September and October, which migrate on a broader front than adults. In Scotland numbers build rapidly in November to a winter peak between December and February (Forrester et al. 2007).
In spring, C. a. arctica and C. a. schinzii leave their wintering grounds in West Africa between the end of March and mid-May. Fewer birds from these populations stage in Britain and Ireland during the spring migration than the autumn (Wernham et al. 2002). Dunlin breeding in Britain and Ireland arrive on their breeding grounds from April, while birds breeding at more northerly latitudes may not arrive until mid-June (Wernham et al. 2002). C. a. alpina congregate at the Wadden Sea in April and May before continuing onwards to breeding grounds.
The passage of different populations and age classes through the UK therefore results in a varied regional pattern of BirdTrack reporting rates (see Appendix 2), with a protracted migration window indicated by a large pulse in reporting rates across most regions between late June and late October. In spring, the departure of birds wintering in the UK can be inferred from a decrease in BirdTrack reporting rates in late February and March, followed by a pulse of passage migration of birds moving north, indicated by a peak in reporting rates between late March and mid-June.
It is likely that Dunlin migrate largely during the late evening and early night, like other members of the Calidris genus (Gudmundsson & Lindström, 1992; Howell et al. 2019) but there is no specific information available.
Flight heights
Confidence: Low
There are no flight heights reported for this species. In the absence of such data, it is recommended that a precautionary assumption of 100% of flights at collision risk height is used.
Flight speeds
Confidence: Medium
Several studies have reported flight speeds for Dunlin, using various methods and reporting variable flight speeds. Three studies used radar, reporting mean airspeeds of: 8.9 m/s (± 1.6 SD) for two tracks of Dunlin in Europe, the Mediterranean and Israel, of birds which were migrants but were not believed not to be on a migratory flight (Bruderer & Boldt, 2001); 15.3 m/s (± 1.9 SD) for 36 tracks of migrating Dunlin in flapping flight in south Sweden and the Arctic (Alerstam et al. 2007); 11.9 m/s (± 2.5 SD) for non-migratory birds flocking over ocean in western Canada (Hentze, 2012); and 28.3 m/s (± 10.2 SD) for non-migratory transit flights (Hentze, 2006). One geolocator study reported mean groundspeeds of 19.1 m/s (± 0.5 SE) for 35 birds migrating along the East Atlantic Flyway in autumn, and 17.9 m/s (± 0.9 SE) for 23 birds migrating in spring (Pakanen et al. 2018). Piersma et al. (1997) recorded mean airspeeds of 10.5 m/s (± 2.1 SD) for 15 birds departing on migratory flight from West Africa in spring in climbing flight using rangefinders. Reurink et al. (2016) recorded mean groundspeeds of between 14.0 and 17.2 m-s (± 2.6 and 5.7 SD) for 231 measurements of non-migratory flight in the East Pacific using video recordings of birds moving between two points a known distance apart. A study using a theodolite measured mean airspeeds of 16.1 m/s (± 1.1 SD) across 17 runs in autumn in the Baltic (Pennycuick et al. 2013).
Of these studies, the sample size and direct measurements using radar mean that the speeds reported in Alerstam et al. (2007) are considered to be most robust. Consequently, an estimate of 15.3 m/s ± SD 1.9 is recommended for use in relation to collision risk modelling.
Avoidance rates and behaviour
Confidence: Very Low
No macro-, meso- or micro-avoidance rates have been reported for this species. A low macro-avoidance rate of 0.28 has been reported for waders as a group, based on the percentage of radar tracks entering offshore wind facilities (Krijgsveld et al. 2011). However, post-construction monitoring data collected from onshore windfarms where wader species were observed suggests that avoidance rates are likely to be high (Table 5). Drawing from these data, for the purposes of collision risk modelling, the recommended value for all wader species is 0.9996 ± 0.00002 (Table 5).
Purple Sandpiper Calidris maritima
SPA Species? |
Yes (non-breeding population) |
|---|---|
SPA site codes (Introduction, Table 2) |
47:118:172 |
Population size breeding (UK) |
1 pair (APEP4, 2020); uncertainty: low |
Population size non-breeding (UK) |
9,900 (APEP4, 2020); uncertainty: medium |
Population size (Biogeographic flyway, SPA season) |
58,000 – 110,000 individuals (N Europe); uncertainty: medium 11,000 – 12,000 individuals (Canada & Greenland); uncertainty: medium (Wetlands International, 2021) |
Percentage of biogeographic population at risk of collision in UK waters (passage / breeding / non-breeding) |
20% (N Europe); uncertainty: high >96% (Canada & Greenland); uncertainty: low |
Movement of wintering birds
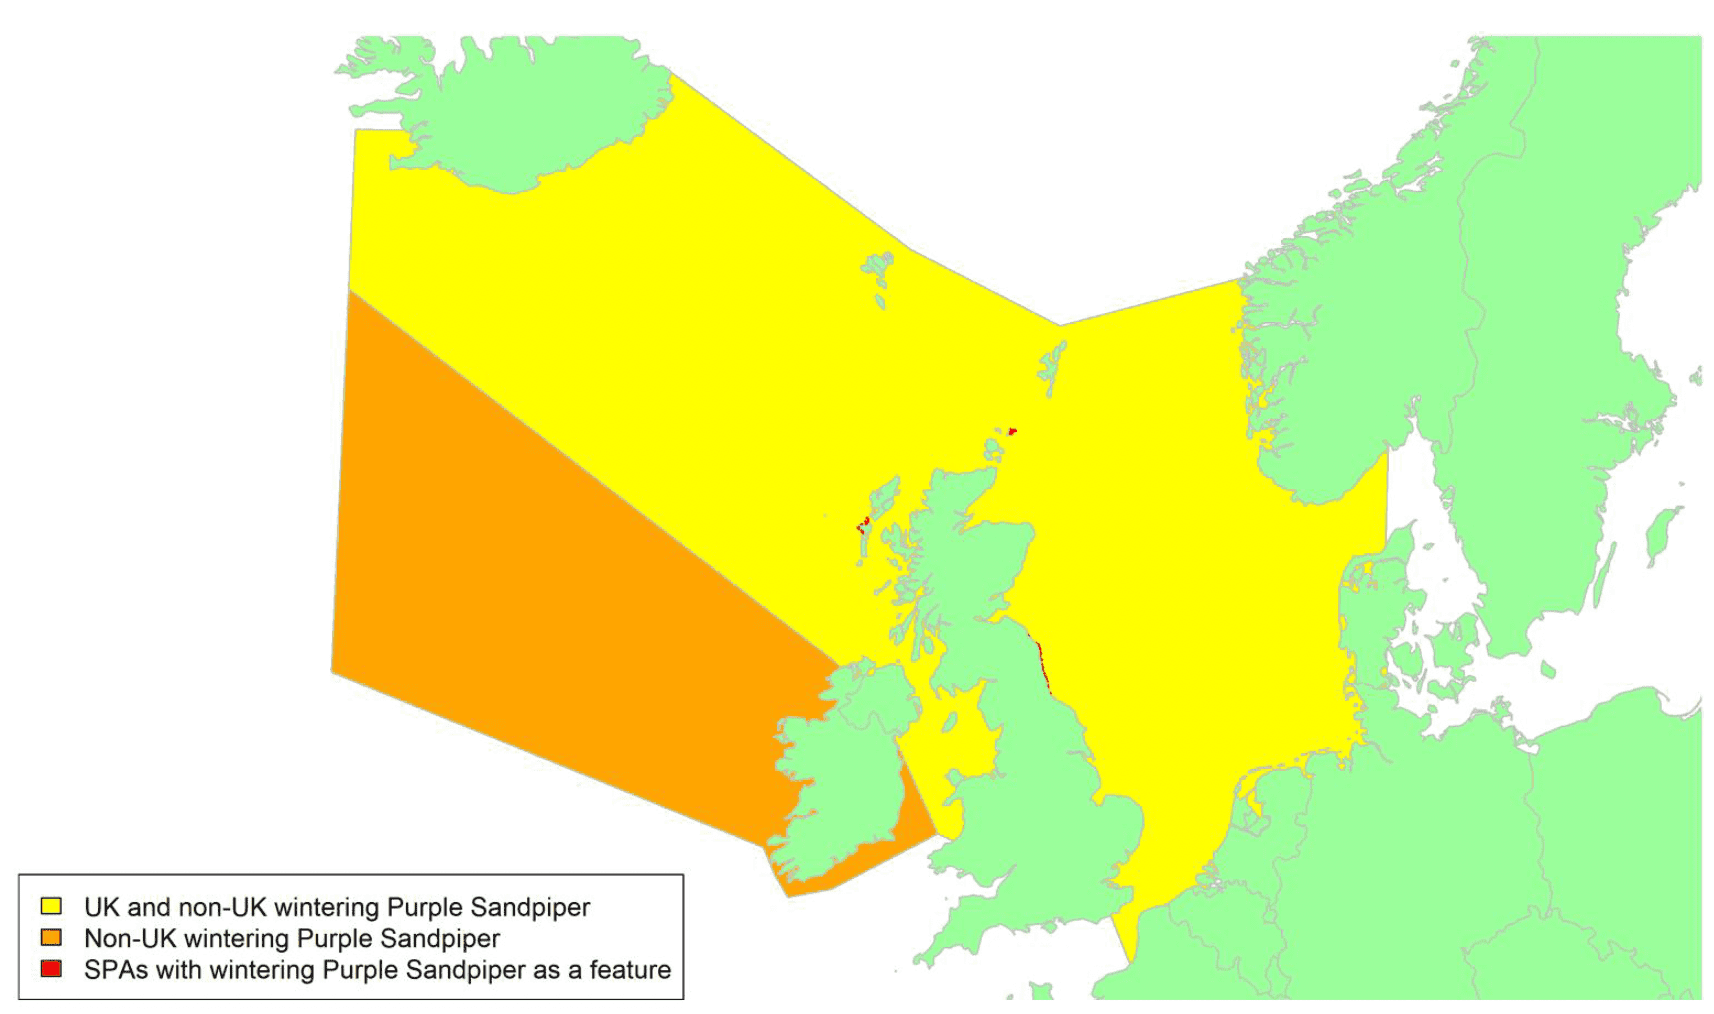
Migratory routes
Confidence: Medium
Purple Sandpiper breed in the Arctic and subarctic zones from eastern Canada to northwest Siberia, including populations in Greenland, Iceland, Svalbard, and northern Scandinavia. All populations winter along North Atlantic coasts: in the USA, the wintering range extends south to Maryland, and in western Europe to Iberia (Wernham et al. 2002). Purple Sandpipers from different populations winter in Britain and Ireland, with some birds undergoing moult. Around a quarter of the wintering population are Norwegian breeders, most of which are found in northeast England and eastern Scotland. The rest are thought to mostly originate from Canada, and predominantly occur in western and northern Scotland (LeBlanc et al. 2017; Wernham et al. 2002). Of twelve birds tagged with geolocators in Britain and western Ireland, all staged in southwest Greenland on both spring and autumn migrations, with some then flying direct to the UK and some birds stopping in Iceland (Summers et al. 2014). One bird ringed on the east coast was subsequently encountered on Svalbard, however this population mainly winters in southern Sweden. Birds also pass through Britain and Ireland on passage further south, with several ringing recoveries showing birds wintering in the southern North Sea to have passed through Orkney in spring (Wernham et al. 2002). Ringing recoveries have linked England to both southern Greenland and Sweden. Purple Sandpipers have strong site fidelity both within and between winters, and do not tend to make movements over 8 km once on wintering grounds (Mittelhauser et al. 2012; Wernham et al. 2002).
Purple Sandpipers wintering in the UK are therefore likely to pass through waters to either the northwest or east, as indicated by the yellow shading on the above map. Around 10% to 20% of the total European wintering population winter in the UK and could be potentially at risk of collision with wind turbines in UK waters (depending on the size of the N Europe/W Siberia population which has a very broad estimate). An unknown proportion of the remainder may also be potentially at risk, depending on migration routes followed by birds coming from the northeast. However, a substantial proportion of the 11,000 Purple Sandpipers from the NE Canada and N Greenland population could be potentially at risk of collision in UK waters; perhaps as high as 96% assuming that no birds following this route bypass UK waters to the northeast, or even higher if any of the 465 Purple Sandpipers which winter in the Republic of Ireland (Burke et al. 2018) cross UK waters.
Timing of migration
Confidence: Medium
Purple Sandpipers from Norway arrive in eastern Britain from early to mid-July, and immediately begin moult (Wernham et al. 2002). Birds from Canada undergo moult elsewhere before arriving in Britain from late October (Forrester et al. 2007). This is reflected in varying patterns between regions in increased BirdTrack reporting rates in autumn (see Appendix 2), with a more protracted arrival on eastern coasts, and a double peak in the Forth and Tay region, and a hint of a double peak seen in Moray and eastern England. In contrast, peak migration in the west, including the Hebrides and northwest England, is during October and November. The BirdTrack data suggest that birds wintering in England and Wales begin northwards migration back to breeding grounds in March or April in England and Wales, with peak departures from Scotland occurring in April and May. Canadian breeders mainly depart in late May, with birds staging in both Iceland and Greenland departing earlier than birds that stage in Greenland only (Summers et al. 2014).
Purple Sandpiper are presumed to migrate from the late afternoon into the night, like other members of the Calidris genus (Gudmundsson, 1993; Howell et al. 2019), but no specific data are available.
Flight heights
Confidence: Low
There is no data on flight heights of migrating Purple Sandpiper. In the absence of flight height estimates, it is recommended that a precautionary assumption of 100% of birds at collision risk height is used.
Flight speeds
Confidence: Low
There is no data on flight speeds of migrating Purple Sandpiper. In the absence of such data, it is recommended that the flight speed estimated for Dunlin, as the most closely related species covered in this review, of 15.3 ± 1.9 m/s is used for the purposes of collision risk modelling.
Avoidance rates and behaviour
Confidence: Very Low
No macro-, meso- or micro-avoidance rates have been reported for this species. A low macro-avoidance rate of 0.28 has been reported for waders as a group, based on the percentage of radar tracks entering offshore wind facilities (Krijgsveld et al. 2011). However, post-construction monitoring data collected from onshore windfarms where wader species were observed suggests that avoidance rates are likely to be high (Table 5). Drawing from these data, for the purposes of collision risk modelling, the recommended value for all wader species is 0.999 ± 0.00003 (Table 5).
Snipe Gallinago gallinago
SPA Species? |
Yes (non-breeding population) |
|---|---|
SPA site codes (Introduction, Table 2) |
62 |
Population size breeding (UK) |
66,500 pairs (APEP4, 2020); uncertainty: high |
Population size non-breeding (UK) |
1,100,000 individuals (APEP4, 2020); uncertainty: high |
Population size (Biogeographic flyway, SPA season) |
1,100,000 individuals (faeroeensis); uncertainty: low 7,000,000 – 10,000,000 individuals (gallinago); uncertainty: low (Wetlands International, 2021) |
Percentage of biogeographic population at risk of collision in UK waters (passage / breeding / non-breeding) |
>21.0% (both races); uncertainty: high |
Movement of breeding birds
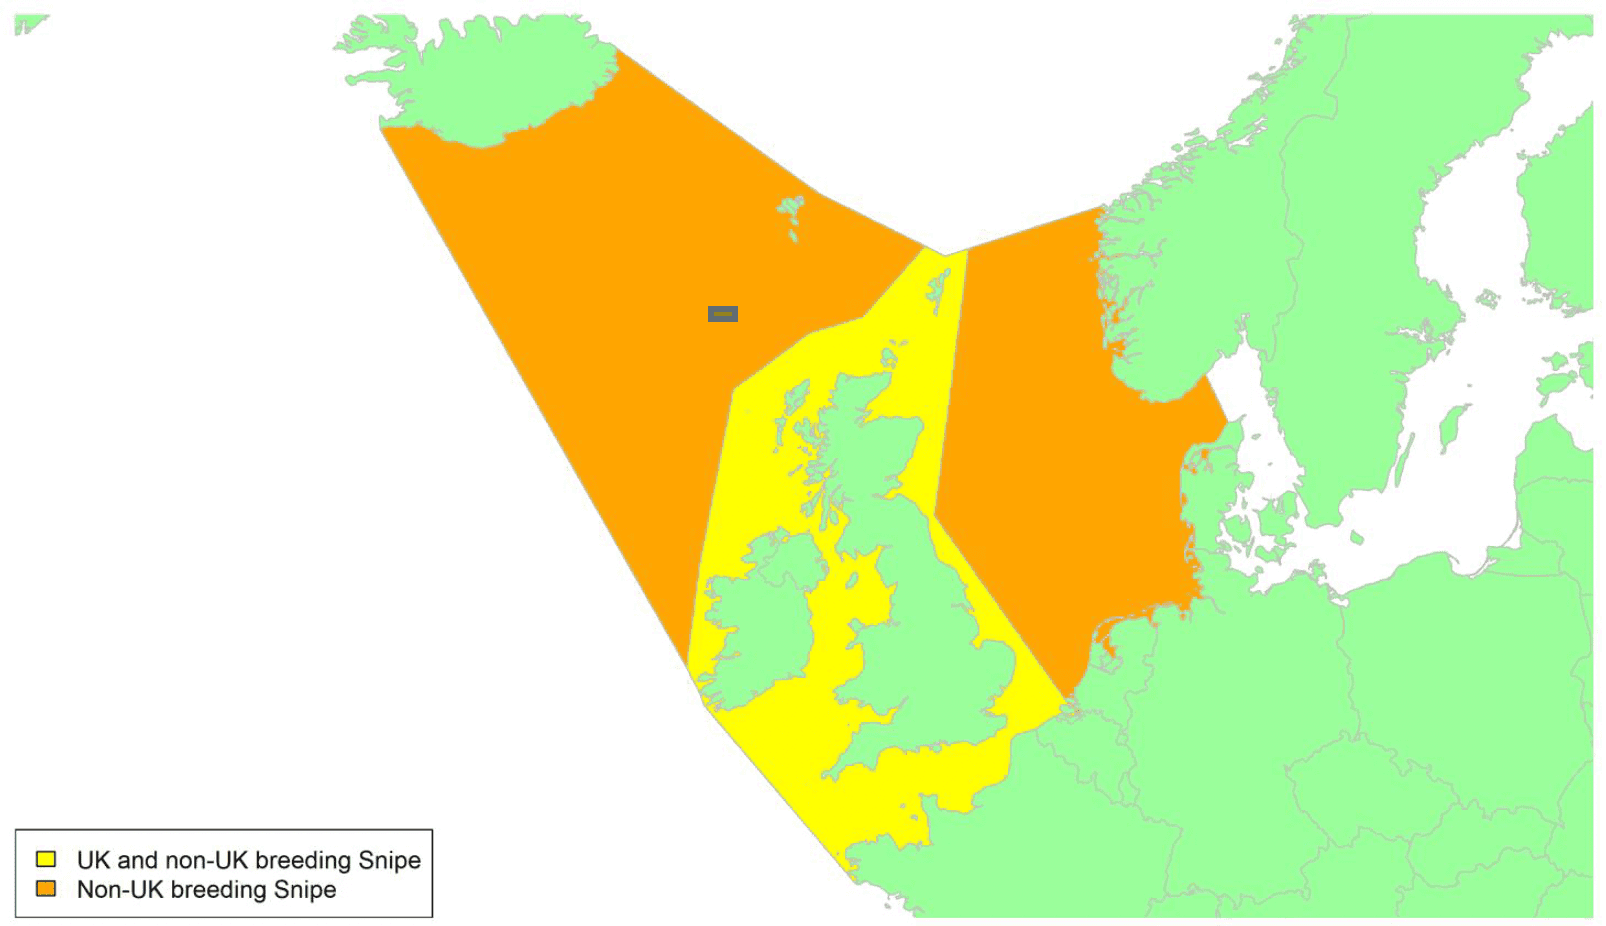
Movement of wintering birds
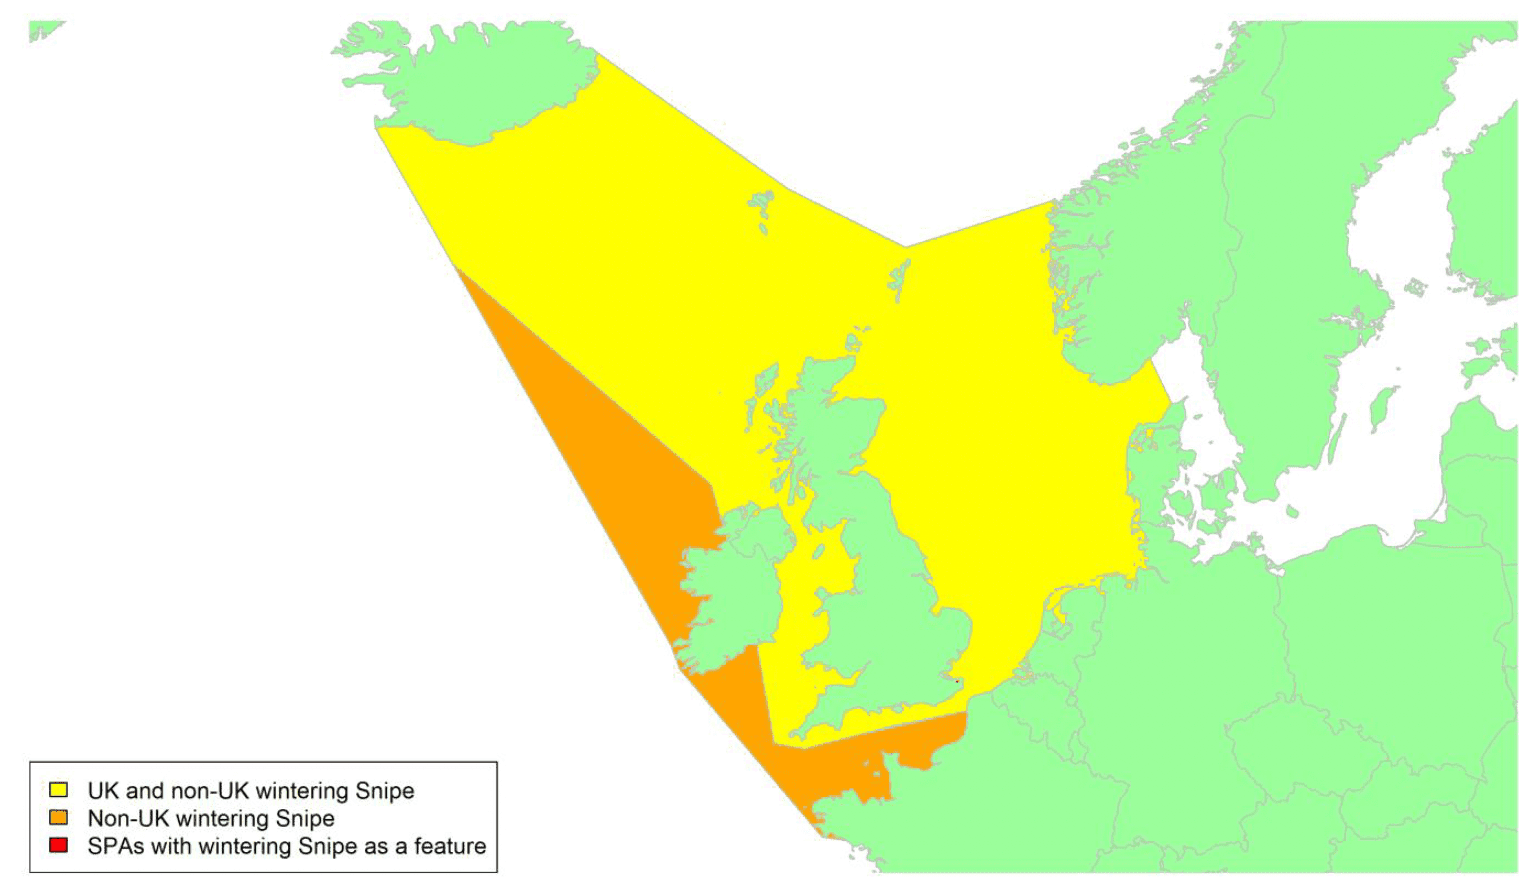
Migratory routes
Confidence: Low
Snipe breed throughout Europe with the nominate race occurring in most areas and faeroeensis in Iceland, the Faeroes, Orkney, and Shetland. Ringing and genetic studies suggest four migration flyways of Snipe in the Western Palearctic of which two include the UK: the northeast Atlantic Flyway, which involves faeroeensis that mostly winter in Britain and Ireland, and the northwest Europe Flyway, which includes individuals breeding in northern Russia, Fennoscandia, and the Baltic States that winter in northern France, Britain, Ireland, and northwest Africa (Svazas & Paulauskas, 2006).
Within the UK, breeding Snipe are widespread, particularly in the north. UK Snipe breeding populations are sedentary or partial migrants (Marchant, 2002). Snipe migrate in a southwesterly direction in the autumn (August to October) with some UK breeders crossing the Irish Sea to Ireland or the English Channel to continental Europe, with the waters they cross shown by yellow shading on the breeding map above. At the same time there is an influx of migrants from Iceland and northern Europe as well as some individuals from central Europe, with these individuals crossing the North and Irish Seas, and some continuing on from the UK across the English Channel (Minias et al. 2010; Wernham et al. 2002). Areas crossed by wintering birds are shown by yellow shading on the wintering map above, onward migrants also crossing the waters shown in orange.
There have been no new studies on UK breeding or wintering Snipe since Wright et al. (2012). Therefore, precise migration routes of Snipe are unknown, and all parts of UK waters must be considered as potential migration routes for this species unless evidence becomes available to show otherwise. It is thought that more than a million Snipe might migrate to winter in Britain and Ireland each year and are thus potentially at risk of collision with wind turbines in UK waters, a high proportion of the international population. Only one SPA is designated for Snipe in the UK, but this underplays the importance of the UK as an internationally important wintering area for this species, as it is widespread throughout the country rather than being concentrated in particular areas that can be designated as SPAs.
The proportion of the biogeographic population potentially at risk of collision with wind turbines in UK waters is at least 21%. This estimate assumes all faeroeensis pass through UK waters on migration, and that all UK breeding birds migrate overseas. Although these assumptions are unlikely to be correct, the estimate also does not take account of the unknown numbers of gallinago which migrate through UK waters from Fennoscandia and northern Russia to wintering grounds further south. Consequently, the proportion of the population at risk is likely to be higher than 21% and could possibly be substantially higher.
Timing of migration
Confidence: Low
Autumn migration of Snipe occurs between August and October with return migration during late March and April (Wernham et al. 2002). This is also reflected in the BirdTrack reporting rates for regions across the UK (see Appendix 2), which suggest that autumn migration of Snipe occurs between late July and mid-October, with reporting rates increasing over this period highlighting the influx of Snipe that winter in the UK. Outside of autumn, the BirdTrack reporting rates of Snipe in Scotland are inconsistent across regions, although at the country level reporting rates increase between mid-March and mid-May, reflecting some spring migration of Snipe returning to Scotland. In contrast, in England, Northern Ireland and Wales there is a more distinct decline in reporting rates during the spring between March and May.
Flight heights
Confidence: Low
No data were available on the flight heights of Snipe. In the absence of flight height data, it is recommended that a precautionary assumption of 100% of flights at collision risk height is made.
Flight speeds
Confidence: Medium
Flight speeds of Snipe have been estimated from two studies using radar. Based on radar data from 22 Snipe tracks in the Arctic/south Sweden, estimated mean airspeeds of 17.1 ± 2.7 SD m/s were reported (flapping flight only, Alerstam et al. 2007). The second study involved a single track, which gave an estimated mean airspeed of 15.5 m/s (Bruderer & Boldt, 2001).
It is recommended that a flight speed of 17.1 m/s ± 2.7 is assumed for the purposes of collision risk modelling, as this reflects the higher sample size of the two radar studies.
Avoidance rates and behaviour
Confidence: Very Low
No macro-, meso- or micro-avoidance rates have been reported for this species. A low macro-avoidance rate of 0.28 has been reported for waders as a group, based on the percentage of radar tracks entering offshore wind facilities (Krijgsveld et al. 2011). However, post-construction monitoring data collected from onshore windfarms where wader species were observed suggests that avoidance rates are likely to be high (Table 5). Drawing from these data, for the purposes of collision risk modelling, the recommended value for all wader species is 0.9996 ± 0.00002 (Table 5).
Red-necked Phalarope Phalaropus lobatus
SPA Species? |
Yes (breeding population) |
|---|---|
SPA site codes (Introduction, Table 2) |
122 |
Population size breeding (UK) |
64 males (APEP4, 2020); uncertainty: low |
Population size non-breeding (UK) |
n/a |
Population size (Biogeographic flyway, SPA season) |
2,000,000 – 3,200,000 individuals (Western Eurasia / Arabian Sea); uncertainty: high (Wetlands International, 2021) |
Percentage of biogeographic population at risk of collision in UK waters (passage / breeding / non-breeding) |
0.006%; uncertainty: high |
Movement of breeding birds
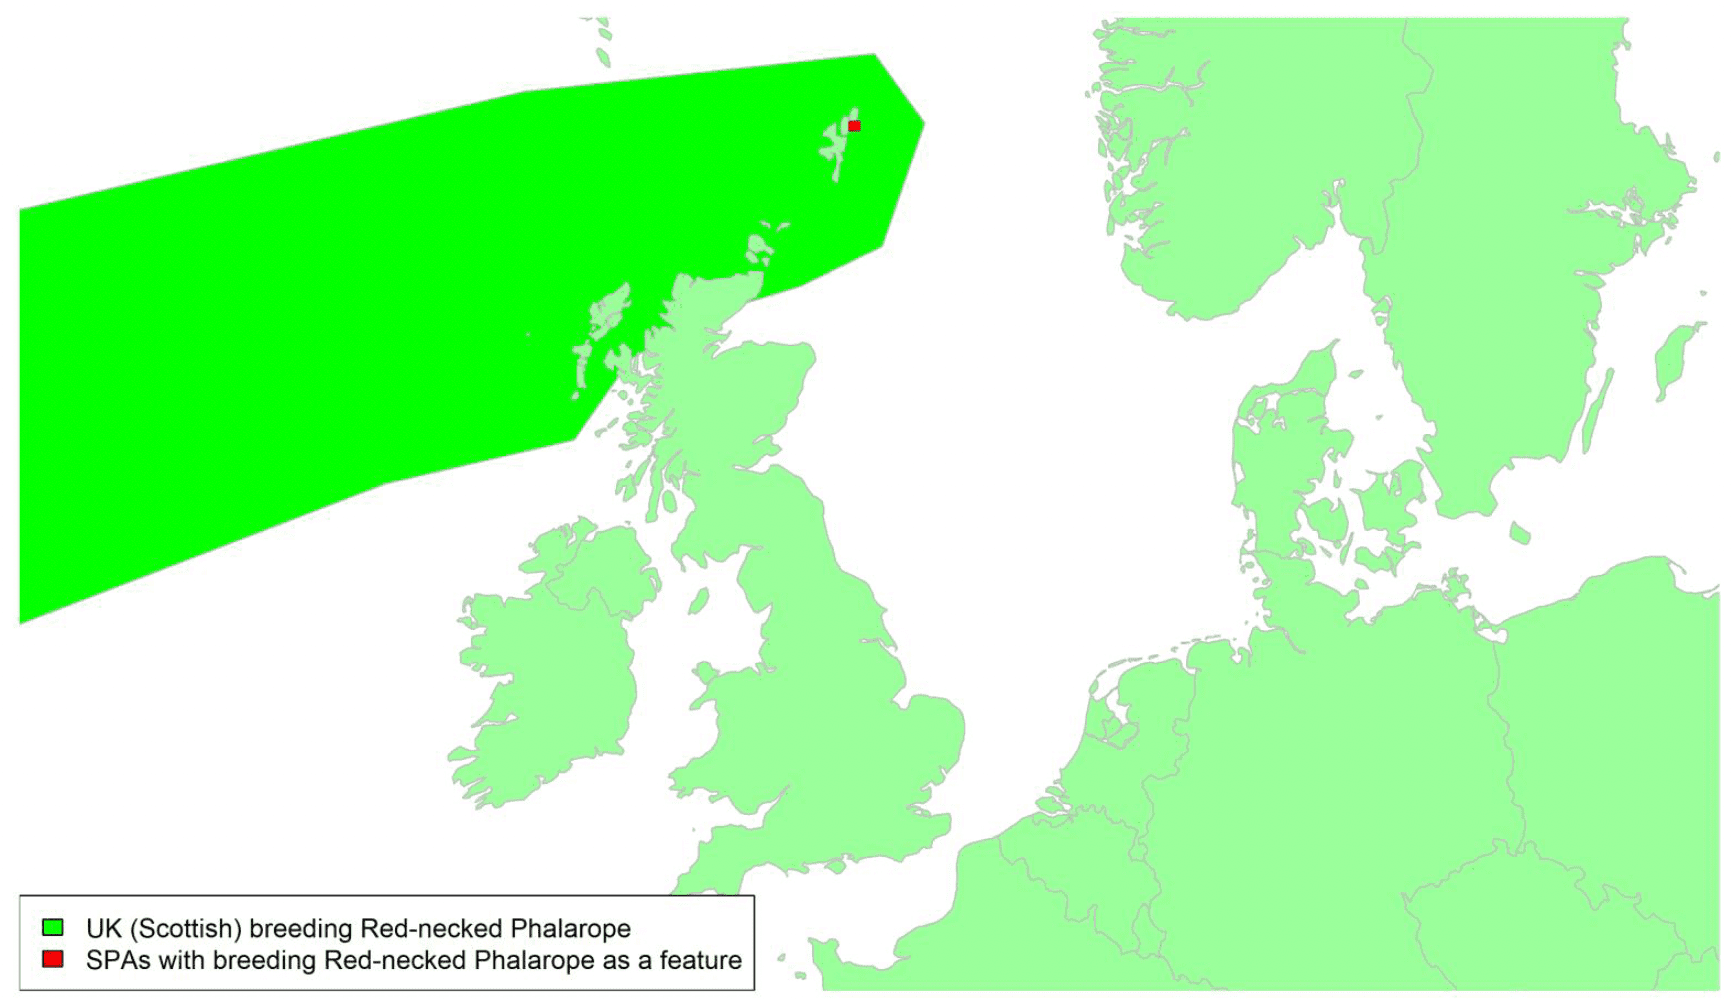
Migratory routes
Confidence: High
A small number of Red-necked Phalaropes breed in Scotland, which is at the southern edge of their circumpolar breeding distribution (Everett, 1971). Red-necked Phalaropes breeding in Scotland migrate west across the Atlantic in autumn to stage in the Bay of Fundy before heading south along the east coast of the USA and crossing from the Caribbean Sea to the Pacific to winter off the coast of Ecuador and Peru; with a similar return route in spring (based on geolocator data from three males breeding on Fetlar; Smith et al. 2014, 2018). This is a similar route that individuals breeding in Iceland and Greenland take, compared to those from Fennoscandia and Russia, which migrate, largely over land, to the Arabian Sea (van Bemmelen et al. 2019). The likely migration route used by most Red-necked Phalaropes breeding in Scotland is shown by the green shading on the map above. Small numbers of migrants do occur annually elsewhere in the UK, with a mean of 41 birds per annum recorded during 2010–2019 (White & Kehoe, 2021). Their origins are unclear, but they may be off-course migrants heading to or from breeding areas in Scotland or elsewhere.
The number of individuals that migrate through UK waters is thought to be small and therefore only a tiny fraction of the biogeographic population (less than 0.1%) could be potentially at risk of collision with wind turbines in UK waters.
Timing of migration
Confidence Medium
Spring passage occurs between mid-May and early June, mainly via the east coast. Autumn passage is from late June until September, again mainly via the east coast although some individuals also occur in the west. Based on a small number of Red-necked Phalarope deployed with geolocators on Fetlar, individuals left the breeding grounds between the 24 July and 1 August (n=3) and returned on 30 May and 1June (n=2; Smith et al. 2014, 2018). This is also reflected in the BirdTrack reporting rates (Appendix 2) which show spring migration in Scotland between early and late May, and autumn migration between late June and early August. In England and Wales, the BirdTrack reporting rates indicate a more pulsed spring and autumn migration (between early March and late June and mid-May and mid-October respectively).
Long-flights between staging areas, revealed by geolocator data from a single individual from Greenland, indicates that migration can occur at night (van Bemmelen et al. 2019)
Flight heights
Confidence: Low
There is only one study that has quantified the flight heights of Red-necked Phalarope, based on radar observations of one flock migrating through the Russian arctic during autumn, which reported a mean flight height of 283m, over land and sea (Alerstam & Gudmundsson, 2016). Based on these observations, it is recommended that a precautionary assumption of 100% of birds at collision risk height is made.
Flight speeds
Confidence: Low
Based on data from geolocators on Red-necked Phalaropes migrating between Scandinavia and the Arabian Sea, flight speeds ranged between 4.2 and 21.9 m/s, with a mean flight airspeed of 10.2 ± 3.9 SD m/s (based on 20 migration steps in autumn and spring from four individuals; van Bemmelen et al. 2016).
Based on radar data from a single Red-necked Phalarope track in the Arctic/south Sweden, an estimated mean airspeed of 13.1 m/s was reported (flapping flight only, Alerstam et al. 2007).
Based on these observations, it is recommended that a flight speed of 10.2 m/s ± 3.9 is assumed for the purposes of collision risk modelling, reflecting the greater sample size of the van Bemmelen et al. (2016) study.
Avoidance rates and behaviour
Confidence: Very Low
No macro-, meso- or micro-avoidance rates have been reported for this species. A low macro-avoidance rate of 0.28 has been reported for waders as a group, based on the percentage of radar tracks entering offshore wind facilities (Krijgsveld et al. 2011). However, post-construction monitoring data collected from onshore windfarms where wader species were observed suggests that avoidance rates are likely to be high (Table 5). Drawing from these data, for the purposes of collision risk modelling, the recommended value for all wader species is 0.9996 ± 0.00002 (Table 5).
Redshank Tringa totanus
SPA Species? |
Yes, breeding, and non-breeding populations |
|---|---|
SPA site codes (Introduction, Table 2) |
2:15:16:24:27:30:33:37:38:39:41:54:63:65:67:69:70:78:79:80:83:93:114:116:123:124:134:135:165:166:172:185:187:195:205:210 |
Population size breeding (UK) |
22,000 pairs (APEP4, 2020); uncertainty: medium |
Population size non-breeding (UK) |
100,000 individuals (APEP4, 2020); uncertainty: low |
Population size (Biogeographic flyway) |
66,000–67,000 individuals (totanus UK, breeding), 160,000–240,000 individuals (totanus N Europe, breeding), 310,000–450,000 individuals (totanus C & E Europe, breeding). 230,000 individuals (robusta) (Wetlands International, 2021) |
Percentage of biogeographic population at risk of collision in UK |
c.100% of robusta (non-breeding); uncertainty: high, Unknown (but low) proportion of GB&I totanus population; uncertainty: high, Unknown proportion of N Europe and C & E Europe totanus populations |
Movement of breeding birds
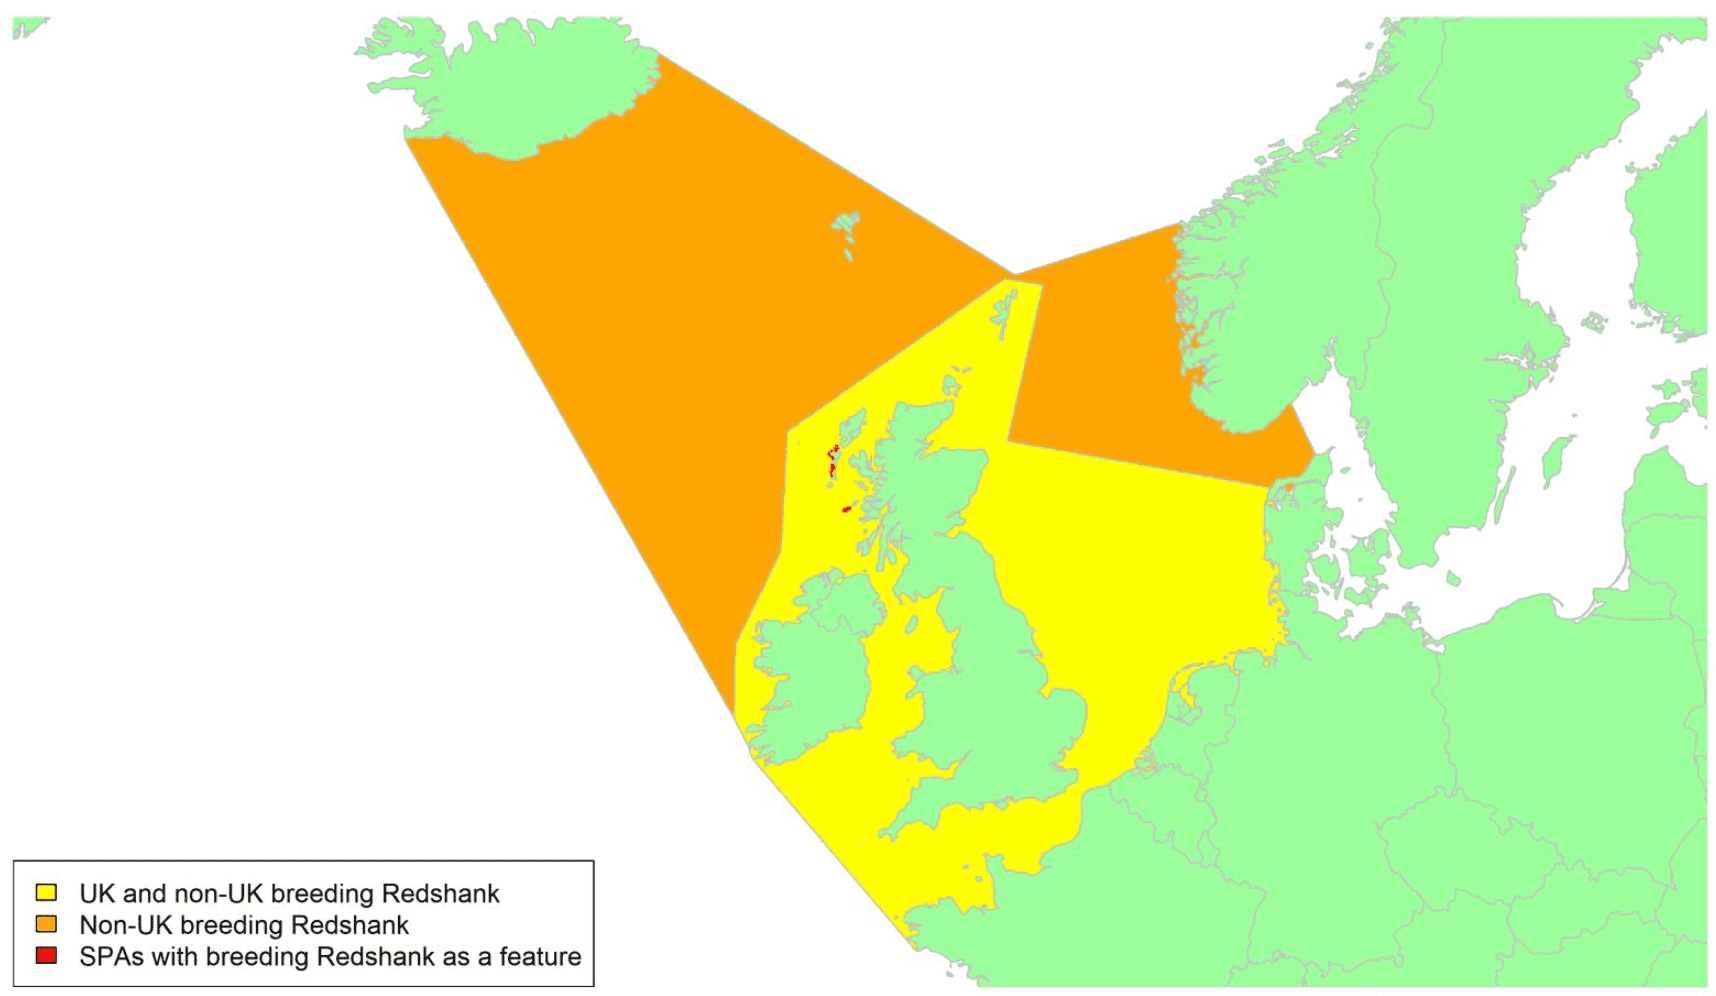
Movement of wintering birds
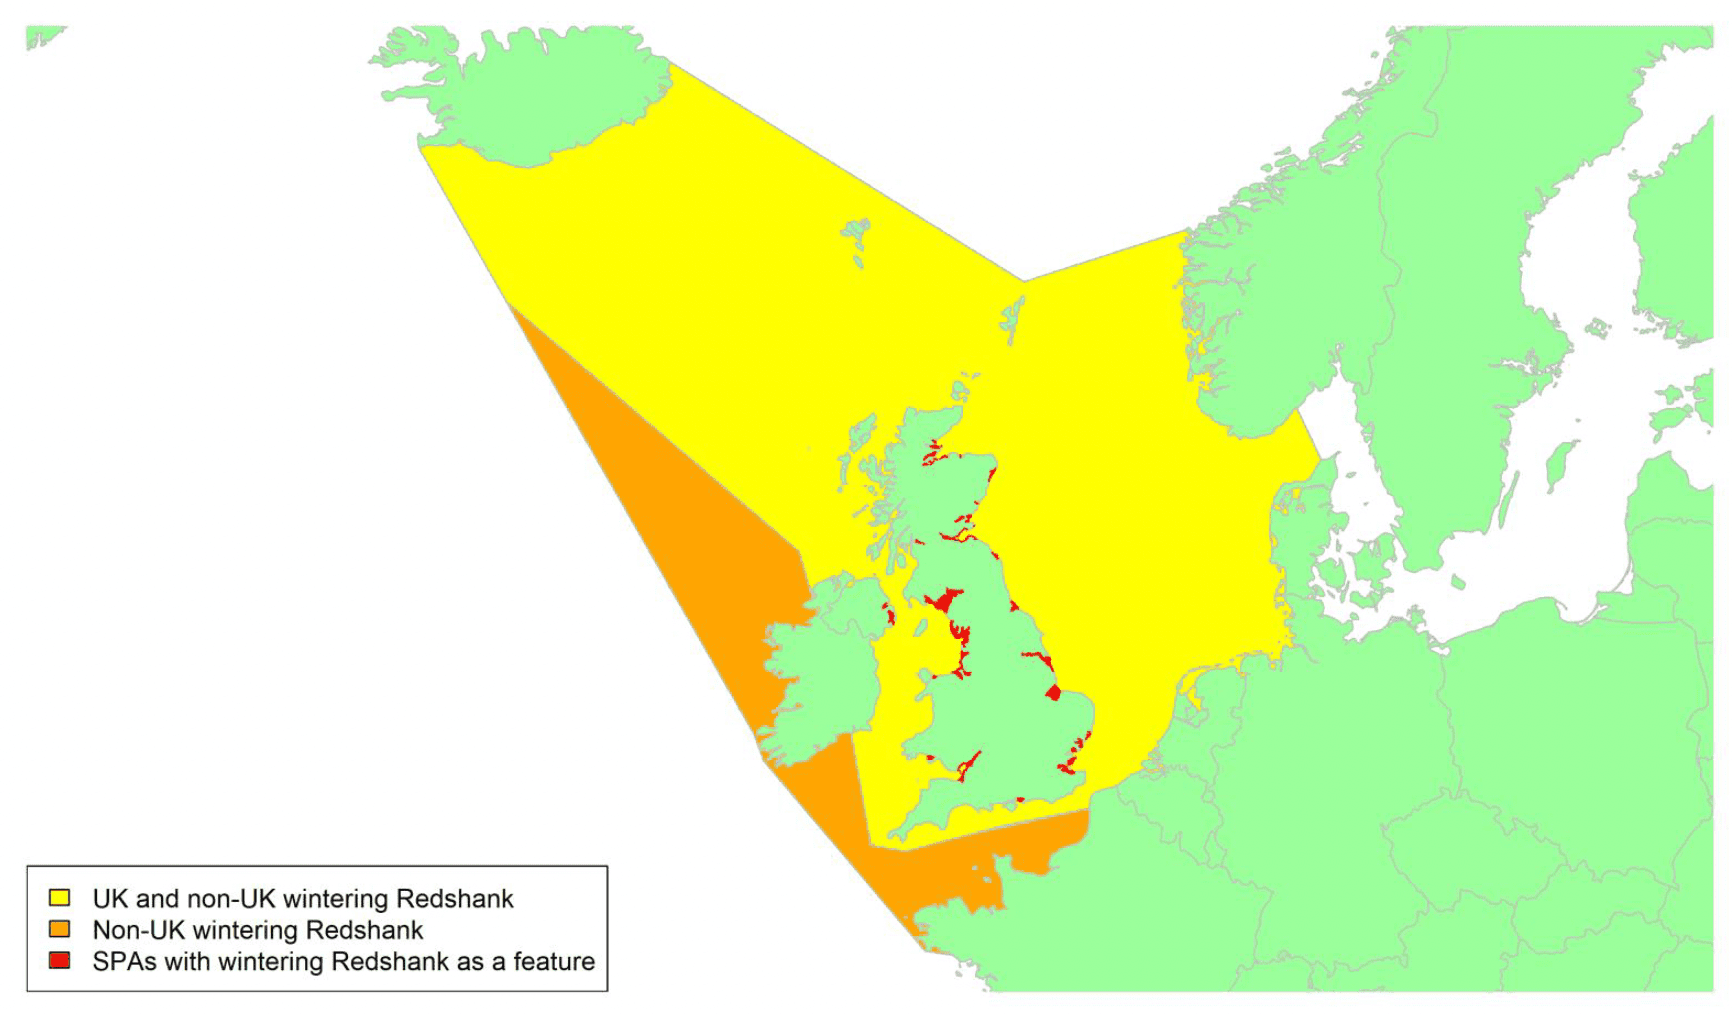
Migratory routes
Confidence: Low
The Redshank has a wide breeding distribution across temperate Eurasia with several sub-species. Two sub-species occur in Britain and Ireland, which is an important area for breeding, wintering, and passage Redshank. The western population of the nominate T. t. totanus breeds from Fennoscandia to the Urals and winters on the east Atlantic coast (Wernham et al. 2002). Three different breeding populations of totanus are recognised, in northern Europe, central and eastern Europe and Great Britain/Ireland (AEWA 2018), with the British and Irish population sometimes reported as a separate subspecies T. t. britannica. British and Irish breeding totanus are largely resident, though some birds migrate to the Atlantic coasts of France and occasionally Portugal (Wernham et al. 2002). Redshank breeding in the north of Britain migrate a greater distance south on average than those breeding in the south (Wernham et al. 2002). T. t. robusta mainly breeds in Iceland with small numbers on the Faeroes. Large numbers winter across Britain and Ireland, though some continue to the near continent or the Bay of Biscay (Wernham et al. 2002). Redshank from all four populations may cross UK waters to northwest France or coastal areas around the North Sea, mainly during peak migration times, and weather-induced movements across the southern North Sea can be made during winter (Wernham et al. 2002).
Most Redshank breeding in Britain will migrate south. Whilst many will remain in Britain, others may cross large parts of the North Sea, the Channel, the Irish Sea, and inland Scottish waters, as shown by the yellow shading on the breeding map. There will also be substantial movement of breeding birds from Iceland, that either winter in the UK or are on passage to breeding grounds further south, across waters to the northwest of Britain. Some movement across the North Sea is also likely for Fennoscandian breeders wintering in Britain, as shown the by yellow shading on the wintering map. However, there is no data on specific routes taken, and so broad migratory corridors must be assumed.
The vast majority proportion of birds from the Icelandic robusta population are likely to be potentially at risk of collision with wind turbines in UK waters, although some may bypass the UK and travel via the Republic of Ireland (or possibly bypass UK waters to the north). The proportion of the British and Irish population potentially at risk is likely to be low as most birds remain in the UK; however, as most birds winter in coastal areas it should be noted that a large proportion of this population would be potentially at risk from inshore wind farms. Migration routes of the other two totanus populations are poorly known and hence the proportion which could be at risk in UK waters is also not known.
Timing of migration
Confidence: Medium
Redshank breeding in Britain and Ireland return to their breeding grounds in March and April, and Icelandic breeders leave Britain and Ireland around the same time (Wernham et al. 2002). The BirdTrack graphs (see Appendix 2) confirm that migration begins in March, particularly in the south of the UK, but suggest some birds may still be leaving Britain during May. Peak spring movements are indicated by a decrease in BirdTrack reporting rates from March onwards in the southern English regions and Wales, and from mid-April until the end of May in northern England, Northern Ireland, and Scotland, as the large numbers of Icelandic breeders leave. Post-breeding, Icelandic Redshank start to arrive back in Britain on passage or to winter from late June. British breeders begin to leave their territories from June, moving to coastal areas where numbers build up from July onwards. Most leave the north of Britain for winter, with less than 10% remaining past December (Wernham et al. 2002). Peak autumn movements around the UK coasts can be inferred from an increase in BirdTrack reporting rates between mid-June and early August across most regions. Ongoing increases in reporting rates in several Scottish regions and in south-west England suggest that some arrivals and migratory movements continue into early September.
Most Redshank migration occurs at night (Hüppop et al. 2006) with peak activity likely to be one or two hours after sunset (Newton, 2010), but no specific data is available.
Flight heights
Confidence: Low
One study has reported flight heights of Redshank, wintering in southeast Asia and using two separate migratory pathways back to breeding grounds. Flight heights of nine birds was inferred using geolocator temperature data, which suggested flight heights of between 3000 and 5000 m (Li et al. 2020). Flight heights were also measured with GPS devices of both spring and autumn migrations, with eight birds making a trans-Himalayan crossing flying at a mean height of 1136 m (± 518 SD) and twelve birds circumventing the Himalayas flying at a mean height of 1140 m (± 452 SD; Li et al. 2020). However, none of these data are reflective of birds migrating over the sea. In the absence of such data, a precautionary estimate of 100% of birds at collision risk height should be assumed.
Flight speeds
Confidence: Medium
Two studies have reported flight speeds for Redshank. One used satellite tag and geolocators to measure flight speeds and reported mean groundspeeds of 15.3 m-s (± 4.1 SD) across 74 tracks made by ten birds migrating between southeast Asia and Russia (Li et al. 2020). Another ranefinder study reported mean airspeeds of 11.2 m-s (± 2.1 SD) for 11 birds departing on migratory flight from West Africa in spring, in climbing flight (Piersma et al. 1997). Reflecting the sample sizes of these studies and the measurements obtained using satellite tags and geolocators, a flight speed of 15.3 m/s ± 4.1 should be assumed for the purposes of collision risk modelling.
Avoidance rates and behaviour
Confidence: Very Low
No macro-, meso- or micro-avoidance rates have been reported for this species. A low macro-avoidance rate of 0.28 has been reported for waders as a group, based on the percentage of radar tracks entering offshore wind facilities (Krijgsveld et al. 2011). However, post-construction monitoring data collected from onshore windfarms where wader species were observed suggests that avoidance rates are likely to be high (Table 5). Drawing from these data, for the purposes of collision risk modelling, the recommended value for all wader species is 0.9996 ± 0.00002 (Table 5).
Wood Sandpiper Tringa glareola
SPA Species? |
Yes (breeding population) |
|---|---|
SPA site codes (Introduction, Table 2) |
96:107:180 |
Population size breeding (UK) |
30 pairs (APEP4, 2020); uncertainty: low |
Population size non-breeding (UK) |
0 (APEP4, 2020); uncertainty: low |
Population size (Biogeographic flyway, SPA season) |
1,300,000 – 1,800,000 individuals; uncertainty: high (Wetlands International, 2021) |
Percentage of biogeographic population at risk of collision in UK waters (passage / breeding / non-breeding) |
0.003% (UK breeders only); uncertainty: high Passage numbers unknown but likely <1% |
Movement of breeding birds
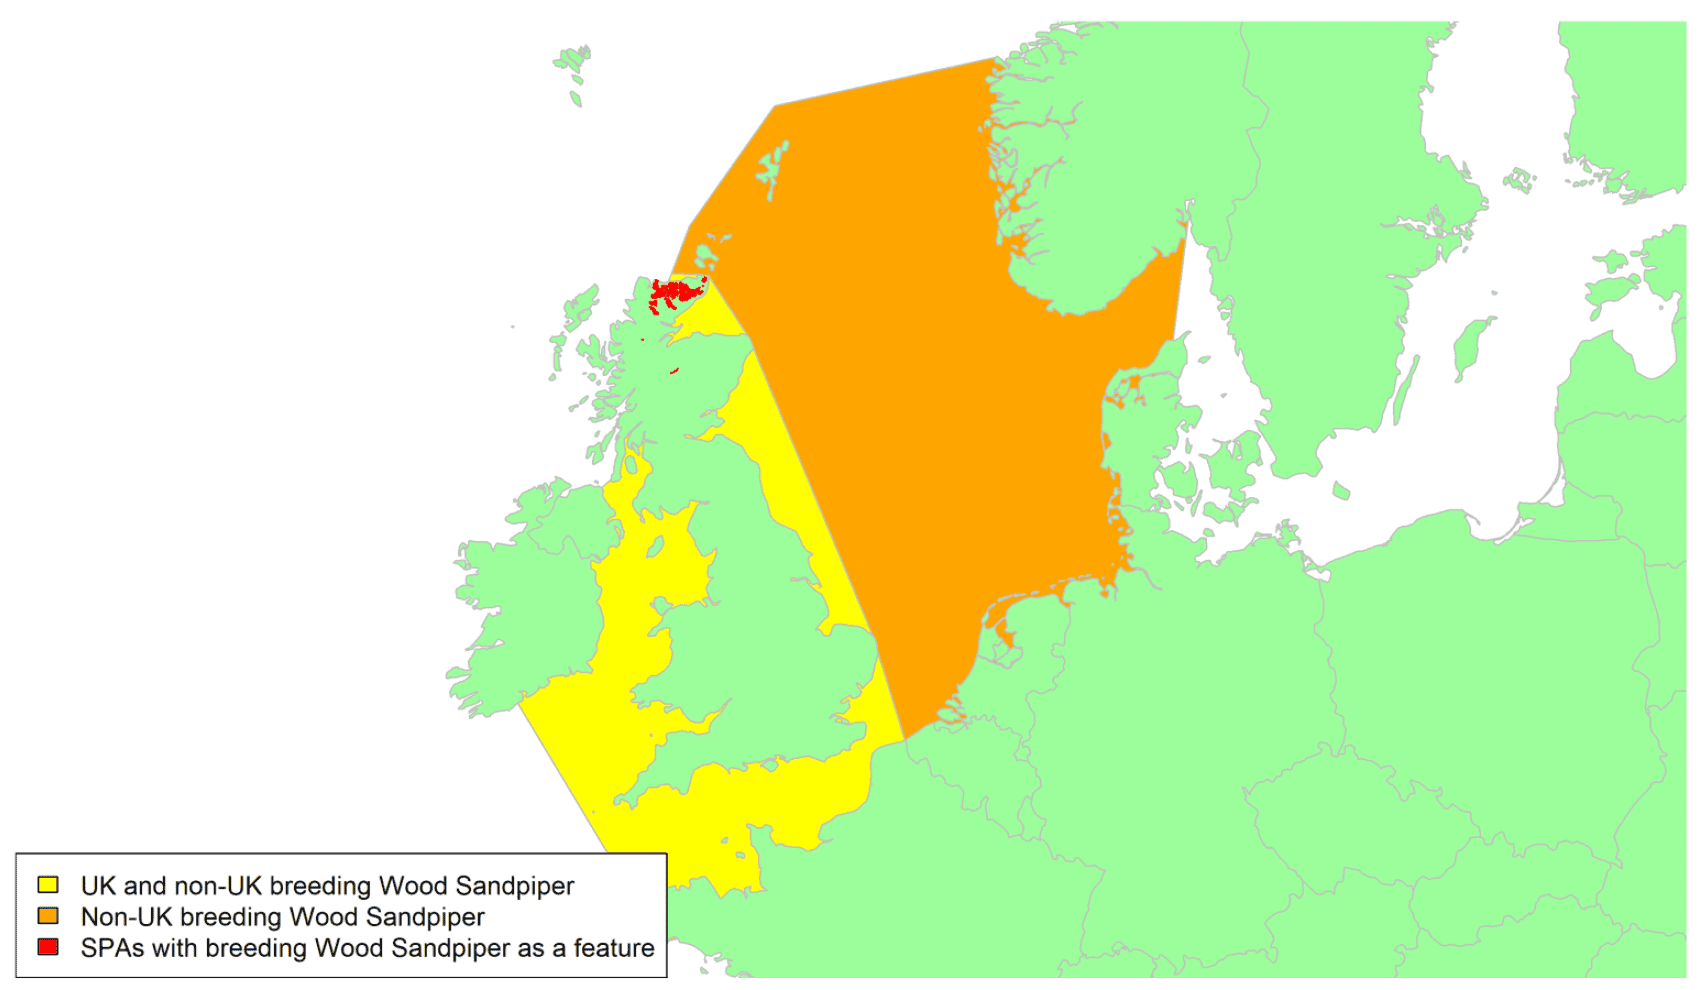
Migratory routes
Confidence: Low
Wood Sandpiper breeds across northern Eurasia, ranging from Scotland across Scandinavia to eastern Siberia. However, only a very small number of Wood Sandpiper breed in northern Scotland with the three SPAs probably containing the entire UK breeding population of around 30 pairs (APEP4). Wood Sandpipers breeding in Scotland winter in West Africa therefore migrate through the UK during spring and autumn. Three individuals tracked with light-level archival geolocators (two of which were tracked for two migration cycles), staged at one or more locations in western Europe during migration (Summers et al. 2021). UK breeding Wood Sandpipers most likely cross the English Channel and may possibly migrate across the other areas shaded in yellow on the above map. Small numbers of passage individuals breeding in Fennoscandia also occur and these birds will also cross the areas of water shown in orange. Wood Sandpiper are thought to migrate across Europe on a broad front (Van Gils et al. 2020), and passage numbers migrating across the UK are not known precisely but are small in terms of the biogeographic population. The proportion of the population which could be potentially at risk of collision with wind farms in UK waters is therefore likely to be less than 1%.
Timing of migration
Confidence: Medium
Wood Sandpipers arrive back on their Scottish breeding grounds in late April or early May (Chisholm, 2007). Autumn migration occurs between late June and August. The three Scottish breeding birds tracked with geolocators all departed from their breeding grounds between 18th June and 2nd July and returned between 29th March and 15th April (Summers et al. 2021). Based on the BirdTrack reporting rates of Wood Sandpipers across the UK (see Appendix 2), there is a pulse of spring migration between mid-April and mid-June. In some regions, there is also a small summer increase in reporting rates between mid-June and early August, which may involve breeders, or passage failed breeders from Fennoscandia. A larger pulse of autumn migration occurs between late August and early October, indicating a higher number of passage individuals in autumn compared to spring in the south and east of the UK.
Flight heights
Confidence: Low
No data are available on flight heights of Wood Sandpiper. In the absence of such data, it is recommended that a precautionary assumption of 100% of flights at collision risk height is made.
Flight speeds
Confidence: Low
Only one study has quantified flight heights of Wood Sandpiper, using radar data from three tracks in the Arctic / south Sweden, which estimated a mean airspeed of 9.6 ± SD 1.7 m/s (flapping flight only, Alerstam et al. 2007). Based on these data, a speed of 9.6 ± 1.7 m/s is recommended for the purposes of collision risk modelling.
Avoidance rates and behaviour
Confidence: Very Low
No macro-, meso- or micro-avoidance rates have been reported for this species. A low macro-avoidance rate of 0.28 has been reported for waders as a group, based on the percentage of radar tracks entering offshore wind facilities (Krijgsveld et al. 2011). However, post-construction monitoring data collected from onshore windfarms where wader species were observed suggests that avoidance rates are likely to be high (Table 5). Drawing from these data, for the purposes of collision risk modelling, the recommended value for all wader species is 0.9996 ± 0.00002 (Table 5).
Greenshank Tringa nebularia
SPA Species? |
Yes (breeding and non-breeding populations) |
|---|---|
SPA site codes (Introduction, Table 2) |
30:37:107:143 |
Population size breeding (UK) |
1100 pairs (APEP4, 2020); uncertainty: medium |
Population size non-breeding (UK) |
920 (APEP4, 2020); uncertainty: low >4,790 individuals (autumn passage); uncertainty: high |
Population size (Biogeographic flyway, SPA season) |
230,000 – 360,000 individuals; uncertainty: high (Wetlands International, 2021) |
Percentage of biogeographic population at risk of collision in UK waters (passage / breeding / non-breeding) |
1% breeding; uncertainty: high 0.3% wintering; uncertainty: high >2% passage; uncertainty: high |
Movement of breeding birds
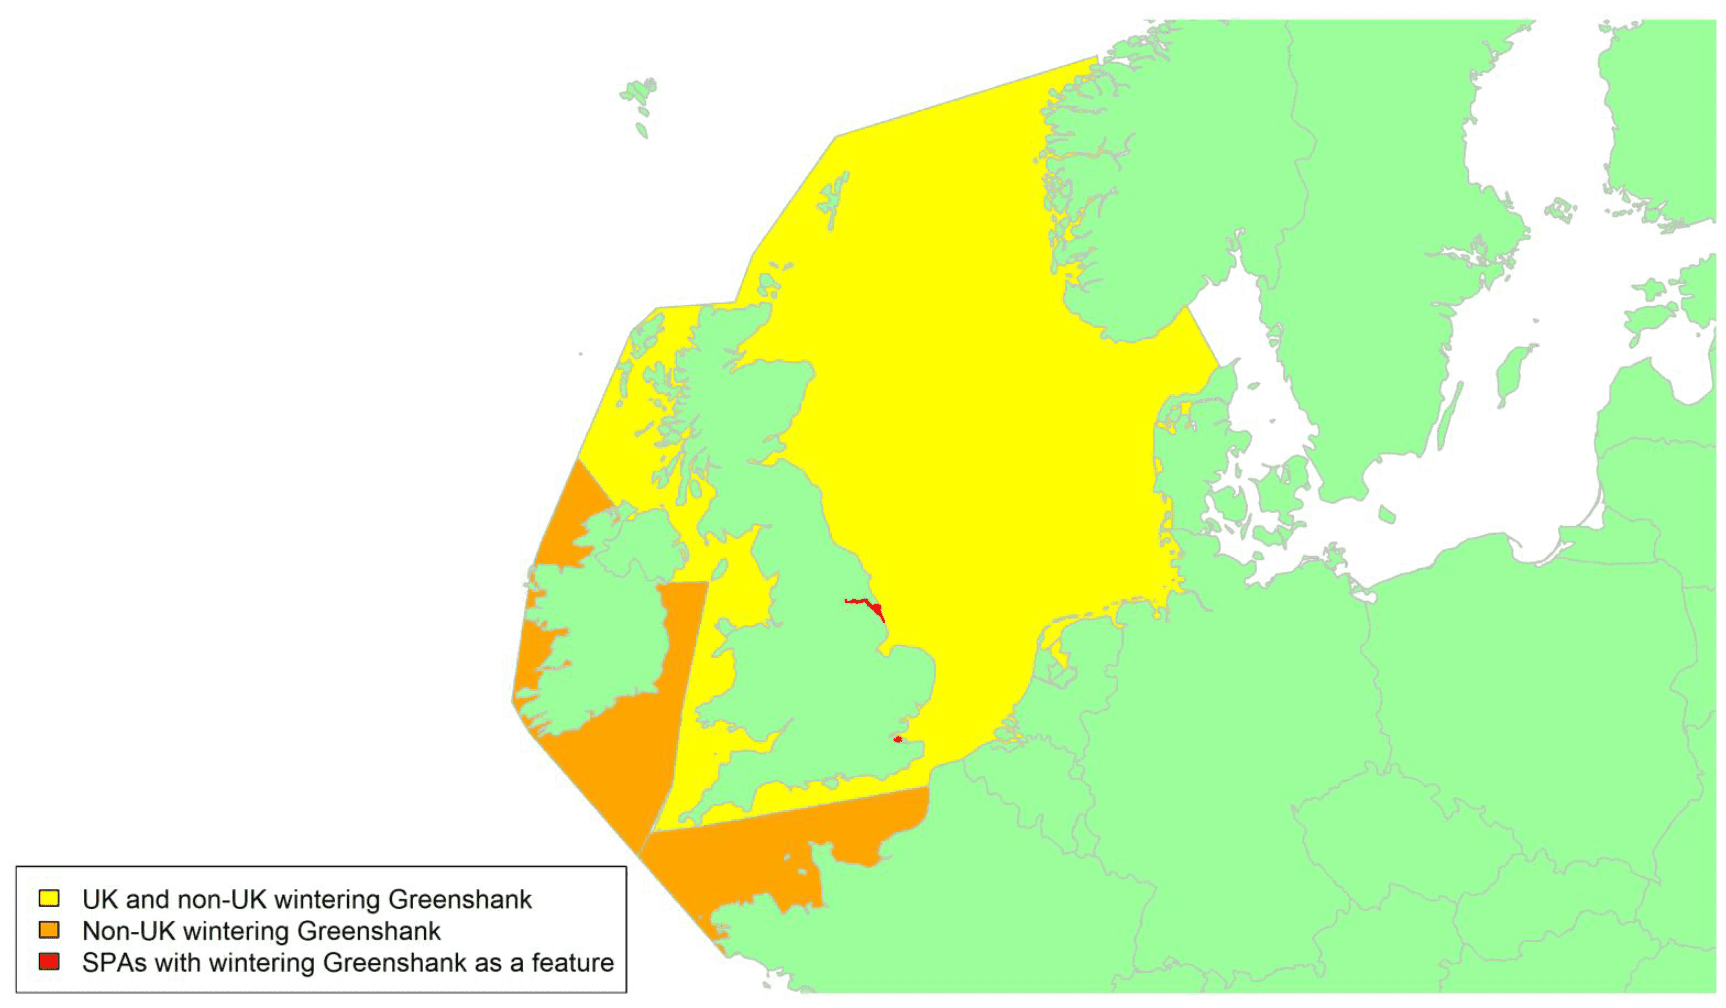
Migratory routes
Confidence: High
Greenshanks breed across the boreal zone of the Palearctic. In the UK, they are restricted to northwest Scotland, at the western edge of their breeding range. However, larger numbers occur throughout the UK and Ireland on passage migration during the autumn and spring. Greenshanks breeding in north Scotland largely migrate to Ireland but also to Wales, southern England and France (Summers et al. 2020a). Some individuals make short stopovers on their south and northwards migrations, including in southwest Scotland. Migration occurs over a broad front, therefore although passage is likely concentrated through coastal stopover sites (Van Gils et al. 2020), as passage birds occur all around the UK it must be assumed that they could migrate across any UK waters, as shown by the yellow shading on the above maps. Birds moving through the UK on route to breeding or wintering grounds elsewhere will also cross the orange shaded areas on the maps.
The passage population estimate in the table above is based on count data and therefore is an underestimate due to the turnover of individuals moving through sites. Despite this, however, it is probable that only a small proportion of the biogeographic population are likely to be potentially at risk of collision with wind turbines in UK waters. A maximum of 1% of the population breed in the UK and in addition to these birds a minimum of 2% of the population could be at risk on passage through UK waters.
Timing of migration
Confidence: Medium
Migrating Greenshanks depart their Scottish breeding grounds in June and July, and arrive back in March and April (based on six breeding individuals deployed with geolocators, Summers et al. 2020). This is also reflected in the BirdTrack reporting rates of Greenshank for regions in the south and east of England and Scotland as a whole (see Appendix 2), which suggest arrival of migrants occurs between early March and mid-April, followed by a decline in reporting rates between mid-April and mid-June as breeding individuals become more cryptic/move inland and passage individuals continue north. The autumn migration peak between mid-August and mid-October, notable across most regions of the UK, will likely include Scottish breeding Greenshank and passage individuals migrating south from Scandinavia. In other regions, particularly in Scotland, the pattern of reporting rates is less clear, likely due to low reporting rates and whether individuals are on passage, wintering or breeding in these areas.
Flight heights
Confidence: Low
No data are available on flight heights of Greenshank. In the absence of such data, a precautionary assumption of 100% of flights at collision risk height is recommended.
Flight speeds
Confidence: Medium
Two separate studies had low sample sizes but both suggested similar flight speeds for Greenshank. Based on radar data from five Greenshank tracks in the Arctic/south Sweden, a mean airspeed of 12.3 ± 3.3 SD m/s was reported (flapping flight only, Alerstam et al. 2007). Observations of climbing flight of seven individuals during spring in Mauritania provided a mean airspeed of 15.5 ± 3.66 m/s (Piersma et al. 1997). As the data reported in Piersma et al. (1997) reflect climbing flight and may not be representative of typical flight speeds, a flight speed of 12.3 ± 3.3 m/s is recommended for the purposes of collision risk modelling.
Avoidance rates and behaviour
Confidence: Very low
No macro-, meso- or micro-avoidance rates have been reported for this species. A low macro-avoidance rate of 0.28 has been reported for waders as a group, based on the percentage of radar tracks entering offshore wind facilities (Krijgsveld et al. 2011). However, post-construction monitoring data collected from onshore windfarms where wader species were observed suggests that avoidance rates are likely to be high (Table 5). Drawing from these data, for the purposes of collision risk modelling, the recommended value for all wader species is 0.9996 ± 0.00002 (Table 5).
Red-throated Diver Gavia stellata
SPA Species? |
Yes (breeding and non-breeding populations) |
|---|---|
SPA site codes (Introduction, Table 2) |
27:38:78:79:82:113:135:140:148:149:161:182: 198:200:206:207:224:226:227:230:231:245:249: 250 |
Population size breeding (UK) |
1,250 (1,000 – 1,550) pairs (APEP4, 2020); uncertainty: low |
Population size non-breeding (UK) |
21,500 individuals (APEP4, 2020); uncertainty: high |
Population size (Biogeographic flyway, SPA season) |
42,100 – 93,000 breeding pairs (Europe) (BirdLife International, 2015) 210,000–340,000 individuals; uncertainty: high (Wetlands International, 2021) |
Percentage of biogeographic population at risk of collision in UK waters (passage / breeding / non-breeding) |
1.0–3.6% (breeding); uncertainty: high 5%–10% (wintering); uncertainty: high |
Movement of breeding birds
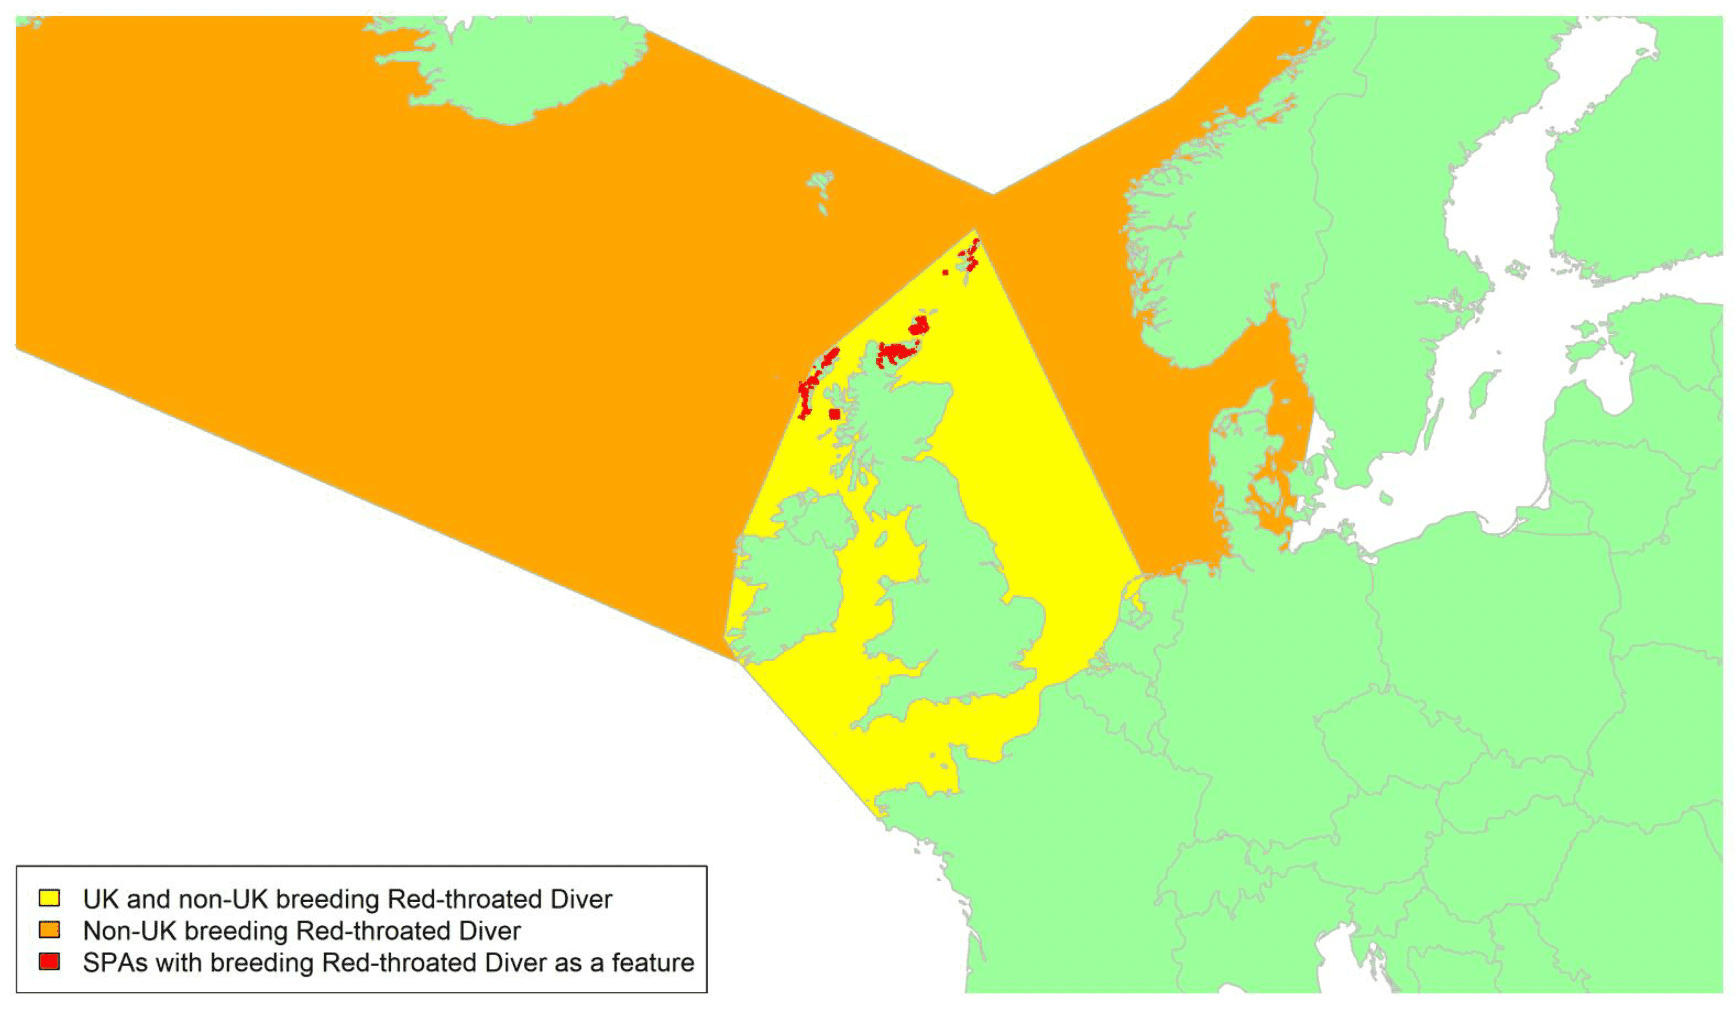
Movement of wintering birds
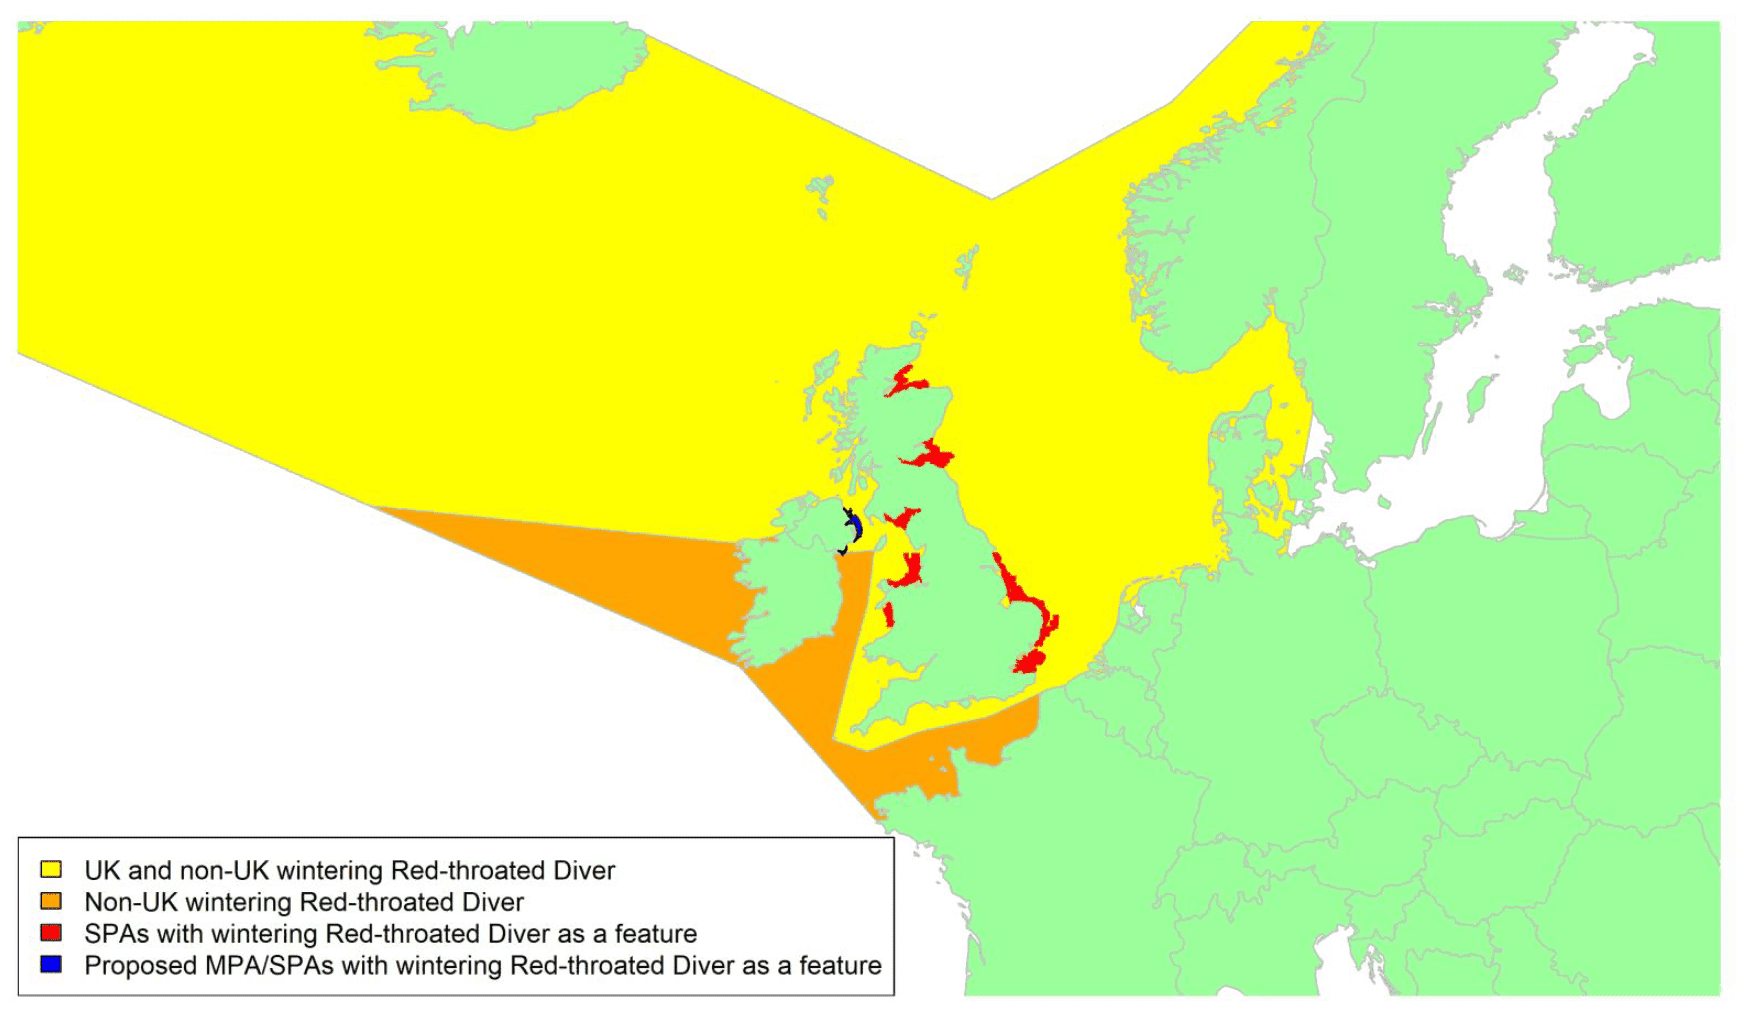
Migratory routes
Confidence: Low
The Red-throated Diver occurs across North America and northern Europe, breeding at high latitudes mostly above 60°N. The British and Irish population is one of the most southerly in the world and is almost entirely restricted to northern and western parts of Scotland, although a few pairs also breed in Co. Donegal in Ireland (Balmer et al. 2013). Red-throated Divers move south post-breeding, with British birds generally travelling shorter distances to wintering areas than birds breeding in more northerly areas, which can travel thousands of kilometres (McCloskey et al. 2018). Birds move furthest during their first winter, with some Scottish immatures moving as far as the Netherlands or the Atlantic coast of France (Forrester et al. 2007). Many Scandinavian birds winter in the southern North Sea, and birds from Greenland and Scandinavia have been found in southeast England, potentially associated with this important wintering area. British birds occupy a wide distribution around British and Irish coasts and are joined by significant numbers of migrants from more northerly areas (Forrester et al. 2007). In Britain, most of the main wintering areas are found along the east coast. Red-throated Divers are almost completely maritime in winter, preferring inshore waters with some shelter (Forrester et al. 2007).
Red-throated Divers could therefore move across almost all UK waters during the non-breeding season, shown on the wintering map, with Scottish birds joined by birds from further north indicated by the yellow shading. Most birds during the breeding season will be found on inshore waters off northern Scotland, with small foraging ranges of up to 9 km (Thaxter et al. 2012); these birds may then move south to winter, indicated by the yellow shading on the breeding map. Tracking data collected from Red-throated Divers on the east coast of the USA concluded the main risk to birds from offshore wind farms is during migratory movements, as during winter birds are concentrated in shallow protected inshore waters; this increases exposure to inshore wind farms however (Stenhouse et al. 2020).
Between 5% and 10% of the non-breeding biogeographic population could potentially be at risk of collision with wind turbines in UK waters. The wide range for this estimate is due to uncertainties around the size of the population.
Timing of migration
Confidence: Medium
Red-throated Divers are regularly seen on passage during sea watches. Peak movements in spring are during April and May, with large passage counts along the south coast of England and Scotland (Wernham et al. 2002). These birds are likely to be mainly migrants heading back to Fennoscandia, Greenland or Iceland, as most British birds will already be back on breeding territories by then. In autumn, peak movements are during late September to early November, with large passage counts off the east coast of Scotland (Forrester et al. 2007). Patterns in passage movements, and the restriction of Scottish breeders to north and west Scotland, account for the variation in BirdTrack reporting rates for the species across Scottish regions (see Appendix 2). The species does not breed in England and Wales and hence the BirdTrack graphs for these regions show a clearer pattern, with peak spring passage occurring in April and May in most regions and peak autumn passage between mid-August and mid-September. There is slight variability in some regions, e.g., autumn passage starts from mid-September in southeast and south-west England. The presence of a few breeding birds in the northwest of the Republic of Ireland may account for the less clear pattern shown in the Northern Ireland graph.
Most Red-throated Diver migration is likely to occur during the day, with migration rates peaking mid-morning and then decreasing throughout the afternoon (Kelley & Major, 2020). However, some movement may also occur at night (Heinänen et al. 2020).
Flight heights
Confidence: High
Several studies have recorded visual observations data of flight heights of Red-throated Divers, all finding that birds mainly fly at low altitudes. Red-throated Divers were observed to fly over the North Sea up to 25 m above sea level by Krüger et al. (2001), and generally below 30 m above sea level by Krijgsveld et al. (2011), particularly when flying into headwinds. Higher altitudes of between 60 and 100 m were reached during tailwind conditions (Krüger et al. 2001). Birds migrating over the Baltic Sea in winter had a mean altitude of 10.5 m, with a maximum height of 45 m (Krüger et al. 2001), while 28 birds migrating over the NW Atlantic had a mean altitude of 6.2 m (± 5.8 SD; Sadoti et al. 2005).
Using a modelled flight height distribution from a sample size of 9715 across 22 studies (Johnston et al 2014), the mean flight height for Red-throated Diver was 7.24m. The modelled proportion of Red-throated Diver flights at collision risk height (20-150m) from the same study was 0.02.
These data indicate that whilst flight heights of red-throated divers are typically low, there may be instances where birds fly higher, particularly during migration. Consequently, for the purposes of collision risk modelling during the migratory periods (but not more generally), it is recommended that a precautionary estimate of 25% of birds at collision risk height is used.
Flight speeds
Confidence: Medium
There is some data available on flight speeds of migrating Red-throated Divers. Radar tracking of birds flying in south Sweden and the Arctic recorded mean airspeeds of 18.6 m/s (± 3.9 SD) across 7 tracks (Alerstam et al. 2007), while theodolite measurements of birds flying in autumn in the Baltic found mean airspeeds of 20.6 m/s (± 1.5 SD) across 12 runs from six birds (Pennycuick et al. 2013).
As the data presented in Alerstam et al. (2007) is drawn from a slightly higher number of individuals, it is recommended that a flight speed of 18.6 m/s ± 3.9 be used for the purposes of collision risk modelling.
Avoidance rates and behaviour
Confidence: Medium
A strong macro-scale avoidance of offshore wind developments has been documented for Red-throated Divers across multiple studies throughout Europe (Dierschke et al. 2016). One study, combining digital aerial surveys and satellite telemetry, detected displacement effects up to 15km away from operational wind developments in the North Sea, with displacement distances shorter during the day than at night (Heinänen et al. 2020). A 'before-after' control impact analysis of the effects of shipping and offshore wind in the North Sea found similar patterns, with the abundance of Red-throated Divers (as counted by visual aerial and ship-based surveys) decreasing significantly as far as 16 km away from wind developments (Mendel et al. 2019). No meso- or micro-scale avoidance rates have been reported for divers.
In the absence of precise species or diver specific estimates, and given evidence for high levels of macro-avoidance, it is recommended that the all-species avoidance rate of 0.9954 ± 0.00002 is used for the purposes of collision risk modelling.
Black-throated Diver Gavia arctica
SPA Species? |
Yes (breeding and non-breeding populations) |
|---|---|
SPA site codes (Introduction, Table 2) |
76:99:107:136:139:141:143:151:158: 163:177:192:193:201 |
Population size breeding (UK) |
215 pairs (190 – 250; APEP4, 2020); uncertainty: low |
Population size non-breeding (UK) |
560 (APEP4, 2020); uncertainty: high |
Population size (Biogeographic flyway, SPA season) |
53,800 – 87,800 breeding pairs (Europe only, breeding); uncertainty: high (BirdLife International, 2015) 390,000 – 590,000 individuals; uncertainty: medium (Europe; Wetlands International, 2021) |
Percentage of biogeographic population at risk of collision in UK waters (passage / breeding / non-breeding) |
0.2%–0.4% (breeding): uncertainty: low >0.2% (wintering); uncertainty: high |
Movement of breeding birds
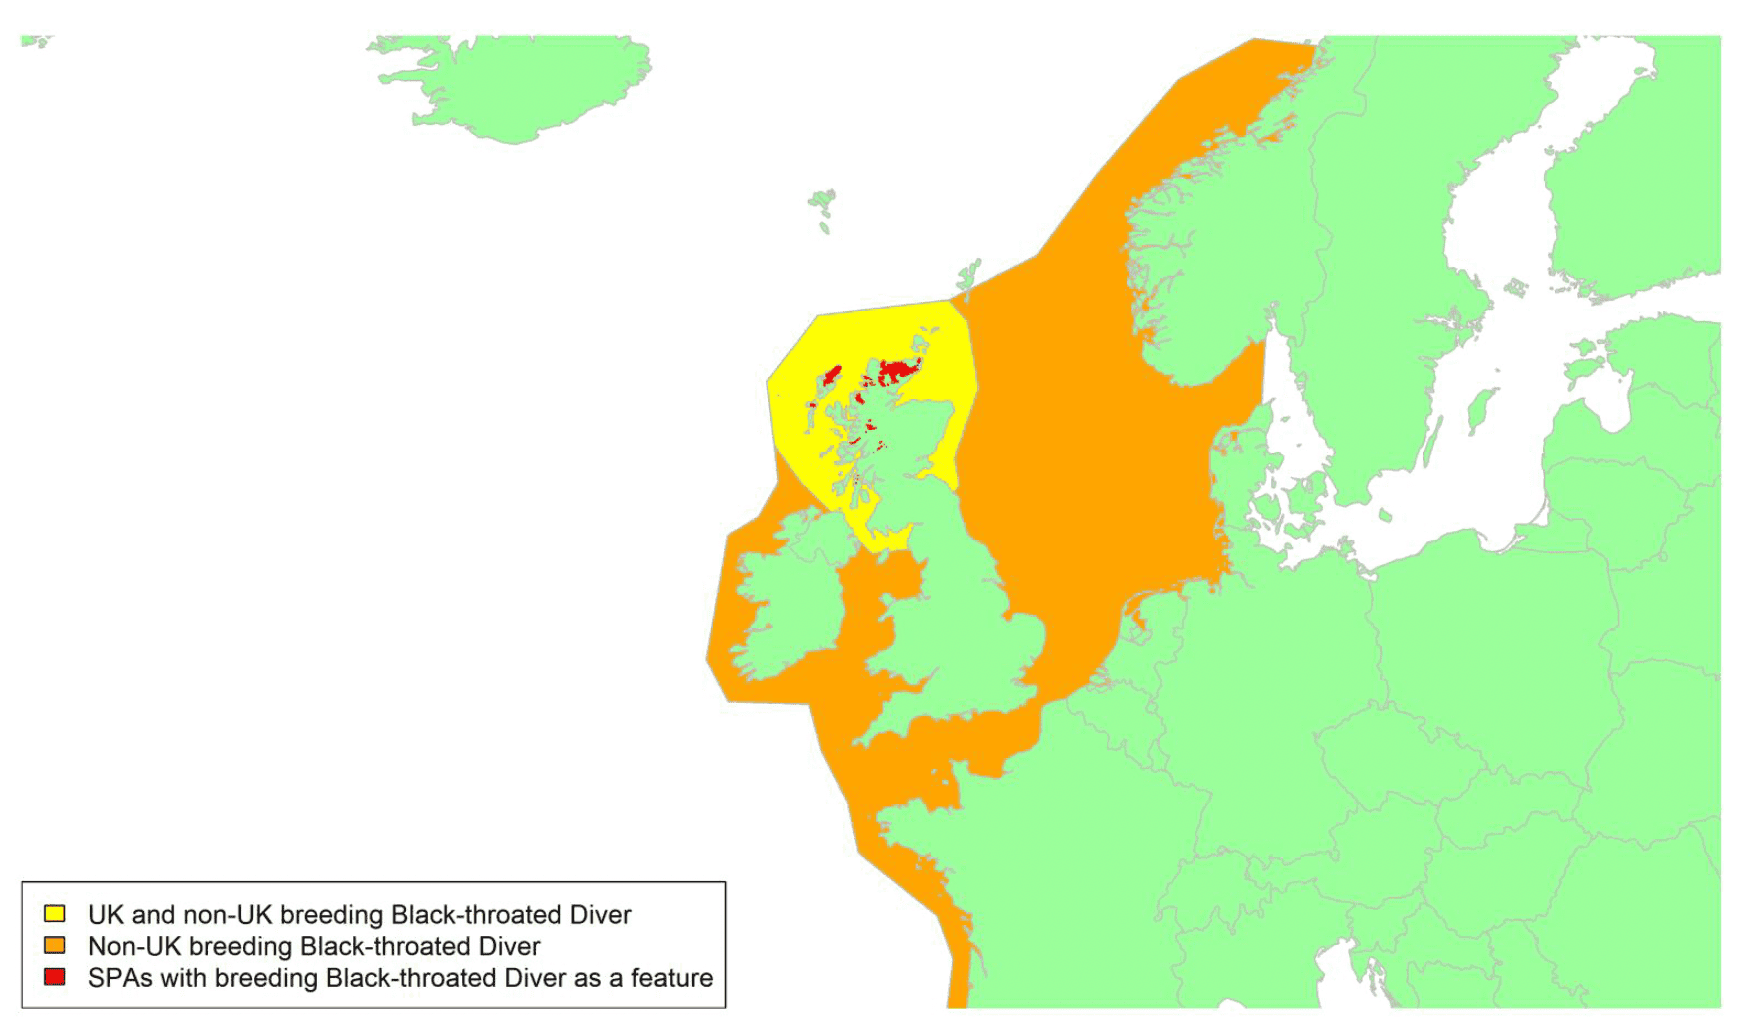
Movement of wintering birds
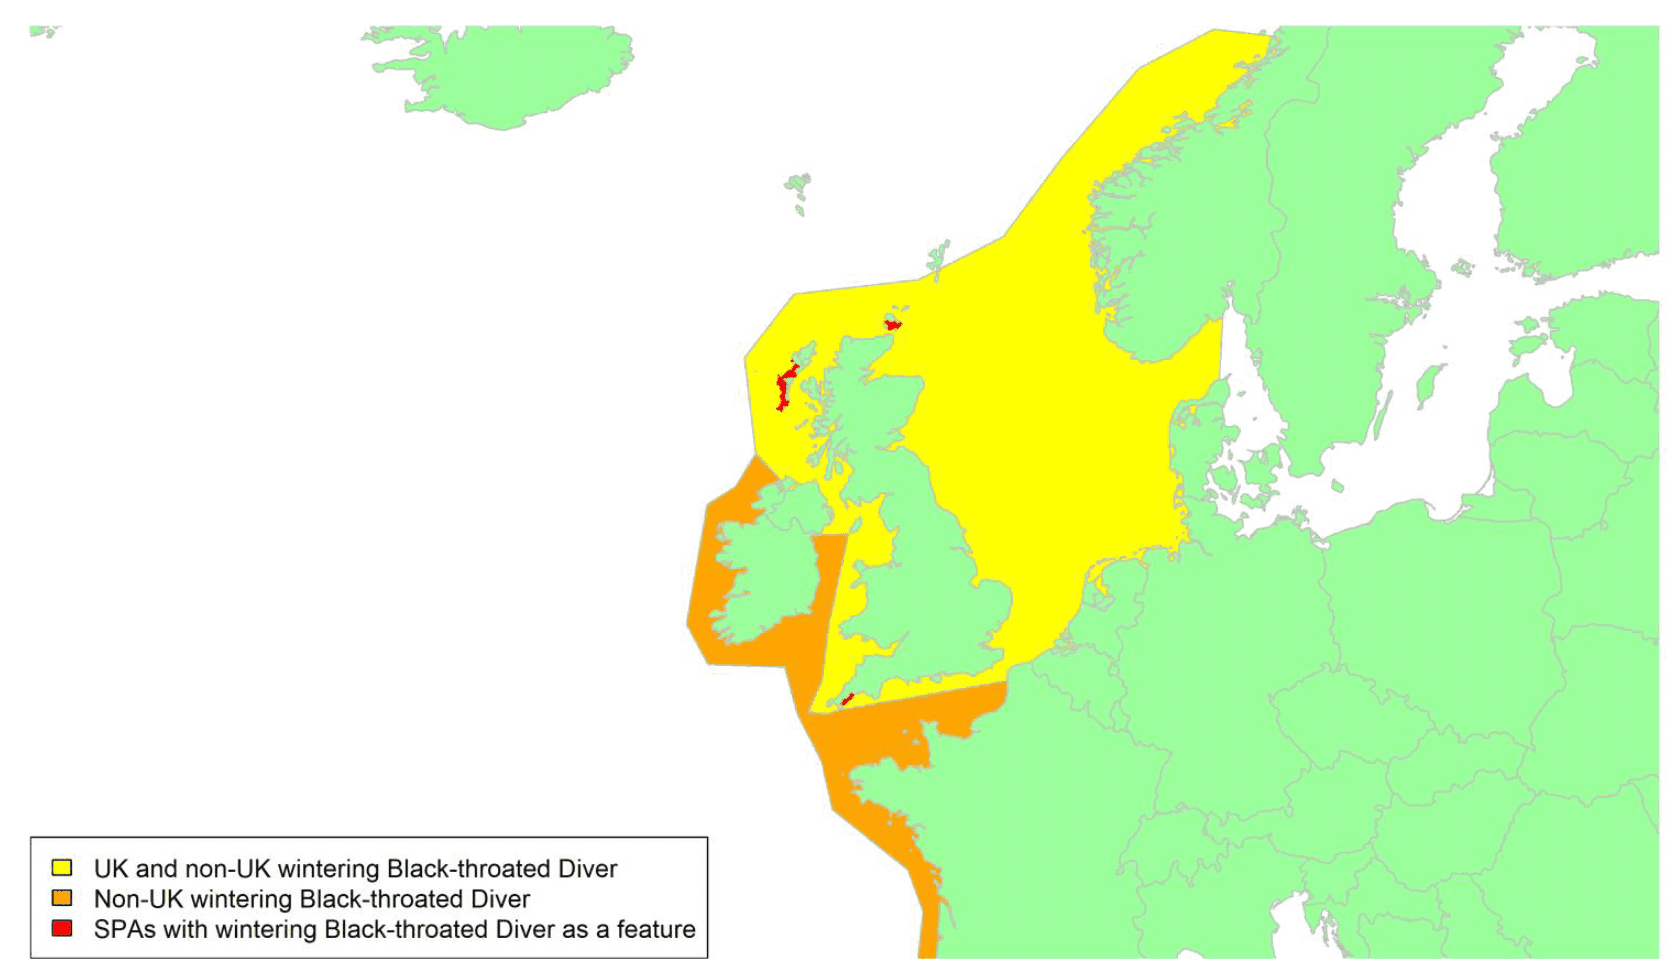
Migratory routes
Confidence: Low
The Black-throated Diver occurs across northern Europe, with a breeding range extending from Scotland in the west to northern Siberia in the east. In Britain, the Black-throated Diver is a scarce breeder, restricted to northern and western parts of Scotland (Wernham et al. 2002; Forrester et al. 2007). Very little is known about the movements of birds breeding in Scotland, as there have been no ringing recoveries (and very few birds ringed). In late summer, birds congregate in flocks at coastal areas near breeding strongholds in the Highlands and Outer Hebrides/Na h-Eileanan Siar, before dispersing to wintering areas (Forrester et al. 2007). Small numbers of Black-throated Divers winter at inshore coastal waters around Britain and Ireland, with birds present at coastal areas near the main breeding areas all year round apart from the early summer. These are likely to be mainly Scottish breeders, as well as some birds from Fennoscandia. Some Scottish breeders may make longer-distance migratory movements to winter further south, perhaps as far as France (Forrester et al. 2007). The majority of the Fennoscandian population migrate south to the Black Sea, eastern Mediterranean and Baltic Sea, with some migrating south-west to the southern North Sea, English Channel and Atlantic coast of France. Observations in Scotland suggest that only small numbers move through Orkney (Forrester et al. 2007) and consequently that the majority of birds seen in UK waters are most likely to be from the UK breeding and wintering populations rather than passage birds.
Potential movements of Black-throated Divers during the breeding season are therefore likely to be restricted to northern and western Scotland, as indicated by the yellow shading on the breeding season map above. UK breeding birds will also be mostly restricted to this area during winter, although it is possible that small numbers do move further south. Wintering Black-throated Divers from Fennoscandia could move across almost all UK waters during the non-breeding season, as indicated by the yellow shading on the non-breeding map. However, the lack of ringing and tracking data means our understanding of migratory movements is very poor, and there is a low confidence associated with these predictions.
Black-throated Diver are scarce in UK waters during both the breeding and non-breeding seasons, and consequently less than 1% of the biogeographic population could potentially be at risk of collision with wind farms in UK waters.
Timing of migration
Confidence: Medium
Black-throated Divers begin to move away from their breeding grounds in July and August, congregating at favoured coastal areas before dispersing to wintering areas from September to early November (Forrester et al. 2007). Birds then return to their Scottish breeding grounds during April (Wernham et al. 2002). There are no clear patterns in peak BirdTrack reporting rates for Black-throated Divers in Scotland (see Appendix 2), likely due to low densities of Black-throated Divers in coastal wintering areas (there are rarely more than two or three individuals together) and the restricted range of Scottish breeders. Coastal movements are not well understood. Elsewhere in the UK, the BirdTrack data suggest that peak spring migration occurs between mid-February and late April to mid-May and autumn migration between late August and November. Movement patterns and timings may vary slightly between the different English regions, but any apparent differences should perhaps be treated with caution due to the low reporting densities for this species.
Most Black-throated Diver migration is likely to occur during the day, with migration rates peaking mid-morning and then decreasing throughout the afternoon, as found for other divers; but no specific information is available for this species (Kelley and Major, 2020). Some movement may also occur at night.
Flight heights
Confidence: Medium
There is very little species-specific data on flight heights of Black-throated Divers; however, they are consistent with data on other diver species. One study, based on visual estimations in the Baltic recorded median flight heights for Black-throated Divers of 5 to 10 m (Garthe and Hüppop, 2004). Flight heights of other migrating diver species in the North Sea were found to be generally below 30 m above sea level, but birds flew at higher altitudes during tailwind situations (Krijgsveld et al. 2011; Krüger & Garthe, 2001). Using a modelled flight height distribution from a sample size of 126 across seven studies (Cook et al. 2012), the mean flight height for Black-throated Diver was 7.98m. The modelled proportion of Black-throated Diver flights at collision risk height (20-150m) from the same study was 0.001. Given the low recorded flight heights for other diver species, for the purposes of assessing collision risk to migrating birds, an assumption of 25% of birds at collision risk height would reflect a realistic, precautionary value.
Flight speeds
Confidence: Low
There is very little data available on flight speeds of migrating Black-throated Divers. Radar tracking of birds flying in south Sweden and the Arctic recorded mean airspeeds of 19.3 m-s (± 2.1 SD) across 13 tracks (Alerstam et al. 2007). It is recommended that a speed of 19.3 m/s ± 2.1 be used for the purposes of collision risk modelling.
Avoidance rates and behaviour
Confidence: Medium
A strong macro-scale avoidance of offshore wind developments has been documented for divers across multiple studies throughout Europe (Dierschke et al. 2016). These studies are mostly based on Red-throated Divers, but behaviour of divers in studies where both Red- and Black-throated Divers are included is highly consistent, suggesting that Black-throated Divers will also strongly avoid wind facilities. Avoidance rates of 0.9 and 0.68 for divers as a group were calculated respectively from analysis of density data collected using ship-based surveys and from panorama scans of birds inside and outside wind farms (Welcker & Nehls, 2016; Krijgsveld et al. 2011). No meso- or micro-scale avoidance rates have been reported for divers.
In the absence of precise species or diver specific estimates, and given evidence for high levels of macro-avoidance, it is recommended that the all-species avoidance rate of 0.9954 ± 0.00002 is used for the purposes of collision risk modelling.
Great Northern Diver Gavia immer
SPA Species? |
Yes (non-breeding) |
|---|---|
SPA site codes (Introduction, Table 2) |
76:197:198:199:200:201 |
Population size breeding (UK) |
n/a |
Population size non-breeding (UK) |
4,400 individuals (APEP4, 2020); uncertainty: high |
Population size (Biogeographic flyway, SPA season) |
8,600 - 11,000 individuals (Europe); uncertainty: medium |
Percentage of biogeographic population at risk of collision in UK waters (passage / breeding / non-breeding) |
c.88%–100%; uncertainty: medium |
Movement of wintering birds
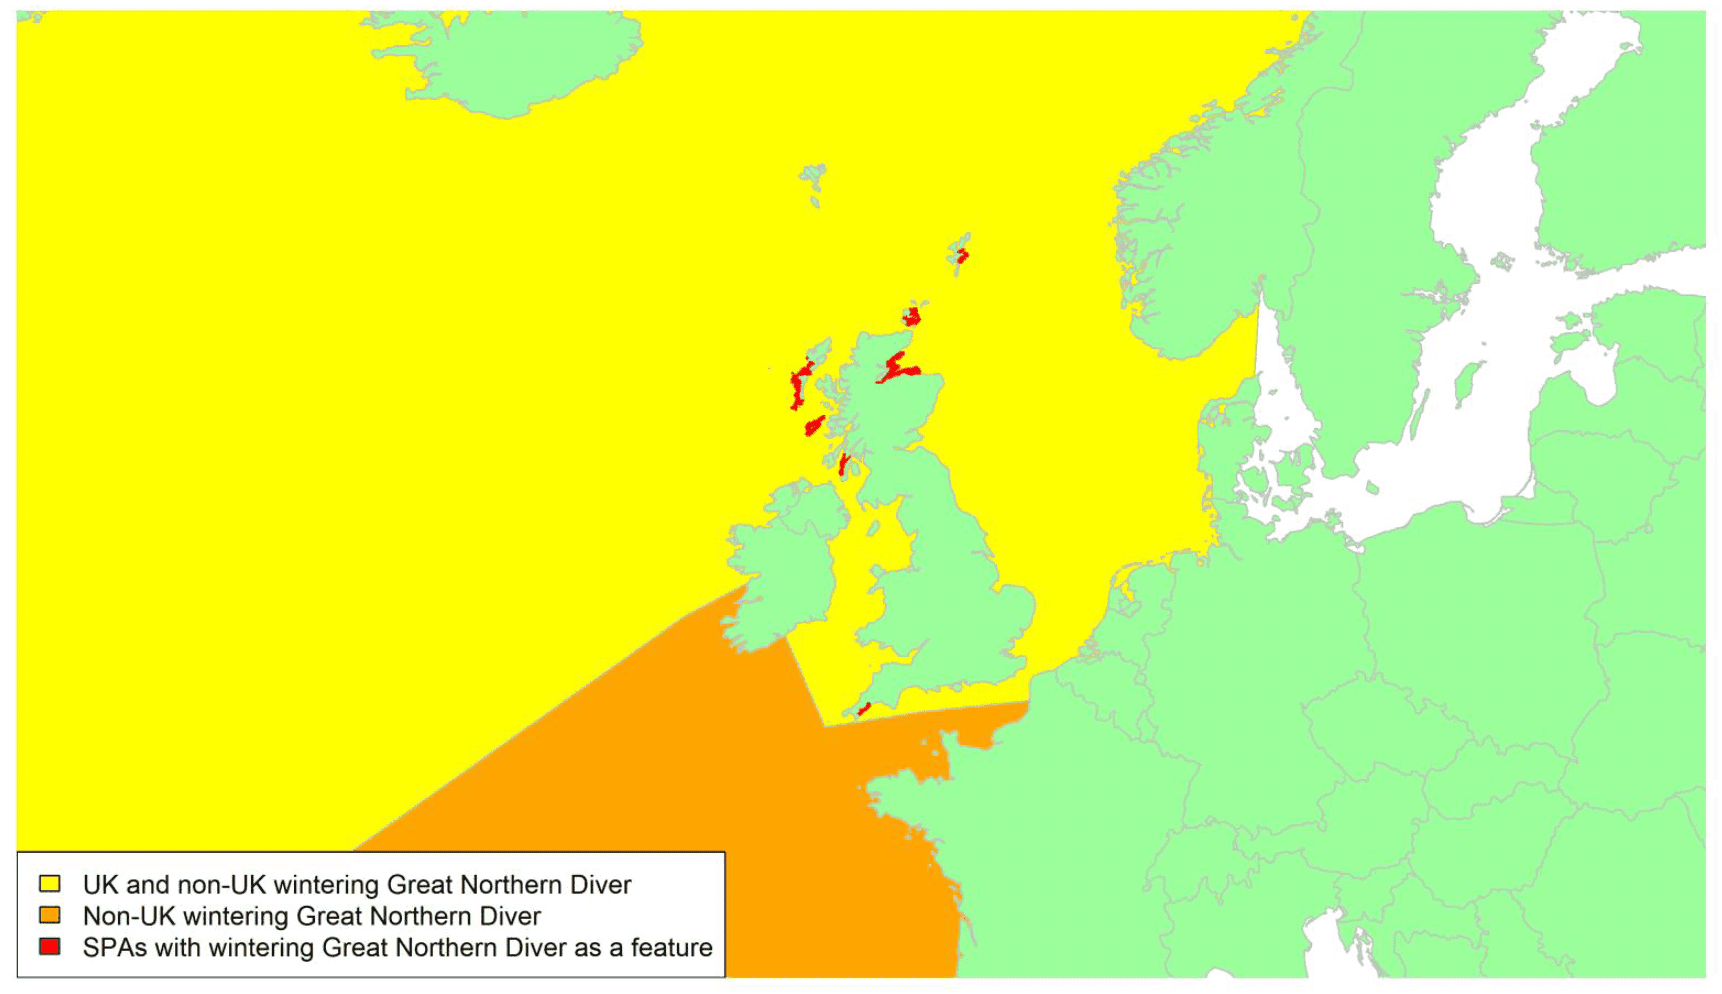
Migratory routes
Confidence: Low
The Great Northern Diver occurs across North America and northern and western Europe. It is fully migratory, breeding in boreal and tundra zones of North America, Greenland, Iceland, and Norway, and moving south post-breeding towards coasts of North America and western Europe. The waters of Britain and Ireland host internationally important populations of Great Northern Divers during the winter, which are thought to be birds breeding in Iceland, Greenland and possibly Canada (Wernham et al. 2002). However, there are virtually no ringing recoveries, and the origins of birds wintering in Britain are therefore uncertain. Small numbers of birds also over-summer in Scotland each year, likely immatures (Wernham et al. 2002).
Great Northern Diver is a common coastal winter visitor in Scotland, mostly in the north and west, and is also a passage migrant recorded in all months (Forrester et al. 2007). Whilst it is most abundant in winter in Scotland (and off the western coast of Ireland), it can occasionally occur anywhere around the UK coastline in winter and small numbers overwinter (Balmer et al. 2013). There are seven SPAs and one proposed SPA in Cornwall. Birds wintering in the UK are most likely to come from the northwest and pass through northern and western waters but could also come from Norway, and hence could cross waters around most of the UK as shown by the yellow shading on the map. Birds wintering off western Europe could move through UK waters on passage and continue across the English Channel.
The proportion of the European population which could be potentially at risk of collision with wind turbines in UK waters is likely to be high and may be close to 100% including birds on passage through UK waters.
Timing of migration
Confidence: Medium
Most adult Great Northern Divers leave breeding grounds in Greenland and Iceland between September and October, though failed breeders and some immatures likely leave earlier. Small numbers arrive to north and northwest Scotland in August, with peak arrivals in October and November (Wernham et al. 2002). Most birds begin to depart again during late April and early May, after undergoing body moult, though some remain as late as June. The species is a passage migrant recorded in all months of the year (Forrester et al. 2007, Balmer et al. 2013); though patterns of movement vary by region, e.g., fewer birds passing through eastern areas in Scotland, as shown by BirdTrack reporting rates (see Appendix 2). Peak spring migration around the Scottish coast can be inferred from a steep decrease in BirdTrack reporting rates between early May and mid-June, while peak autumn migration in Scotland is shown by a steep increase between the end of August and the end of October. The reporting rates elsewhere in the UK show a steadier decrease from January onwards in most regions, suggesting that some birds may possibly move further north prior to moult whilst others moult on their wintering grounds (Appendix 2). The graphs suggest that autumn arrivals occur slightly later further south in the UK with birds reaching the southernmost regions of England from October onwards.
Peak Great Northern Diver migration is likely to occur during morning hours, with migration rates peaking mid-morning and then decreasing throughout the afternoon (Kelley & Major, 2020).
Flight heights
Confidence: Medium
There is little data available on flight heights of migrating Great Northern Diver. A single record of 18.1 m above sea level for a bird migrating over the North Sea in autumn was made using an optical rangefinder (Harwood et al. 2018). Visual observations of 27 birds flying over the northwest Atlantic found mean heights of 9.6 m above sea level. (± 9.6 SD). Flight heights of other migrating diver species in the North Sea were found to be generally below 30 m above sea level, but birds flew at higher altitudes during tailwind situations (Krijgsveld et al. 2011; Krüger et al. 2001). From a sample size of 14 across five studies, the proportion of Great Northern Diver flights at collision risk height (20-150m) was zero (Cook et al. 2012).
Given these data, it is recommended for the purposes of collision risk modelling in relation to birds on migration that a precautionary estimate of 25% of birds at collision risk height is used.
Flight speeds
Confidence: Low
There is little data available on flight speeds of migrating Great Northern Divers. Observational data of 14 birds flying in the Great Lakes region of the USA during autumn migration estimated a groundspeed of 19.5 m/s (SD 1.6) based on 10 visual observations of birds moving between two points a known distance apart in conditions with low wind (Binford & Youngman, 2010). It is recommended that a flight speed of 19.5 m/s (SD 1.6) be assumed for the purposes of collision risk modelling.
Avoidance rates and behaviour
Confidence: Medium
No avoidance rates have been reported for this species, though strong macro-avoidance rates have been documented for divers as a group in Europe (Dierschke et al. 2016). An avoidance rate of 0.9 was calculated from analysis of density data collected using ship-based surveys; and 0.68 from panorama scans of birds inside and outside wind farms (Krijgsveld et al. 2011; Welcker & Nehls, 2016). Red-throated Divers strongly avoid offshore wind developments, with displacement effects seen as far as 16km from an operational facility (Mendel et al. 2019; Heinänen et al. 2020). No meso- or micro-scale avoidance rates have been reported for divers.
In the absence of precise species or diver specific estimates, and given evidence for high levels of macro-avoidance, it is recommended that the all-species avoidance rate of 0.9954 ± 0.00002 is used for the purposes of collision risk modelling.
Bittern Botaurus stellaris
SPA Species? |
Yes (breeding and non-breeding) |
|---|---|
SPA site codes (Introduction, Table 2) |
6:12:21:30:31:32:35:40:44:62:73 |
Population size breeding (UK) |
191 males (APEP4, 2020); uncertainty: low |
Population size non-breeding (UK) |
795 individuals (APEP4, 2020); uncertainty: medium |
Population size (Biogeographic flyway, SPA season) |
7,200 - 8,200 individuals; uncertainty: low (Wetlands International 2021) |
Percentage of biogeographic population at risk of collision in UK waters (passage / breeding / non-breeding) |
<4.2% (breeding); uncertainty: medium 4.5%–8.7% (non-breeding); uncertainty: medium |
Movement of breeding and wintering birds
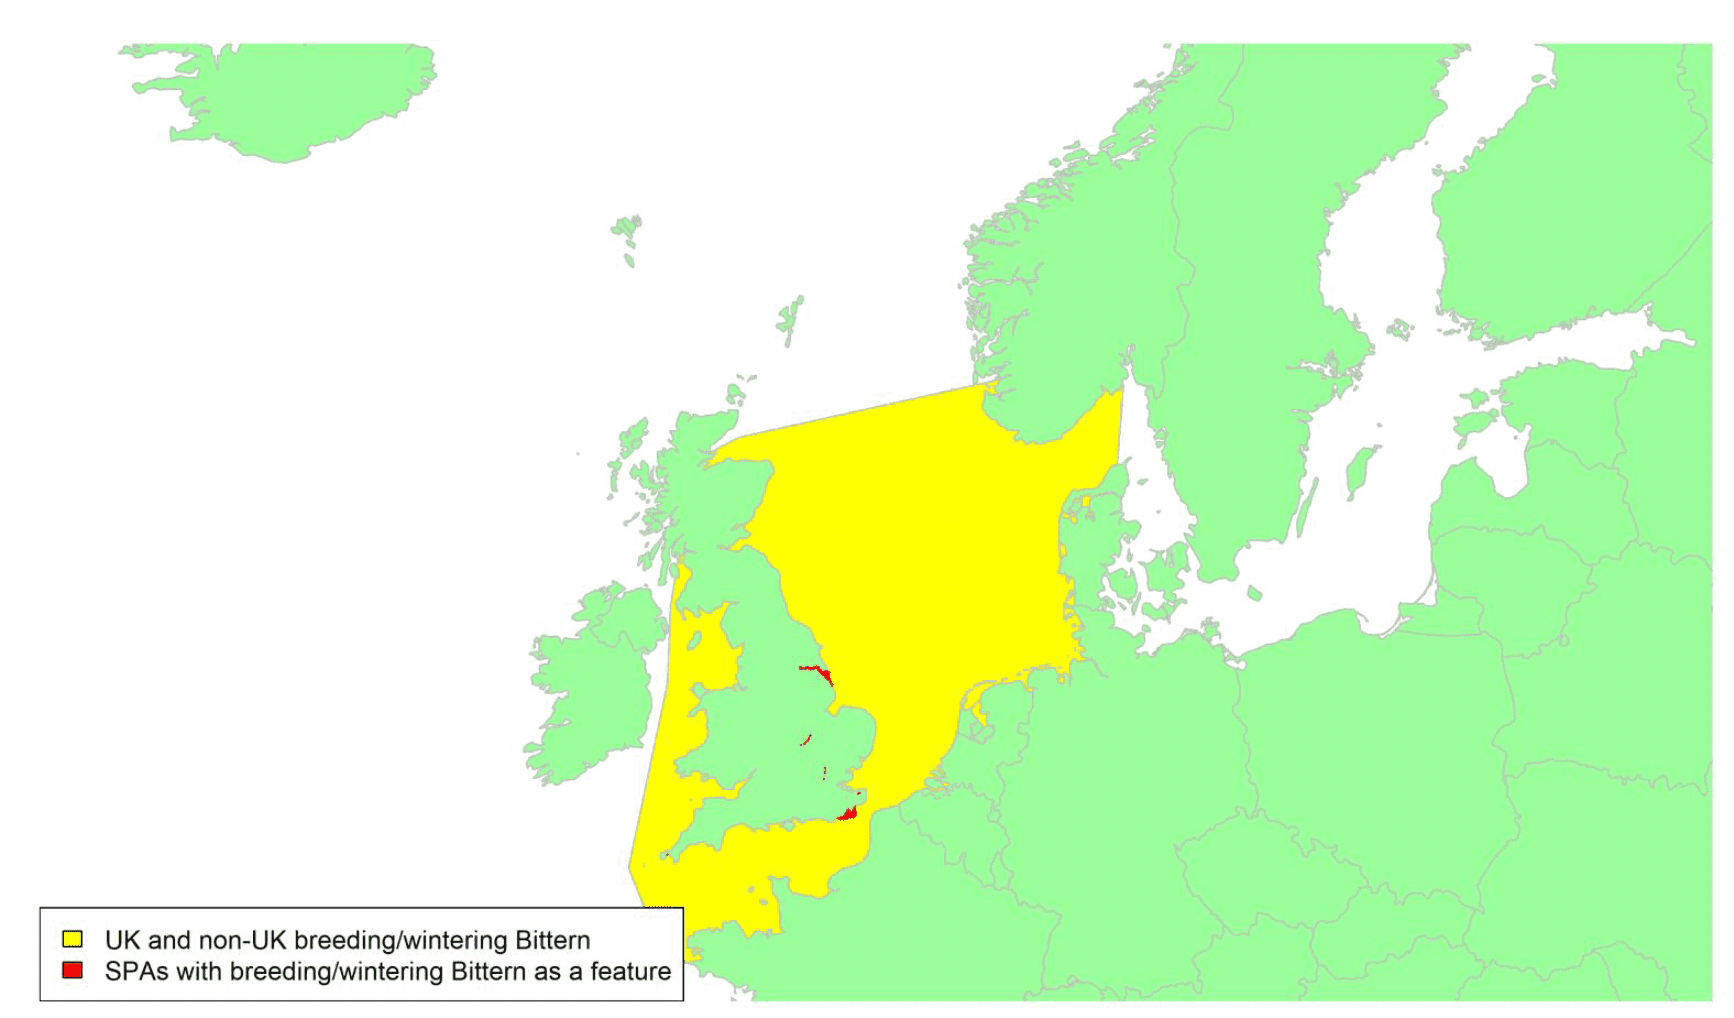
Migratory routes
Confidence: Low
Bittern breed across western and central Europe and Russia. Although there are some limited tracking data, current knowledge suggests movements may be variable and hence difficult to interpret. Populations that breed in areas with warmer winters are largely sedentary, while northern populations are mainly migratory (BirdLife, 2015; Wernham et al. 2002). Small numbers of Bittern breed in England, with numbers in the UK increasing in winter with the arrival of continental birds following hard weather (Wernham et al. 2002). Ringing recoveries suggest that these birds come from northwest Europe (Wernham et al. 2002). Radio-tracking of British Bitterns has found that adult males are largely sedentary unless forced to move by cold weather (Wernham et al. 2002). However, very little is known about the migratory or cold-weather movements, or dispersal, of Bitterns, owing to their secretive habits and low numbers of ringing recoveries. Tracking of six Bitterns in the Netherlands suggests that while males are largely resident, females are partial migrants with flexible individual strategies, with one female travelling 700 km to winter in southwest England for five consecutive years, and another travelling to the Gambia (van der Winden et al. 2019). Bitterns also show strong post-breeding dispersal of immatures, and in Britain ringing recoveries suggest movements of up to 200 km (Wernham et al. 2002). The Bittern is a rare passage and wintering bird in Scotland, mostly observed in southern and eastern areas (Forrester et al. 2007).
Many wintering birds seen in the UK are therefore likely to move from the Continent in periods of severe weather, and so will probably cross the North Sea. British Bitterns may also migrate south. Specific routes or behaviour are not known however, and a broad migratory corridor must be assumed, indicated by the yellow shading on the above map. However, the lack of ringing and tracking data means that there is a low confidence associated with even the broad predicted spatial use shown on the map. Based on the population estimates, up to 8.7% of the biogeographic population may be potentially at risk of collision with wind turbines in UK waters. However, the proportion is likely to be lower as an unknown (and possibly high) proportion of breeding Bitterns are believed to remain in Britain during winter and hence would not be at risk of collision with offshore wind farms.
Timing of migration
Confidence: Medium
Sightings of Bitterns away from known breeding grounds remain constant throughout early winter until numbers increase sharply in December and January, perhaps suggesting an influx of birds following hard weather on the continent (Wernham et al. 2002). Timings of peak sightings therefore vary slightly between years with weather conditions. BirdTrack reporting rates (see Appendix 2) suggest that autumn movements may begin as early as late September in some regions (e.g., northeast, and northwest England) but reporting rates do not increase until December in some regions and peak in January in Scotland. Some of the earlier movements may reflect dispersal of juveniles away from natal sites, with the latter increases in reporting rates more likely to involve continental birds. The decrease in reporting rates in some regions in spring suggests that most wintering birds return to their breeding grounds during February.
A notable peak in BirdTrack reporting rates also occurs in eastern England and southwest England from March to mid-June. This peak should be interpreted with caution, however. This is probably caused by increased detectability of Bitterns in these two regions during the breeding season whilst they are booming and making feeding flights, and hence it is unlikely that this peak reflects any substantial migratory movements.
Bitterns migrate at night, with presumed peak activity one or two hours after sunset (Newton, 2010), but no specific data are available.
Flight heights
Confidence: Low
There are no flight heights reported for this species. In the absence of such data, it is recommended that a precautionary assumption of 100% of birds at collision risk height is made.
Flight speeds
Confidence: Low
There is very little information on flight speeds of Bittern. One radar tracking study reported an airspeed of 8.8 m/s for one track of a Bittern in flapping flight in Sweden (Alerstam et al. 2007).
It is recommended that, for the purposes of collision risk modelling, a flight speed of 8.8 m/s is assumed. In the absence of any estimate of the variation around this value, based on data presented for other species, a standard deviation of 2 m/s is suggested.
Avoidance rates and behaviour
Confidence: Very Low
No avoidance rates have been reported for this species. However, post-construction monitoring data collected from onshore wind farms suggests a within wind farm avoidance rate for herons of 0.9928 ± 0.00092. Consequently, for the purposes of collision risk modelling, an avoidance rate of 0.9928 ± 0.00092 is recommended.
Osprey Pandion haliaetus
SPA Species? |
Yes (breeding population) |
|---|---|
SPA site codes (Introduction, Table 2) |
95:106:114:116:125:129:135:166:180 |
Population size breeding (UK) |
240+ pairs (APEP4, 2020); uncertainty: medium |
Population size non-breeding (UK) |
n/a |
Population size (Biogeographic flyway, SPA season) |
8,400 – 12,300 pairs (European population, breeding) ; uncertainty: high (BirdLife International, 2021) |
Percentage of biogeographic population at risk of collision in UK waters (passage / breeding / non-breeding) |
>2.0%–2.7% (breeding); uncertainty: high |
Movement of breeding birds
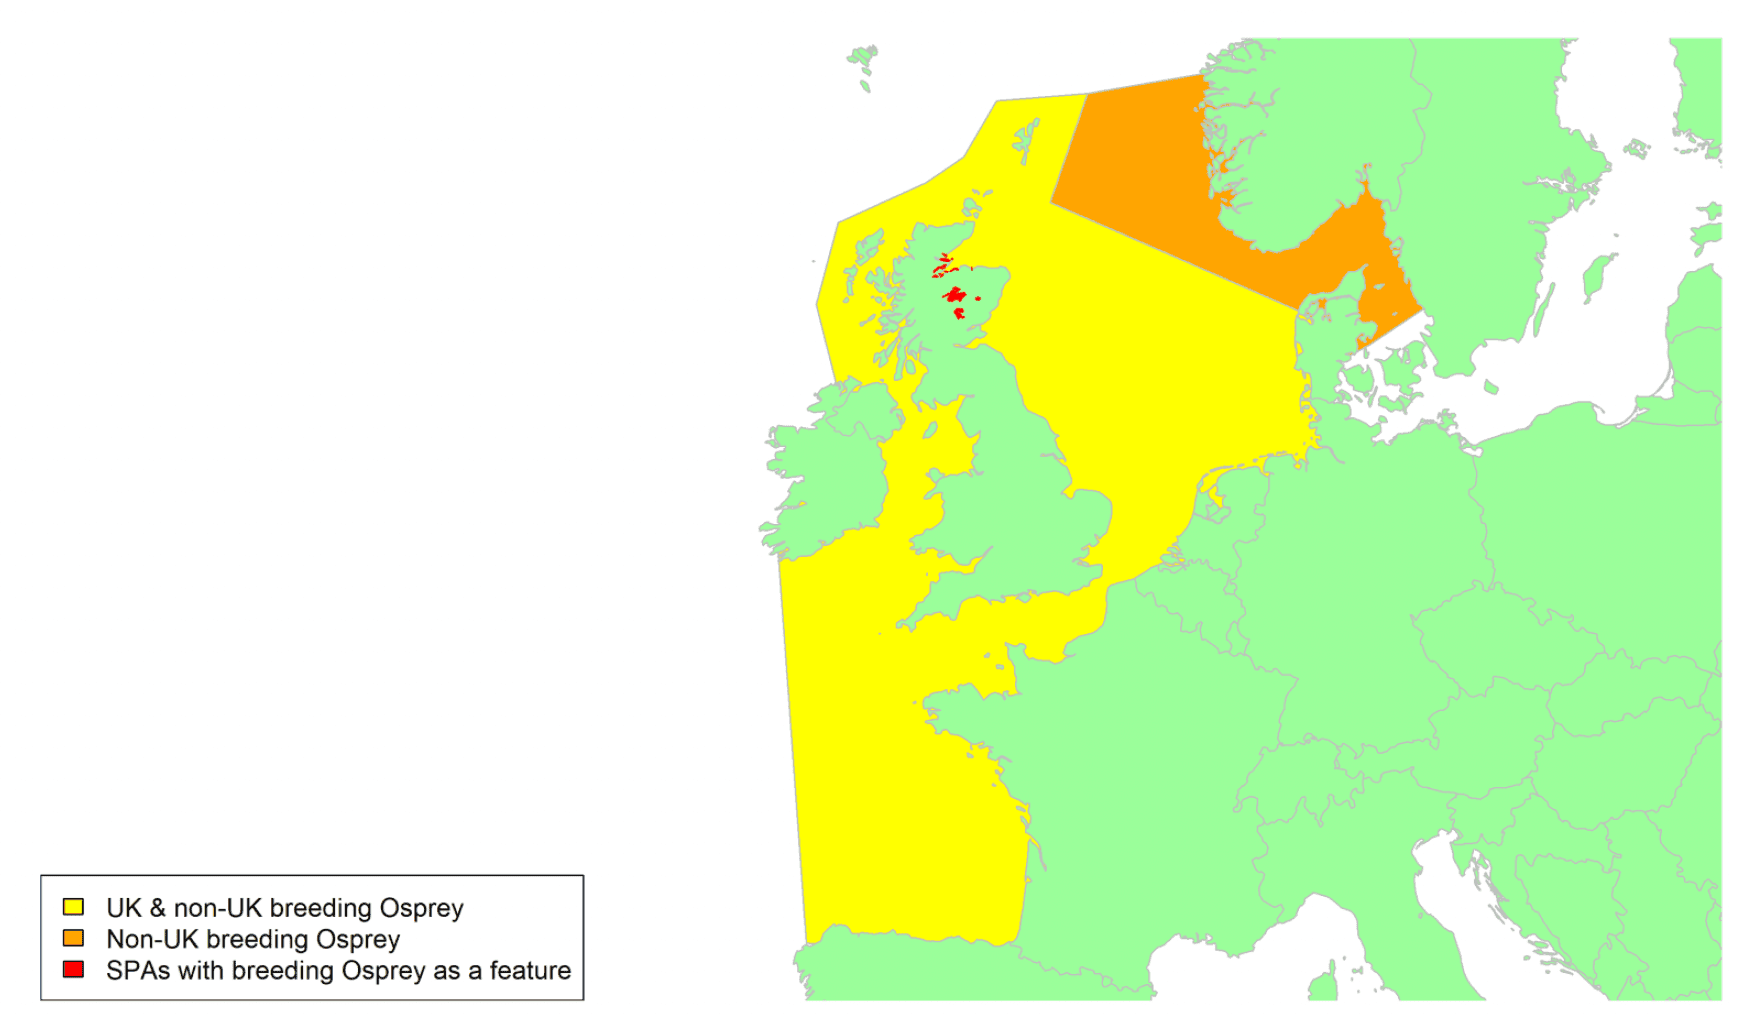
Migratory routes
Confidence: High
The Osprey is a very widespread species, with breeding populations throughout North America, Europe, and Asia. Ospreys breeding in northern Europe migrate south on a broad front, largely to wintering grounds in sub-Saharan tropical Africa, though increasing numbers are wintering in the Iberian Peninsula (Martín et al. 2019). Studies have found Ospreys are capable of long-distance travel over water, including across open ocean, facilitated by the use of flapping flight (Horton et al. 2014; Mackrill, 2017; Meyer et al. 2000; Monti et al. 2018).
Most breeding Ospreys in the UK are found in Scotland, with some pairs in Cumbria, central England, and Wales. Several projects have tracked Osprey movements from the UK. Most UK birds migrate to West Africa, with a small proportion wintering in the Iberian Peninsula. Ten juvenile Ospreys tagged in the Cairngorms, and eleven adult birds tracked from Moray and Highland in northern Scotland, followed similar migratory routes (https://www.rspb.org.uk/our-work/conservation/satellite-tracking-birds/tracking-Ospreys/; Mackrill, 2017). Tracks from the juveniles tagged in the Cairngorms are shown in map in Appendix 1. Tracked Ospreys migrated south on a broad front, largely flying either overland or across the Irish Sea, crossing the Channel to France and following the Atlantic coast south to Spain and onwards. However, two birds crossed the North Sea: one to the Netherlands, and one between Aberdeen and Norfolk. Ten juvenile Ospreys tracked from Moray and Highland made more wide-ranging exploratory flights across much of Scotland, including various crossings of Scottish waters: to the Outer Hebrides/Na h-Eileanan Siar, across the Firth of Forth, and between Western Scotland and Northern Ireland (Mackrill, 2017). Tracking data from juvenile Ospreys tagged in Scotland during 2012–2016 by the Scottish Wildlife Trust also found migration movements across the North Sea, Irish Sea and Atlantic Ocean (Crawford & Long, 2017). Additionally, two birds tagged in separate studies in central Norway and Sweden have crossed the North Sea and southeast England on migration to West Africa (Alerstam et al. 2006). Ringing recoveries have also indicated movement of birds occurs between Scotland and Shetland, Orkney, the Faeroes, Iceland, Norway, and Sweden.
Scottish breeders (and the small numbers breeding elsewhere in the UK) could therefore pass through waters off both the west and east coasts of the UK as they move south, indicated by the yellow shading on the above map, but with potential exploratory movements of some birds to northeast and northwest Scottish waters. Almost all British breeders (2%–2.7% of the European population) will cross the Channel, the only exceptions being a small proportion that cross the North Sea to Europe. The proportion of the European population potentially at risk of collision with wind turbines in UK waters will be higher than 2–2.7%, as an unknown number of Fennoscandian breeders may also cross the North Sea on migration and could cross both the orange and yellow shaded areas on the map.
Timing of migration
Confidence: High
Migrating birds typically arrive in the UK between early March and mid-April and leave for their wintering grounds between early September and late October. This is reflected in the BirdTrack reporting rates (see Appendix 2) for Scotland, which supports the vast majority of UK breeding birds. A marked increase in reporting rates of Osprey on Scottish coasts indicates peak spring migration between the beginning of April and the beginning of May, while a marked decrease in reporting rates between mid-August and the beginning of October indicates peak autumn migration. The plots for southern and eastern English regions, where the species is a passage migrant only, suggest a more prolonged autumn migration period starting in early August and peaking in early September, with the last migrants leaving the UK in late October. Females commonly depart earlier than males and juveniles in autumn, while among males, failed breeders leave earlier (Kjellén et al. 2001). Timing of migration is more variable in autumn than spring (Alerstam et al. 2006).
Ospreys are largely diurnal migrants, with most migratory activity taking place between sunrise to sunset to take advantage of thermals that develop almost exclusively during these hours. However, Ospreys are less reliant on thermal updrafts than most other medium-large raptors, and evidence of nocturnal flight movements both over land and sea is mounting, particularly during the autumn migration (Duriez et al. 2018; Galarza et al. 2017; Monti et al. 2018).
Flight heights
Confidence: High
Five studies have recorded flight heights of migrating Ospreys crossing water bodies. Ospreys can use thermal soaring while migrating over sea, including at night, exploiting even weak thermals; but are not reliant on thermal uplift for successful sea crossings (Duriez et al. 2018; Mackrill, 2017). Five juvenile Ospreys GPS tracked from Italy on autumn migration flew at a mean 176 m above sea level during successful crossings of the Mediterranean Sea (± 169 SD; 434 GPS bursts), rising to a mean 237 m above sea level when using thermals (± 148 m) and with a maximum height of 899m (Duriez et al. 2018). The average flight height of ten juvenile Ospreys GPS tagged on the east coast of the USA, was 264 m above sea level (± 224 SD) during trans-oceanic migration over the western Atlantic (Horton et al. 2014).
The only one of the five studies to record flight heights during the spring migration found flight heights to be lower in autumn than spring. GPS tracks of Ospreys migrating across the Bay of Biscay showed mean heights of 304 m above sea level in autumn (± 203 m; 14 tracks), with heights of 683 m above sea level in spring (± 293 SD; 4 tracks; Mackrill, 2017).
Given the highly variable altitudes recorded of birds crossing the sea (up to 899m), and assuming that the height of offshore turbines may approach 300m a.s.l., it is recommended that a precautionary assumption of 50% of birds at collision risk height is used.
Flight speeds
Confidence: Medium
There have been a number of GPS studies of Osprey, but variable flight speeds have been reported and most studies have been in autumn; hence there are still some uncertainties about average flight speeds. Three studies have recorded groundspeeds of migrating Ospreys over sea, two during autumn migration only. Both studies that recorded groundspeeds during both seasons found higher speeds in spring. Ospreys crossing the Bay of Biscay in autumn showed mean groundspeeds of 13.8 m/s (± 2.3; 14 flights), and 19.9 m/s in spring (± 3.8; 4 flights; Mackrill, 2017). Distances travelled per day and per hour have also been found to be higher in spring (Klaassen et al. 2008). Median groundspeeds of 11.9 m/s were recorded during 12 sea crossings lasting more than four hours made by Ospreys migrating between Norway and west Africa in autumn (Østnes et al. 2019). Mean groundspeeds of 43 Ospreys tracked crossing the Mediterranean in autumn were 10.6 m/s (± 3.1; Monti et al. 2018).
Given the sample sizes reported by Monti et al. (2018) were greater than those considered in other studies, it is recommended that a value of 10.6 m/s ± 3.1 be used for the purposes of collision risk modelling. It is noted that these values are lower than those reported in other studies. However, as this will result in a higher estimate of the probability of collision (Masden et al. 2021), this is likely to be a precautionary assumption.
Avoidance rates and behaviour
Confidence: Very Low
No reliable avoidance rates have been reported for this species, and there is low certainty around avoidance rates of raptors as a group. A macro avoidance rate of 0.28 has been suggested for raptors based on the percentage of birds tracked by radar entering a wind farm in the North Sea (Krijgsveld et al. 2011). A strong avoidance response to offshore wind was indicated by a marine radar study of migrating raptors in the south of Mexico, with raptors adjusting flight trajectories to avoid new windfarms; but this was not quantified (Cabrera-Cruz & Villegas-Patraca, 2016).
A comparison of predicted and observed collision rates based on post-construction monitoring data suggests that within-windfarm avoidance rates across all raptor species are likely to be high. It is recommended that an avoidance rate of 0.9957 ± 0.00006 is assumed for collision risk modelling (Table 5).
Honey-buzzard Pernis apivorus
SPA Species? |
Yes (breeding population) |
|---|---|
SPA site codes (Introduction, Table 2) |
43 |
Population size breeding (UK) |
33 - 69 pairs (APEP4, 2020); uncertainty: medium |
Population size non-breeding (UK) |
0 (APEP4, 2020); uncertainty: low |
Population size (Biogeographic flyway, SPA season) |
235,000-342,000 individuals (Europe, breeding;); uncertainty: low (BirdLife International, 2021) |
Percentage of biogeographic population at risk of collision in UK waters (passage / breeding / non-breeding) |
0.04%, breeding; uncertainty: high |
Movement of breeding birds
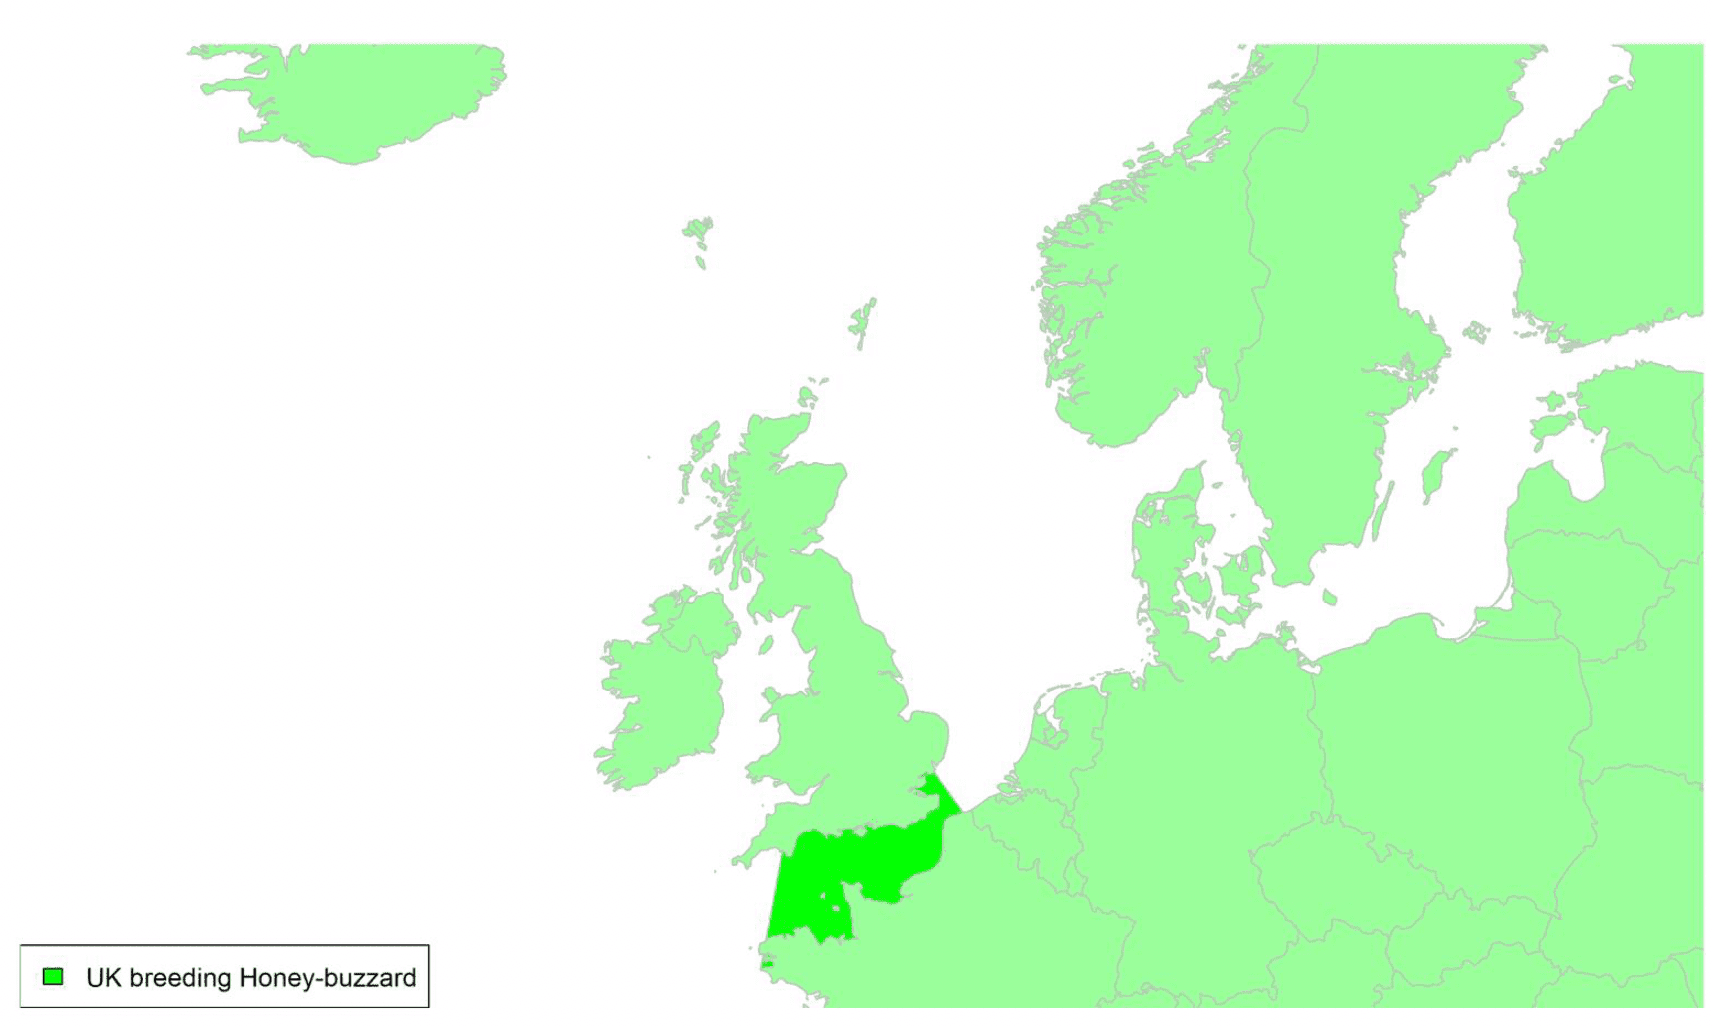
Migratory routes
Confidence Medium
Honey-buzzards breeding in the UK are concentrated in southern England, although they also breed in small numbers in eastern England, Wales and Scotland (Roberts & Law, 2014). Honey-buzzards are long-distance migrants with UK breeding individuals wintering in tropical Africa, largely migrating via the Strait of Gibraltar (Wernham et al. 2002). Satellite tagging of juvenile and adult Honey-buzzards from Scotland, Wales and Sussex indicate that the majority of individuals migrate south in autumn through France and Spain, crossing the Channel, to their West Africa wintering areas (Roberts & Law, 2014; see also www.roydennis.org, viewed 27/1/2022, for further details of most of the tracking data used by the paper).Hence, most UK breeding birds will cross the area of UK waters shaded green in the above map. However, one juvenile migrated further west, via the Bay of Biscay, before crossing into northwest Africa, while another juvenile took a more easterly route via Germany and Switzerland. Only a small proportion of the international population pass through the UK during migration. Consequently, less than 0.1% of the biogeographic population may potentially be at risk of collision with wind turbines in UK waters.
Honey-buzzards can make long sea-crossings that can involve migrating at night (Agostini et al. 2012; Agostini et al. 2005).
Timing of migration
Confidence Medium
Tracking indicates that Honey-Buzzards start their autumn migration between mid-August and mid-September (Roberts & Law, 2014). In southwest Sweden, adults females depart the breeding grounds earlier than the males and juveniles (Hake et al. 2003). One individual which was tracked for two migration cycles returned to the UK in mid to late-May both times (Roberts & Law, 2014). The BirdTrack reporting rate for England (see Appendix 2) indicates that spring migration of returning individuals occurs between mid-April and late-May, and autumn migration between mid-September and mid-October. The timings for spring migration seem to reflect individuals arriving through southern England, with no clear pattern in other regions of the UK.
Flight heights
Confidence: High
Estimates of Honey-buzzard flight heights during migration are available from three studies all using radar.
A mean flight height of 596 ± SD 436 m (range 45-2718 m, N = 338 tracks) was recorded from individuals migrating over land through the Avara Valley, Israel, during spring and autumn (Bruderer et al. 1994). The same study reported a mean height of 501 ± SD 231 m (range 168-975 m, N = 17) over land in Switzerland during migration (Bruderer et al. 1994).
On the south coast of the Iberian Peninsula, a median flight height of 865 m was estimated from 81 tracks during autumn migration (measured over land and sea, Meyer et al. 2000). Flight altitudes increased from sunrise to noon, and then remained relatively stable. Honey-buzzards were observed to be reluctant to cross the Mediterranean Sea, with most individuals migrating along the coast (Meyer et al. 2000).
During spring migration over the Tyrrhenian Sea (Central Mediterranean) a mean flight height estimate of 279.9 ± SE 4.9 m above sea level (maximum of 532 m, N = 201 records) was recorded over land and sea (Panuccio et al. 2019). Flight heights over the sea were found to be higher, with a mean of 340.5 ± SE 8.7 m above sea level. This study also calculated mean (± SE) flight heights of tracks by wind direction: Headwind, 282.3 ± 11.8 (N = 42); cross wind, 267.6 ± 6.5 (N = 88); tailwind, 280.7 ± 9.9 (N = 55); and no wind, 338.3 ± 18.5 (N = 16).
Given the highly variable altitudes recorded of birds crossing the sea (in excess of 865m), and assuming that the height of offshore turbines may approach 300m a.s.l., it is recommended that a precautionary assumption of 50% of birds at collision risk height is used.
Flight speeds
Confidence: High
Flight speeds of Honey-buzzard have been estimated from two studies, both using radar.
Mean flight airspeed along the south coast of the Iberian Peninsula, during autumn migration, was estimated at 10.4 ± SD 4.2 m/s (N = 28 tracks) when cross country soaring/gliding, and 11.1 ± SD 2.3 m/s (N = 16 tracks) during horizontal flapping-gliding flight (Meyer et al. 2000). This study also reported a mean flight airspeed of 10.4 ± SD 0.4 m/s (N = 28 tracks) during inter-thermal soaring/gliding, and a climbing rate in soaring/gliding of 1.35 ± SD 0.77 m/s (N = 48 tracks) (Meyer et al. 2000).
During spring and autumn migration over land in the Arava Valley and Negev Highlands, Southern Israel, a mean flight airspeed of 15.01 ± SD 2.91 m/s (N = 167 tracks) was estimated during inter-thermal gliding, and a climbing rate in thermal circling of 1.89 ± SD 0.83 m/s (N = 139 tracks) (Spaar, 1997).
Given that movements over sea are likely to be a combination of flapping and gliding flight, it is recommended that a speed of 11.1 m/s (SD 2.3) is assumed for the purposes of collision risk modelling.
Avoidance rates and behaviour
Confidence: Very Low
Little is known about avoidance rates in Honey-buzzards. As part of post-construction monitoring at a windfarm in the Denmark Baltic Sea, radar tracking data of raptors on autumn migration indicated a negative macro avoidance of wind farms of -0.14 for Honey-buzzards (range between -0.125 to -0.155; Skov et al. 2016), implying attraction to the wind farm. However, other studies have suggested some avoidance of wind farms including Jacobsen et al. (2019), which found 30% of Honey-buzzards altering flight direction to avoid entering wind farms. This is consistent with Krijgsveld et al. (2011), which suggested 28% of raptors altered flight to avoid wind farms and Cabrera-Cruz & Villegas-Patraca (2016) which used radar to show migrating raptors altering flightpaths to avoid entering wind farms.
A comparison of predicted and observed collision rates based on post-construction monitoring data suggests that within-windfarm avoidance rates across all raptor species are likely to be high. It is recommended that an avoidance rate of 0.9957 ± 0.00006 is assumed for collision risk modelling (Table 5).
Marsh Harrier Circus aeruginosus
SPA Species? |
Yes (breeding population) |
|---|---|
SPA site codes (Introduction, Table 2) |
2:6:12:21:30:32:40:44:124 |
Population size breeding (UK) |
590-695 pairs (APEP4, 2020); certainty: medium |
Population size non-breeding (UK) |
Unknown |
Population size (Biogeographic flyway, SPA season) |
99,300 – 184,000 females (Europe, breeding); uncertainty: high (BirdLife International, 2021) |
Percentage of biogeographic population at risk of collision in UK waters (passage / breeding / non-breeding) |
c.0. 3%–0.7% breeding; uncertainty: high |
Movement of breeding birds
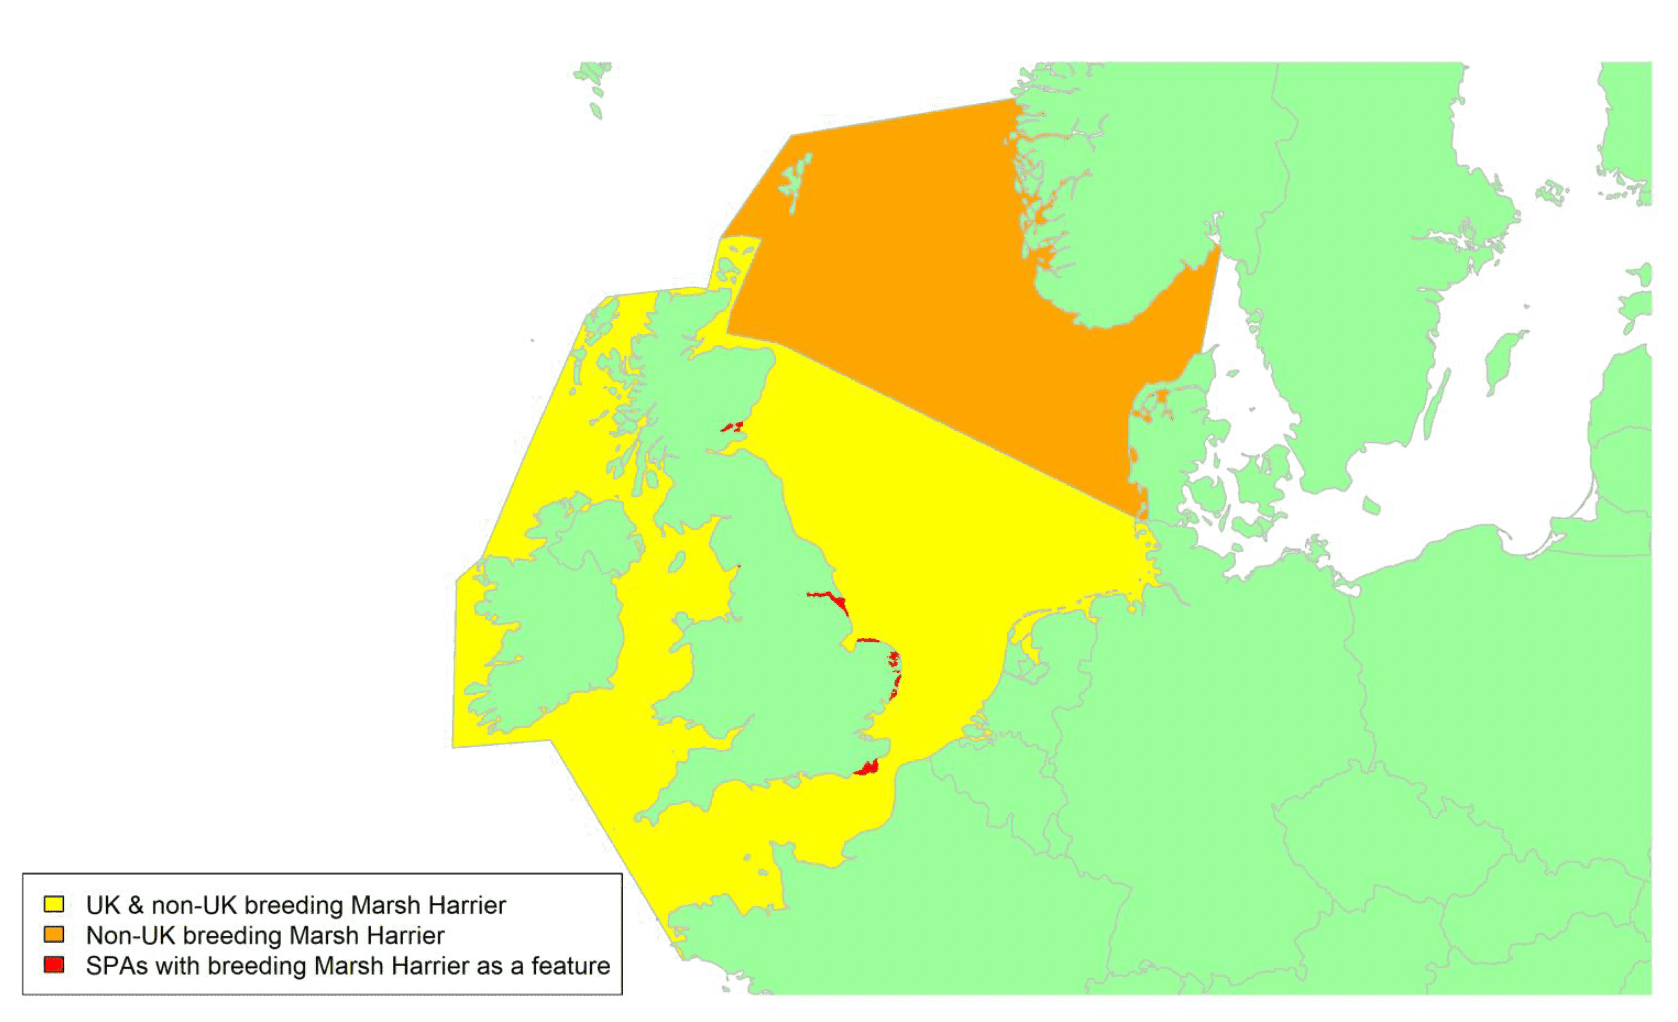
Migratory routes
Confidence: Medium
The Marsh Harrier is a widespread species occurring throughout Europe, North Africa, and Central Asia. The UK population are partial migrants, with some individuals remaining in the UK over winter and others migrating to southern Europe and sub-Saharan Africa. The proportion of individuals that migrates is uncertain.
Tracking and ringing data from northern and mainland Europe have shown that the Marsh Harrier is a broad front migrant, capable of undertaking long sea-crossings, with individuals breeding at different longitudes following distinct migration corridors (Agostini et al. 2017; Vansteelant et al. 2020). Marsh Harriers tracked from southern Sweden followed different routes on spring and autumn migrations, with considerable within-individual variation (Klaassen et al. 2010; Vardanis et al. 2011, 2016). The migration routes of birds breeding in Scotland remain poorly understood, as there are limited tracking data and ringing recoveries. Four of five juvenile Marsh Harriers tagged in autumn in northeast Scotland, between 2004 and 2012, first moved west (www.roydennis.org). Several birds crossed Scottish waters to islands off the west coast before continuing further south, with one bird then crossing to Northern Ireland. The fifth bird crossed the North Sea to northern Germany (in a suspected weather-induced diversion) before moving south overland through France and Germany. Ringing recoveries of birds ringed as pulli in East Anglia show that some movement of birds occurs from Britain to southwest Europe and northwest Africa.
UK breeders may therefore pass through most waters around the UK coasts, indicated by the yellow shading on the above map, including southerly movements of birds breeding on Orkney. Some Fennoscandian breeders may also pass through eastern Scottish waters on migration, indicated by the orange shading on the above map. The limited tracking data from both autumn and spring migration means that a broad migratory corridor must be assumed.
The UK breeding population makes up less than 1% of the biogeographic population, some of which will remain in the UK and will not be at risk of collision with wind turbines in UK waters. However, it is unclear how many birds from Fennoscandia pass through UK waters on migration and hence whether the proportion of the population potentially at risk could be higher than 1%.
Timing of migration
Confidence: Medium
Migrating birds start to arrive in the UK from mid-March, with spring migration complete by May. Birds then begin to leave for their wintering grounds from mid-August, with autumn migration complete by November. This is reflected in the BirdTrack reporting rates (see Appendix 2). A marked peak in reporting rates of Marsh Harrier indicates spring passage migration between the end of March and mid-May, mostly in eastern regions of England and Scotland. A marked decrease in reporting rates between the end of August and mid-November indicates peak autumn migration. The trends are more complicated to interpret in some of the southern English regions and in northwest England and Wales. It is likely that the variation in the reporting rate pattern in these regions at least partly reflects the movements of birds from the increasing British breeding population rather than passage migrants passing through the UK.
Marsh Harriers are mostly diurnal migrants, flying throughout the day from sunrise to sunset (Spaar & Bruderer, 1997). However, nocturnal migration has been reported, so it is possible that occasional movement does occur at night in response to varied weather and feeding conditions (DeCandido et al. 2006).
Flight heights
Confidence: Medium
Two studies have reported flight heights of migrating Marsh Harriers over sea, both from the Messina Strait in southern Italy. Radar tracking found mean flight heights of 322 m a. s. l. (± 14 SE, 114 tracks) across both spring and autumn migrations (Agostini et al. 2017), and mean heights of 495 m above sea level during the spring migration (± 26 SE, 197 tracks) (Mateos-Rodríguez & Liechti, 2012). Birds migrating in larger flocks flew at lower heights than those in smaller groups or single individuals (Agostini et al. 2017). Flight altitude varied with time of day. Birds flew at lower heights during the morning (mean 279 m ± 13 SE) than both mid-day (mean 408 m ± 40 SE) and afternoon (mean 513 m ± 94 SE; Agostini et al. 2017).
With mean reported flight heights ranging from 279 to 513m a.s.l. and taking into account the height of offshore turbines (between 22 and 300m a.s.l.), it is recommended that a precautionary assumption of 50% of birds at collision risk height is used.
Flight speeds
Confidence: Medium
Several radar studies have reported flight speeds of Marsh Harriers. Birds moving through the Arctic and southern Sweden (2 tracks, flapping flight only; Alerstam et al. 2012), and through Europe, the Mediterranean and Israel (76 tracks; Bruderer and Boldt, 2001) were found to fly at airspeeds between 10.1 and 12.6 m/s, though season was not specified in either study and it is therefore not clear if these reflect migratory movement behaviours. Groundspeeds of Marsh Harriers migrating over Israel were faster in autumn (gliding flight of 15 m/s) than spring (gliding flight of 11.6 m/s), with an average of 13.1 m/s across both seasons (Spaar & Bruderer, 1997). Groundspeeds of 13.2 m/s (± 2.9 SD) were recorded for birds migrating overland in Israel, from radar data collected both during spring and autumn migrations (Horvitz et al. 2014). The highest speeds (km/h) recorded by Marsh Harriers tracked migrating over the Sahara were around local noon (Mellone et al. 2012).
As they reflect an average of spring and autumn migration, it is recommended that a flight speed of 13.2 m/s ± 2.9 from Horvitz et al. (2014) is assumed for the purposes of collision risk modelling.
Avoidance rates and behaviour
Confidence: Very Low
Marsh Harriers have been shown to exhibit a weak macro-attraction to wind farms, but there is no data at the meso- or micro- level, and only very poor data on within-farm avoidance. A combination of radar and laser rangefinder tracking data, used to measure the migration flight directions of raptors on autumn migration in Denmark, found a negative macro avoidance of wind farms of -0.05 (range between -0.065 to -0.040) (Skov et al. 2016). A macro avoidance rate of 0.28 has been suggested for raptors as a group, but with low certainty, based on the percentage of birds tracked by radar entering a wind farm in the North Sea (Krijgsveld et al. 2011). A strong avoidance response to offshore wind was indicated by a marine radar study of migrating raptors in the south of Mexico, with raptors adjusting flight trajectories to avoid new windfarms; but this was not quantified (Cabrera-Cruz & Villegas-Patraca, 2016).
A comparison of predicted and observed collision rates based on post-construction monitoring data suggests that within-windfarm avoidance rates for raptors is likely to be high. It is recommended that an avoidance rate of 0.9957 ± 0.00006 is assumed for collision risk modelling.
Hen Harrier Circus cyaneus
SPA Species? |
Yes, breeding, and non-breeding populations |
|---|---|
SPA site codes (Introduction, Table 2) |
8:9:12:16:19:20:21:24:30:37:40:43:45:48:56:62:67:82:92:98:107:125:128:129:142:152:168:173:178:179:180:188:204:208 |
Population size breeding (UK) |
545 pairs (APEP4, 2020); uncertainty: low |
Population size non-breeding (UK) |
Unknown |
Population size (Biogeographic flyway, SPA season) |
30,000 – 54,400 breeding females; uncertainty: medium (BirdLife International, 2021) |
Percentage of biogeographic population at risk of collision in UK waters (passage / breeding / non-breeding) |
2%; uncertainty: high |
Movement of breeding birds
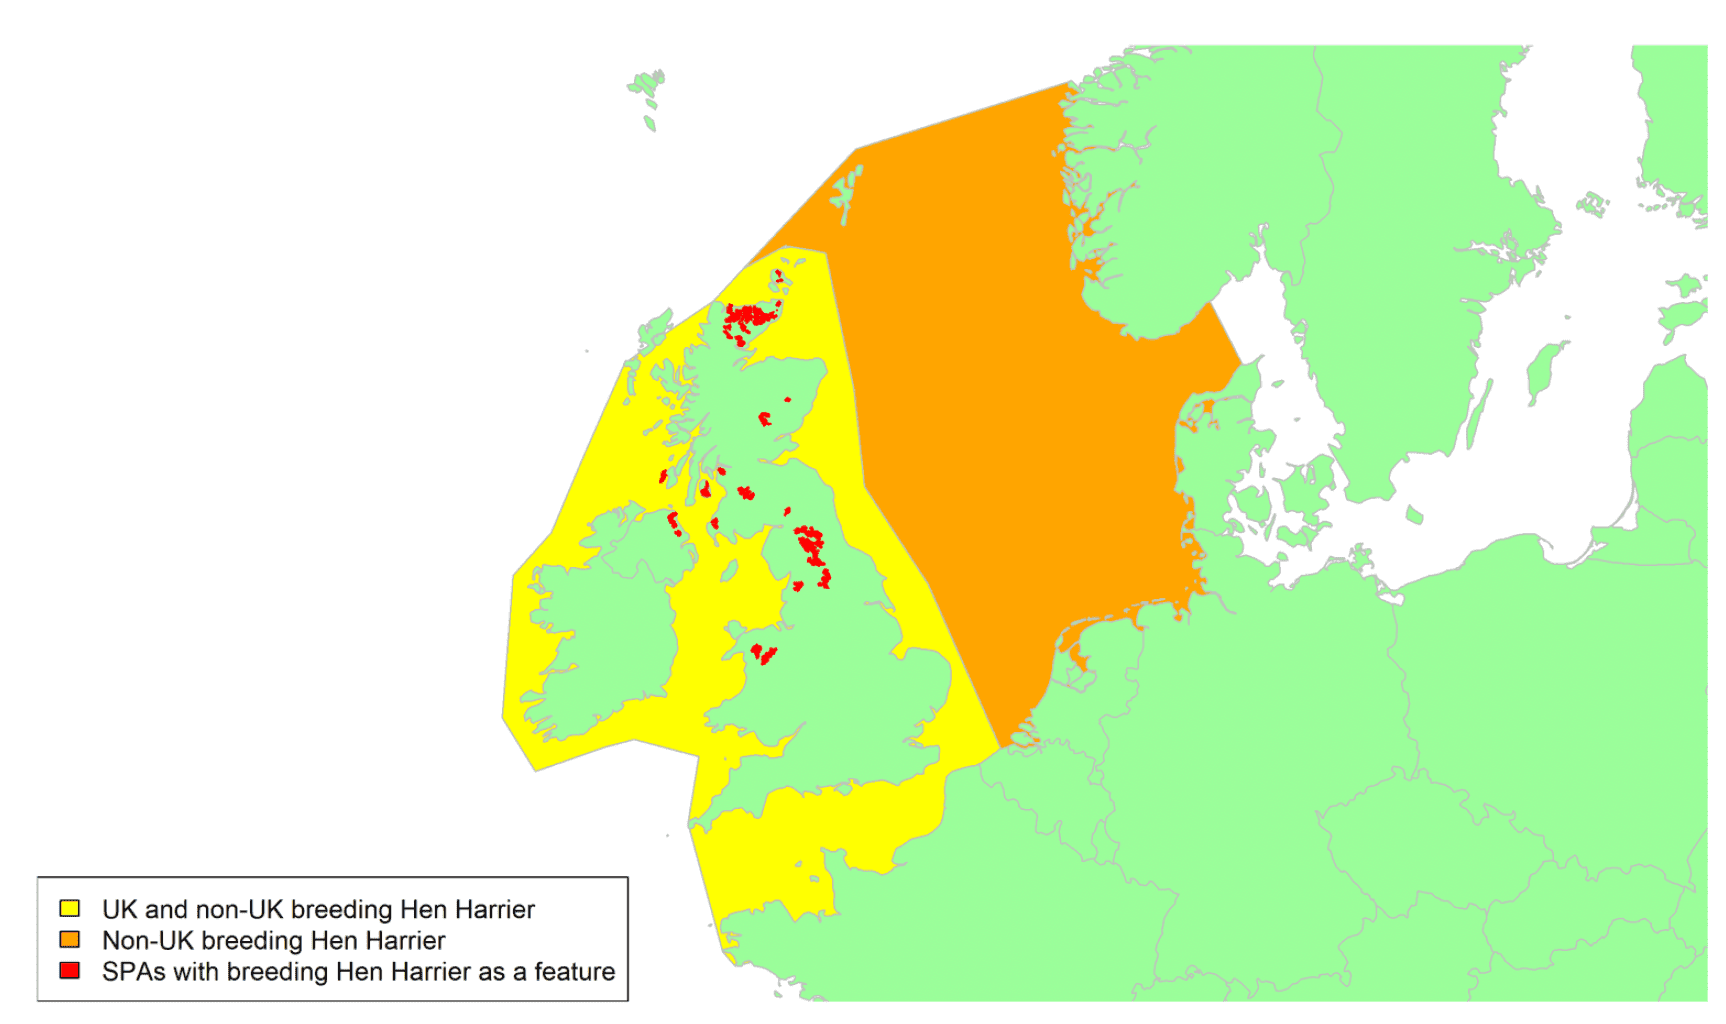
Movement of wintering birds
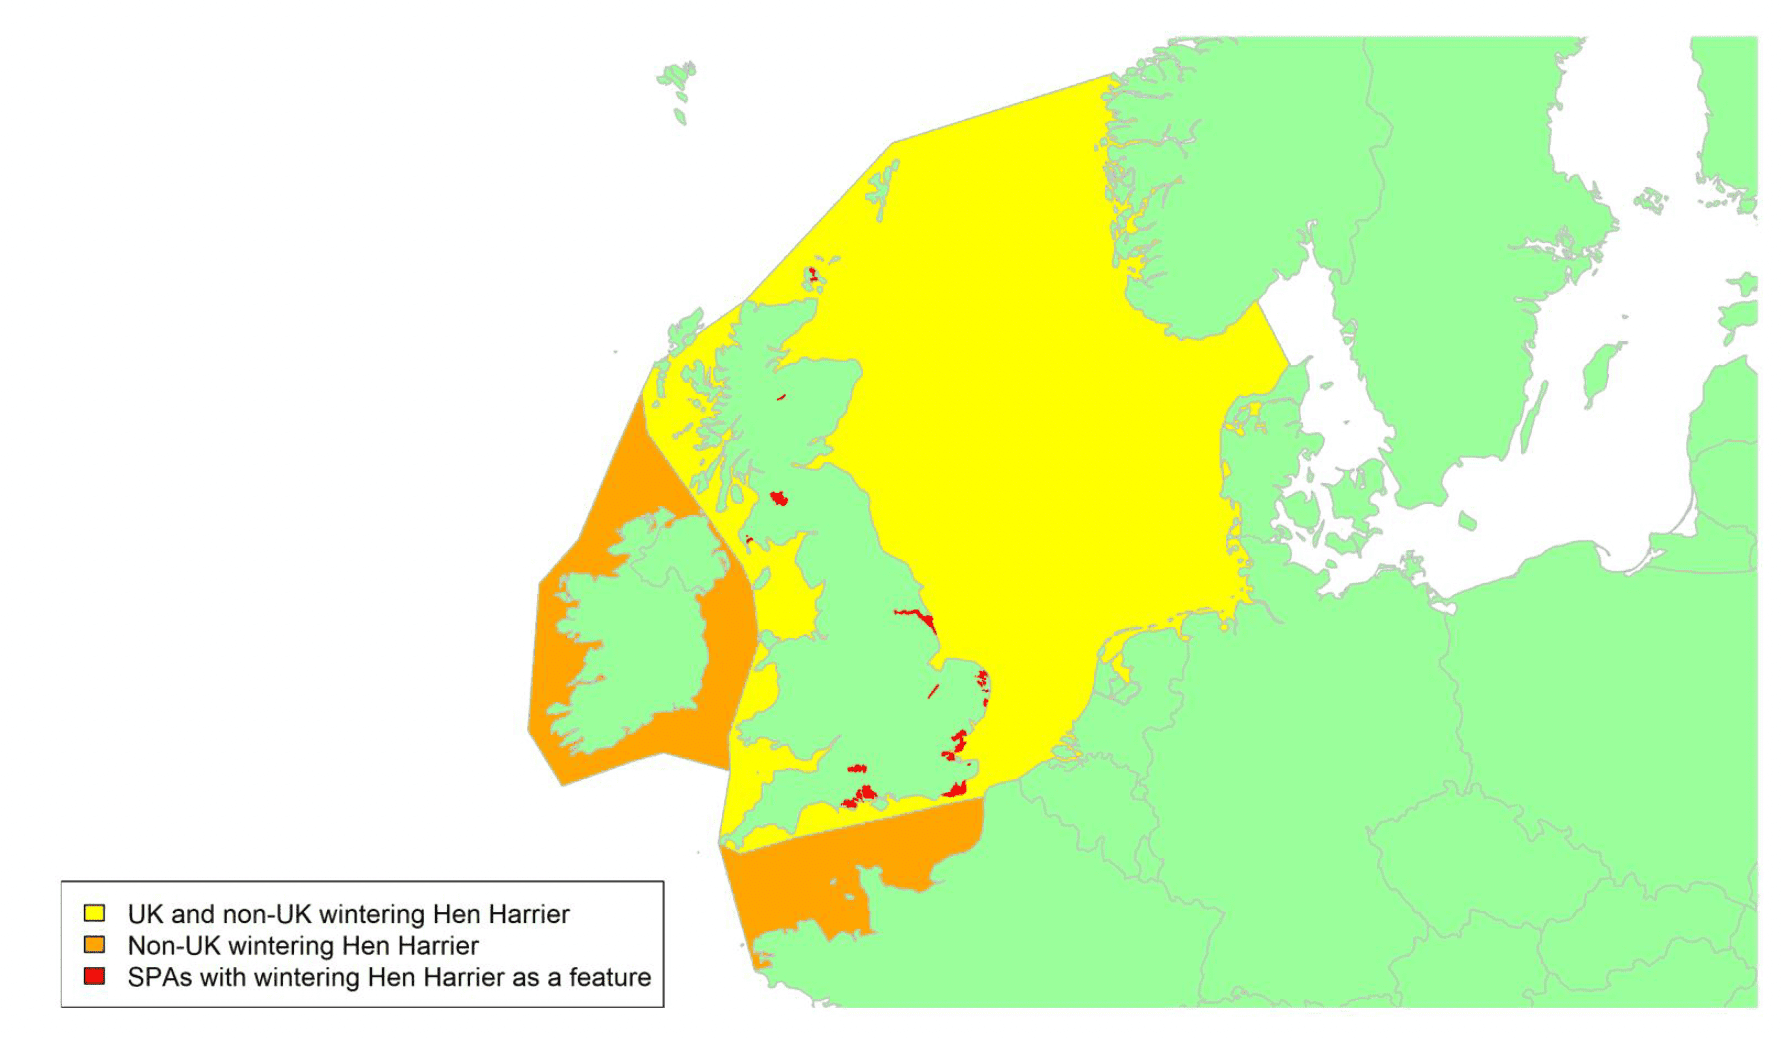
Migratory routes
Confidence: Medium
The nominate subspecies C. c. cyaneus breeds from Portugal, Britain, Ireland and Fennoscandia east across northern and central Europe and Asia. Most northern populations are migratory, wintering further south across much of Europe and Asia. The vast majority of the British breeding population are found in Scotland (460 territorial pairs in 2016) with smaller numbers breeding in Northern Ireland (46), Wales (35) and on the Isle of Man (30) and just four pairs in England (Wotton et al. 2018). Hen Harriers breeding in Britain and Ireland are partial migrants, with many individuals resident year-round and others undertaking long movements, particularly young male birds in their first autumn (Wernham et al. 2002). Hen Harriers breeding on Orkney have been particularly well studied, and ringing recoveries indicate southerly movements as far as East Anglia in winter, and movement across the North Sea to coastal areas of Norway, Denmark, northern Germany, and the Netherlands (Wernham et al. 2002). Most young males that depart south from Scotland follow inland upland areas into England, continuing to southwest England and crossing the Channel to winter in France and the Iberian Peninsula (Wernham et al. 2002). Some birds winter in Ireland, particularly from the north and west of Scotland. There are fewer records of female Hen Harriers known to have moved outside of Scotland during winter, suggesting more sedentary behaviour. Hen harriers tagged during the breeding season in the UK by the RSPB made various movements across the Channel and the Irish Sea, from both post-fledging exploratory movements by juveniles and adult migratory behaviour (see tracks on map in Appendix 1). Most birds breeding in Ireland seem to be resident year-round, while Welsh breeders appear to winter in southern and eastern England, and the Atlantic coast of France and Portugal (Wernham et al. 2002).
An unknown proportion of birds which winter in Britain come from continental Europe and Scandinavia, with ringing data confirming that some continental birds reach the UK (Wernham et al. 2002). It has been suggested that the majority of birds wintering in southern and south-western England most likely originate from outside the UK with higher numbers in years of severe weather (Wernham et al. 2002). However, Dobson et al (2012) suggested that most birds that winter in England were likely to be from the Scottish breeding population. Further research may therefore be prudent to confirm the origins (and hence migratory movements) of wintering Hen Harriers.
It is likely that Hen Harrier breeding in Scotland could cross waters around Scotland, as well as the Channel and the Irish Sea and shown by the yellow shaded areas on the breeding birds map above. During winter, birds arriving from the continent are likely to cross parts of the North Sea. Birds arriving in Scotland are thought to originate from Scandinavia, as indicated by the yellow shading on the wintering birds map, although there is little evidence to support this. Hen Harriers are not restricted to narrow migration corridors, as they are capable of high soaring and flapping flight, and therefore migrate on a broad front (Wernham et al. 2002). However, there remains a lack of data on specific routes taken, particularly by non-British birds.
The proportion of the biogeographic breeding population potentially at risk of collision with wind turbines in UK waters is not known due to the lack of information about the origins of the wintering population. Taking just the UK breeding population into account (i.e., assuming few wintering birds come from overseas), a maximum of 2% of the biogeographic population would be potentially at risk, and the proportion may even be less than 1% and perhaps close to 0% if most UK breeders also winter in the UK.
Timing of migration
Confidence: Medium
Most juvenile birds remain at inland locations until mid-September, many dispersing short distances to agricultural land (Wernham et al. 2002). Some birds then begin to travel south, with peak movements of those moving to the continent between late September and November. There may be a small arrival and passage of wintering birds to Scotland in late autumn (Forrester et al. 2007). Differences in migratory behaviour between birds of different ages, sexes, and breeding regions in The BirdTrack reporting rates (see Appendix 2) show no clear pattern in Scotland across regions. However, peak migratory rates within English regions can be inferred from the reporting rates for English regions, where the species is predominantly a winter visitor. These suggest that peak spring migration occurs between March and early May and peak autumn migration between early September and mid-November.
Hen harriers are diurnal migrants, flying throughout the day from sunrise to sunset. However, nocturnal migration of other harriers has been reported, so it is possible that occasional movement does occur at night in response to varied weather and feeding conditions (DeCandido et al. 2006).
Flight heights
Confidence: Low
There are no studies recording flight heights for hen harrier. However, two studies have reported flight heights for the very closely related northern harrier (Circus hudsonius), which was until recently considered a subspecies of hen harrier. One study using a clinometer and rangefinder measured a mean height of 18.6 m (± 20.4 SD), with a maximum height of 144.8 m, during overland flight of 149 birds in the USA (Wulff et al. 2016). In this study, the proportion of birds at a collision risk height of 32-124m was 0.18. Of 401 C. hudsonius observed during activity surveys at a windfarm in the USA, the most common (modal) flight height was 3 m, with a maximum observed height of 1068 m (Osborn et al. 1998). In this study, the proportion of birds at a collision risk height of 21-51m was 0.16.
In the absence of data from migratory flights over sea, it is recommended that a precautionary assumption of 100% of birds at collision risk height is used.
Flight speeds
Confidence: Low
Two radar studies have reported flight speeds for migrating Hen harrier. Two tracks of birds in flapping flight across the Arctic and south Sweden had a mean airspeed of 9.1 m/s (± 0.7 SD; Alerstam et al. 2007). Three tracks of birds flying in southern Europe had a mean airspeed of between 11.4 and 11.7 m/s (± 1.1 – 1.4 SD; Bruderer & Boldt, 2001).
Given the slightly greater sample size, a flight speed of 11.4 m/s ± 1.1 from Bruderer & Boldt (2001) is recommended for use in relation to collision risk modelling.
Avoidance rates and behaviour
Confidence: Low
There are no macro-, meso-, or micro-scale avoidance rates for this species. A total avoidance of 0.99 has been suggested (NatureScot, 2017), but the associated confidence is low. A macro avoidance rate of 0.28 has been suggested for raptors as a group, but with low certainty, based on the percentage of birds tracked by radar entering a wind farm in the North Sea (Krijgsveld et al. 2011). A strong avoidance response to wind farm was indicated by a radar study of migrating raptors in the south of Mexico, with raptors adjusting flight trajectories to avoid new windfarms; but this was not quantified (Cabrera-Cruz & Villegas-Patraca, 2016). A combination of radar and laser rangefinder tracking data, used to measure the migration flight directions of raptors on autumn migration in Denmark, found a negative macro avoidance of wind farms of -0.05 (range between -0.065 to -0.040; Skov et al. 2016).
A comparison of predicted and observed collision rates based on post-construction monitoring data suggests that within-windfarm avoidance rates for raptors is likely to be high. It is recommended that an avoidance rate of 0.9957 ± 0.00006 is assumed for collision risk modelling (Table 5).
Montagu's Harrier Circus pygargus
SPA Species? |
No, but Annex 1 |
|---|---|
SPA site codes (Introduction, Table 2) |
n/a |
Population size breeding (UK) |
8 pairs (APEP4, 2020); uncertainty: low |
Population size non-breeding (UK) |
None; uncertainty: low |
Population size (Biogeographic flyway, SPA season) |
109,000-184,000 individuals (European breeding, BirdLife international, 2021); uncertainty: high |
Percentage of biogeographic population at risk of collision in UK waters (passage / breeding / non-breeding) |
0.01% (breeding); uncertainty: high |
Movement of breeding birds
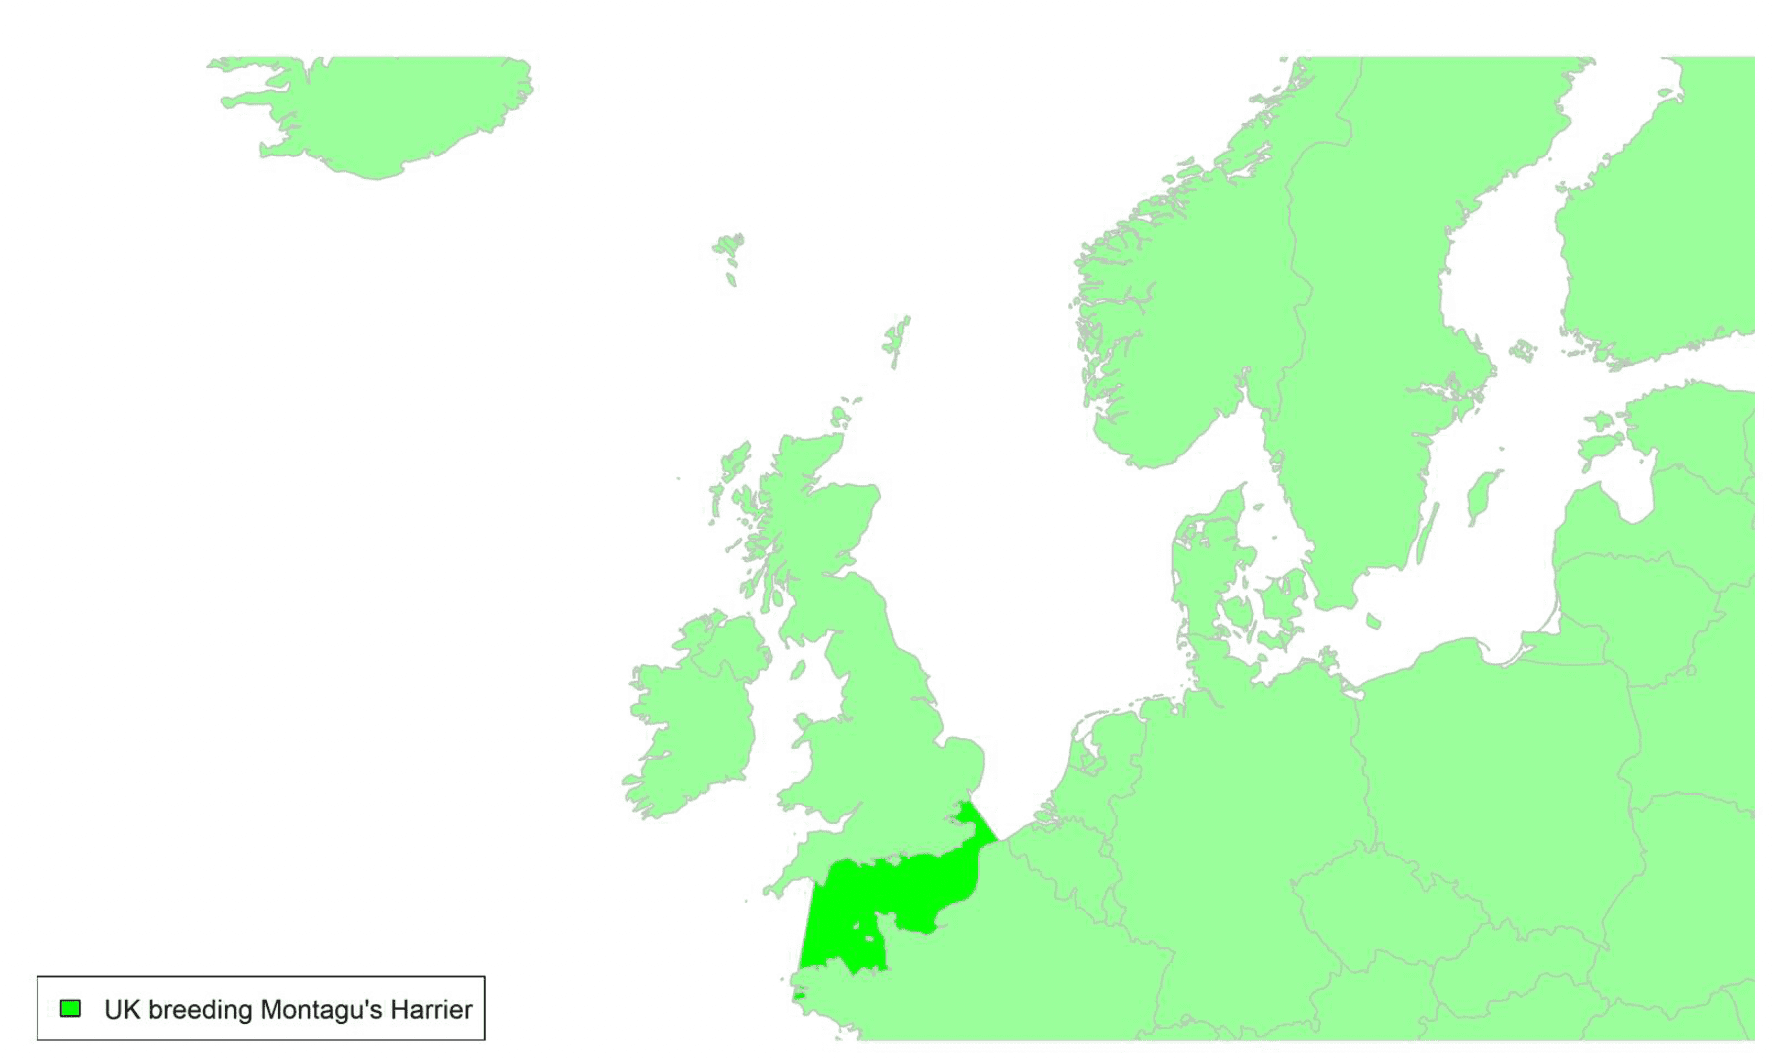
Migratory routes
Confidence: Medium
Montagu's Harrier breeds across central and southern Europe into western Asia. It is a rare breeding species in the UK with a small number of pairs breeding in southern and eastern England. It is also a scarce passage migrant, generally observed in spring. Montagu's Harriers are a migratory species in northwest Europe, with UK individuals wintering in sub-Saharan Africa and migrating via France and Spain, as has been shown by satellite tagging of several breeding individuals in the UK (https://www.rspb.org.uk/our-work/conservation/satellite-tracking-birds/tracking-montagus-harriers, viewed 27/1/2022) This migration route is used by most Montagu's Harriers breeding in western Europe, during spring and autumn, although a more eastern route via Italy is occasionally taken by individuals (Garcia & Arroyo, 1998; Klaassen et al. 2017; Trierweiler et al. 2014, 2007). UK breeding birds therefore cross the English Channel as shown by the green shaded area on the above map. The Montagu's Harrier is not a feature of any UK SPAs, and only a small proportion of the international population breeds within the UK. Consequently, less than 0.1% of the biogeographic population could potentially be at risk from collision with wind turbines in UK waters. This estimate excludes passage migrants which are also not shown on the breeding map, but their numbers also are likely to be small as passage records are scarce (Balmer et al. 2013).
Montagu's Harriers largely migrate during daylight but may migrate at night when necessary, for example during sea crossings (Klaassen et al. 2017; Limiñana et al. 2007; Spaar & Bruderer, 1997).
Timing of migration
Confidence: Low
Based on the BirdTrack reporting rates (see Appendix 2), Montagu's Harriers in southeast and southern England show a spring pulse of migration between mid-April and mid-June and an autumn pulse between mid-July and the end of August. In Eastern England spring migration occurs between early April and early to mid-May, and autumn migration between early August and mid-September. Data from satellite tagged adults show departure from the UK between mid- to late August. Too few BirdTrack data are available for coastal Scotland.
Flight heights
Confidence: Medium
Estimates of Montagu's Harriers flight heights, during spring and autumn migration, are available from three studies: one using radar (where values were combined for Montagu's and Pallid Harriers given the difficulties of identifying some individuals to species level at a distance); one using PTT satellite transmitters; and one using GPS tags.
Flight heights using radar of migrating harriers over land in two areas of Israel were recorded during spring migration (Negev Highlands: 240 ± 130 m, N = 6; Arava Valley: 505 ± 205 m, N = 17) and autumn migration (Negev Highlands: 280 ± 80 m, N = 6; Arava Valley: 540 ± 225 m, N = 40) (Spaar & Bruderer, 1997).
Flight heights estimated from PTT Satellite tags for five individuals during autumn migration, over land and sea, from northeastern Spain to their wintering grounds in sub-Saharan Africa ranged between 54.56 ± SD 47.49 m to 97.18 ± SD 173.41 m (Limiñana et al. 2007).
Given the height of offshore turbines (22–300m a.s.l.) and the fact that reported mean heights for Montagu's Harrier are all within this window, it is recommended that a precautionary assumption of 100% of flights at collision risk height is used.
Flight speeds
Confidence: Medium
Flight speeds of Montagu's Harriers have been estimated from two studies both using radar.
The first study combined values for Montagu's and Pallid Harrier and recorded a mean air flight speed of 13.88 ± 2.72 m/s (N = 36) during inter-thermal gliding in spring and autumn migration over land in the Arava Valley and Negev Highlands, Israel. They also recorded a mean climbing rate in thermal circling of 1.48 ± 0.67 m/s (N = 20) (Spaar, 1997).
The second study recorded a mean air flight speed of 10.7 ± 2.2 m/s (N = 13) during autumn migration over the south coast of the Iberian Peninsula (Meyer et al. 2003).
As the data presented in Meyer et al. (2003) relate exclusively to Montagu's Harrier in coastal regions, it is recommended that a value of 10.7 ± 2.2 m/s be used for the purposes of collision risk modelling.
Avoidance rates and behaviour
Confidence: Low
Based on data from GPS tracked breeding males, comparing observed and expected distributions of tracks within the risk distance of wind turbines, Montagu's Harriers showed significant avoidance behaviour, with an avoidance rate of 93.5% (Schaub et al. 2020).
A comparison of predicted and observed collision rates based on post-construction monitoring data suggests that within-windfarm avoidance rates for raptors is likely to be high. It is recommended that the avoidance rate for all raptors of 0.9957 ± 0.00006 is assumed for collision risk modelling (Table 5).
White-tailed Eagle Haliaeetus albicilla
SPA Species? |
No, but Annex 1 |
|---|---|
SPA site codes (Introduction, Table 2) |
None |
Population size breeding (UK) |
123 pairs (APEP4, 2020); uncertainty: low |
Population size non-breeding (UK) |
Unknown |
Population size (Biogeographic flyway, SPA season) |
9000 – 12,300 pairs (NW European); uncertainty: high (BirdLife International, 2021) |
Percentage of biogeographic population at risk of collision in UK waters (passage / breeding / non-breeding) |
1.2%; uncertainty: high |
A) Movement of breeding and wintering birds
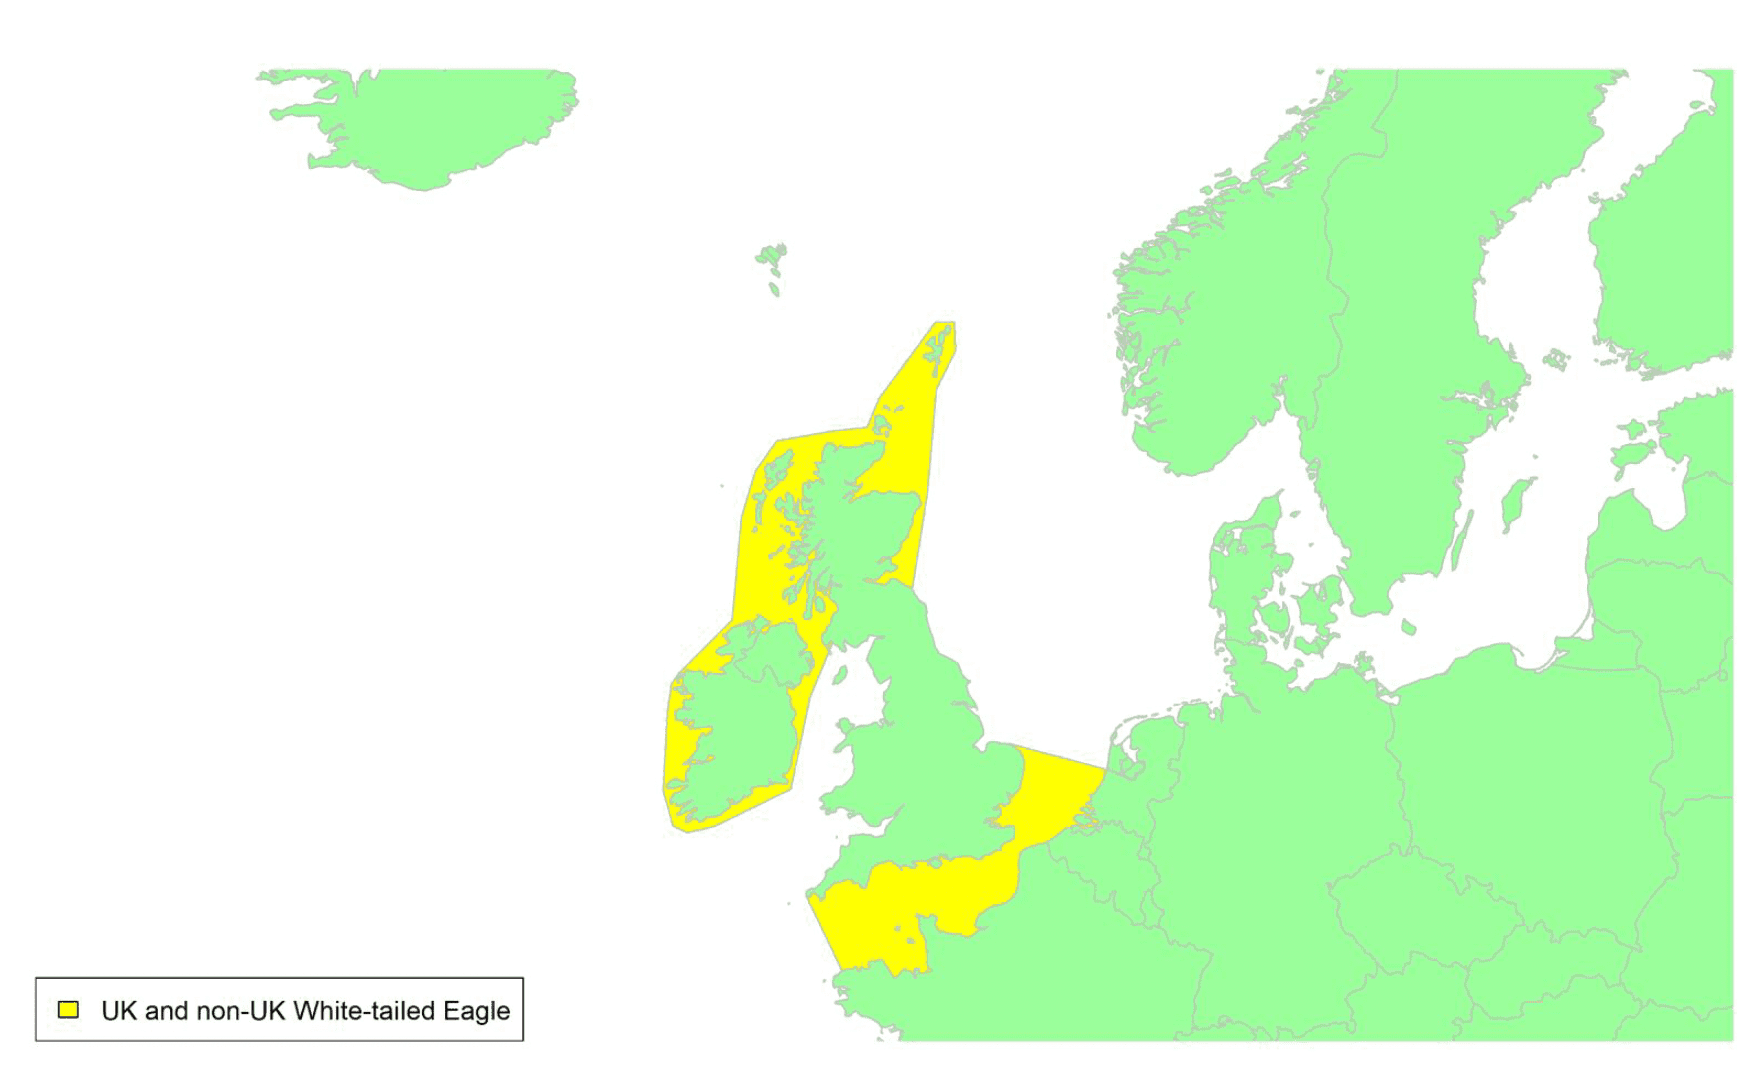
Migratory routes
Confidence Low
White-tailed Eagles are largely found in north and west Scotland, with occasional pairs in the east and mid-Scotland, associated with successful reintroductions (Love & Ball, 1979; Sansom et al. 2016; Eaton et al. 2020). Since 2019, juvenile White-tailed Eagles have also been reintroduced to the Isle of Wight (www.roydennis.org/isleofwight, viewed 27/01/2022). White-tailed Eagles are largely resident, remaining in their territories during the winter (Krone et al. 2013). However, some individuals, particularly immatures can disperse over large distances. In western Scotland, resident individuals frequently move between the islands and mainland and therefore should be considered in assessments for offshore wind farms in this region, especially given that this species can feed extensively over the sea (Furness et al. 2013). Year-round territories of White-tailed Eagles can vary considerably among individuals, i.e., ranging from 13.59 - 669.71 km2, based on four breeding adults tagged in Germany (Krone et al. 2013).
Dispersal distances of juvenile eagles can also vary (Rymešová et al. 2021), with natal dispersal of wing-tagged individuals in Scotland settling on territories between 18 and 200 km from where they hatched or were released (Whitfield et al. 2009). Dispersal of juvenile eagles released in Ireland was largely over land within the country, however at least six individuals dispersed to Scotland (Mee et al. 2016).
White-tailed Eagles could therefore cross any of the UK waters around Scotland and Ireland, with the reintroduced birds on the Isle of Wight most likely to cross the English Channel and southernmost part of the North Sea. The proportion of the biogeographic population that could be potentially at risk of collision with wind turbines in UK waters is just over 1%; this excludes the recently introduced birds on the Isle of Wight which have not yet reached breeding age.
Timing of migration
Confidence Low
The BirdTrack reporting rates (see Appendix 2) suggest that summer movements occur between mid-April and mid-May, and late-May to mid-July, with a pulse of autumn dispersal between early August and early November. However, there is much regional variation, with no clear dispersal pattern where reporting rates are low. In the Hebrides, where a large proportion of the breeding population is concentrated, there is a spring decline in reporting rates between early February and early April and an autumn increase between mid-August and the end of November. In the Forth and Tay region, reporting rates are low until an autumn pulse between mid-August and mid-October. Although reporting rates are also low in Orkney, the reporting rates suggest a summer arrival between early April and the end of May, and summer departure between the end of July and the end of August. The complex pattern in reporting rates in Argyll and the Highlands maybe attributed to resident pairs and the dispersal of immatures/non-breeders across these regions.
White-tailed Eagles are thought to have limited flight activity at night (Furness et al. 2013).
Flight heights
Confidence: Medium
Two studies have quantified flight heights of White-tailed Eagles based on GPS tracking. A mean flight height of 75 ± SD 93 m (range 1 - 543 m above ground level, N = 464 in-flight positions from 14 individuals) was recorded from juveniles tracked in Finland from fledging until dispersal from the natal area, largely over land (Balotari-Chiebao et al. 2016). From dispersal movements, pre-breeding, of these 14 individuals, a mean flight height of 90 ± SD 151 m was recorded over sea, and 198 ± 209 m over land (Balotari-Chiebao et al. 2018).
A study of 28 individuals in Norway, which estimated height by GPS, found the proportion of flights at collision risk height (29-111m) varied by season: spring, 0.241; summer, 0.231; autumn, 0.170; winter, 0.32 (May et al. 2011). A second study in Norway, which estimated height by rangefinder (244 observations), found that the proportion of flights at collision risk height varied by flight behaviour: moving, 0.33; social, 0.2; soaring, 0.35 (Dahl et al. 2013).
Given the height of offshore turbines, based on these data, a precautionary approach would be to assume that 100% of flights take place at collision risk height.
Flight speeds
Confidence: Medium
A mean airspeed of 14.4 ± 1.04 SD m/s was recorded for White-tailed Eagles migrating along the coast of Sweden in the Baltic during autumn, based on 13 runs, using a theodolite (Pennycuick et al. 2013).
For the purposes of collision risk modelling, a flight speed 14.4 ± 1.04 m/s of is recommended.
Avoidance rates
Confidence: Low
Based on modelled GPS tracks and observed collisions of White-tailed Eagles at Smøla Wind Farm, Norway, a total wind farm avoidance rate of 0.98 was estimated (range: 0.95-0.99; May et al. 2011).
A comparison of predicted and observed collision rates based on post-construction monitoring data suggest a within-windfarm avoidance rates for White-tailed Eagles of 0.987 (SD 0.0019) (Table 5).
An avoidance rate of 0.9872 ± 0.00192 is recommended for collision risk modelling.
Short-eared Owl Asio flammeus
SPA Species? |
Yes, breeding populations |
|---|---|
SPA site codes (Introduction, Table 2) |
50:60:107:125:168:173:211 |
Population size breeding (UK) |
620 – 2,200 pairs (APEP4, 2020); uncertainty: high |
Population size non-breeding (UK) |
Unknown |
Population size (Biogeographic flyway, SPA season) |
54,700 – 186,000 pairs; uncertainty: high (BirdLife International, 2021) |
Percentage of biogeographic population at risk of collision in UK waters (passage / breeding / non-breeding) |
>0.3%–4.0% breeding; uncertainty: high |
Movement of breeding birds
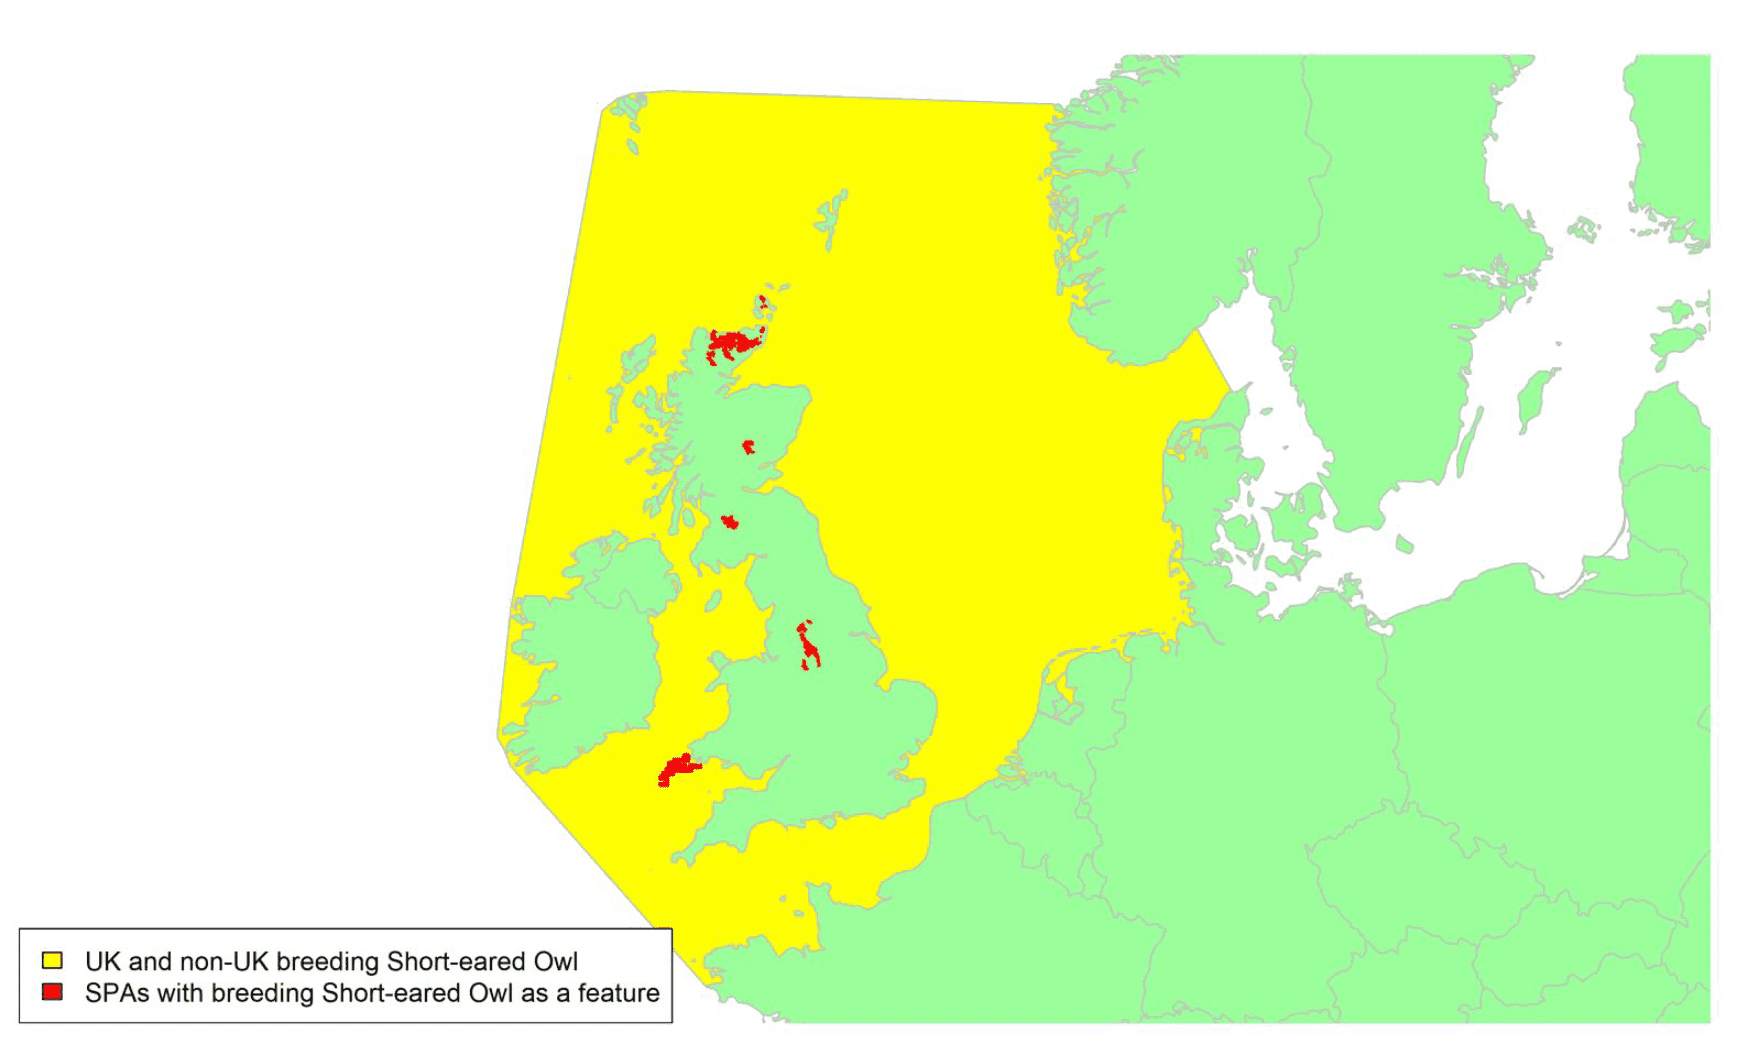
Migratory routes
Confidence: Medium
The Short-eared Owl has a wide circumpolar distribution with multiple sub-species, of which one is found in Britain and Ireland. The nominate A. f. flammeus breeds across Eurasia, including Britain and Ireland, mainly nesting in tundra, boreal and temperate zones (Wernham et al. 2002). Within Britain, they are most frequently found breeding in uplands, moorlands, and bogs, mostly in northern England and Scotland (Balmer et al. 2013). Densities of breeding birds are strongly related to prey abundance, and patterns of migration in Europe follow cycles in vole populations (Newton, 2006). For example, one bird wing-tagged on breeding grounds in southern Scotland was found the next year breeding on Shetland following a crash in vole numbers (Village, 1987). In winter, many Short-eared Owls move to coastal, farmland and downland areas, where they generally roost communally (Wernham et al. 2002). Many Scottish breeders move south to winter in England, with some moving to Ireland and some undertaking long-distance travel and water crossings to mainland Europe (Wernham et al. 2002). Short-eared Owls mainly occur in Ireland as winter visitors only. Birds breeding in northern Europe are strongly migratory, and there is a substantial influx of Short-eared Owls into the UK in late autumn including recoveries from Fennoscandia, Belgium, Germany, and the Faroe Isles, many of which stay for the winter (Wernham et al. 2002).
Short-eared Owls GPS tagged by the BTO in central and western Scotland showed various migratory behaviours. Tracking data showed one bird made wide-ranging flights around Britain and Ireland, and made several crossings of the North Sea, apparently breeding in both Scotland and Norway in the same year (https://www.bto.org/our-science/topics/tracking/tracking-studies/short-eared-owl-tracking). Another bird flew south to Devon, before continuing to France and Morocco. Tracking data are shown on the maps in Appendix 1. The 90% density kernel shown on the above map is based on very few individuals however and has a low associated confidence.
Short-eared Owl breeding in Scotland are therefore likely to cross most parts of the North Sea, as well as the Channel, the Irish Sea, the Atlantic west of Scotland, and the waters off the north coast towards the Faroe Isles, as indicated by the yellow shading on the above map.
The breeding birds in the UK make up less than 1% of the biogeographic population of Short-eared Owls. The proportion of the population which could be potentially at risk of collision with wind turbines in UK waters will be higher as the influx of passage and winter visitors needs to be taken into account. However, it is not possible to produce a more precise estimate as the non-breeding population in the UK is unknown.
Timing of migration
Confidence: Low
Main dispersal away from breeding grounds occurs between August and November, though some individuals continue to wander throughout their first year (Wernham et al. 2002). Ring recoveries suggest movements to the coast from July and October, with some movement westward to Ireland notable in November (Wernham et al. 2002). There is an influx of Short-eared Owls from the Continent between late August and November, mainly to the east coast. Peak autumn movements around UK coasts can be inferred from a pulse in BirdTrack reporting rates (see graphs in Appendix 2) between mid-September and early December. Short-eared Owls breeding in Scotland return to breeding grounds from early March. Return spring passage occurs between April and May, particularly along the east coast. Peak spring movements can be inferred from increased BirdTrack reporting rates in Scottish regions and Wales between early April and mid-May, and corresponding decreases in some English regions, particularly eastern England (where wintering birds are likely to originate from European breeding populations). The BirdTrack reporting rates for the Scottish coasts and Wales suggest that some outbound migration may take place in summer; however, movements of this species are poorly understood and recent tracking suggests that they may be complicated (https://www.bto.org/our-science/topics/tracking/tracking-studies/short-eared-owl-tracking). Consequently, confidence in timing of migration movement remains low even though tracking data are available.
Short-eared Owls largely migrate at night, with some movements during the day (Johnson et al. 2017).
Flight heights
Confidence: Low
There are no flight heights reported for this species. In the absence of such data, it is recommended that a precautionary assumption of 100% of migratory flights at collision risk height is assumed.
Flight speeds
Confidence: Medium
Two studies have reported flight speeds of Short-eared Owls. Radar tracking of birds in Europe, the Middle East and Israel showed mean airspeeds of 8.4 m/s (± 1.4 SD) across 3 tracks (Bruderer & Boldt, 2001). Satellite tags attached to 26 Short-eared Owls in the Western USA recorded maximum groundspeeds of between 9.7 and 12.5 m/s (Johnson et al. 2017).
Distance/time calculations carried out for the present study, using tracking data from UK-tagged Short-eared Owls (25 speed estimates from six birds), gave a median groundspeed of 5.95 m/s (SD 3.63, min 0.53 m/s, max 13.63 m/s).
Reflecting the sample sizes of these studies, it is recommended that a flight speed of 9.7 m/s from Johnston et al. (2017) be used for collision risk modelling. In the absence ofadditional data with which to estimate variability around these figures, drawing from typical values for other species, a standard deviation of 2 m/s is suggested for this species.
Avoidance rates and behaviour
Confidence: Very Low
No reliable macro-, meso- or micro-avoidance rates have been reported for this species. A macro avoidance rate of 0.28 has been suggested for raptors based on the percentage of birds tracked by radar entering a wind farm in the North Sea (Krijgsveld et al. 2011). A strong avoidance response to offshore wind was indicated by a marine radar study of migrating raptors in the south of Mexico, with raptors adjusting flight trajectories to avoid new windfarms; but this was not quantified (Cabrera-Cruz & Villegas-Patraca, 2016).
In the absence of more detailed data relating to owl avoidance, it is recommended that an all-raptor rate of 0.9957 ± 0.00006 is used for collision risk modelling.
Merlin Falco columbarius
SPA Species? |
Yes (breeding and non-breeding populations) |
|---|---|
SPA site codes (Introduction, Table 2) |
9:20:37:45:46:50:60:82:106:107:117:125:143: 168:204:207:208 |
Population size breeding (UK) |
1,150 (890 – 1,450) pairs (APEP4, 2020); uncertainty: medium |
Population size non-breeding (UK) |
Unknown |
Population size (Biogeographic flyway, SPA season) |
32,000 – 51,600 pairs (Europe, breeding); uncertainty: high (BirdLife International, 2021) |
Percentage of biogeographic population at risk of collision in UK waters (passage / breeding / non-breeding) |
2%–8% (breeding); uncertainty: high |
Movements of breeding birds
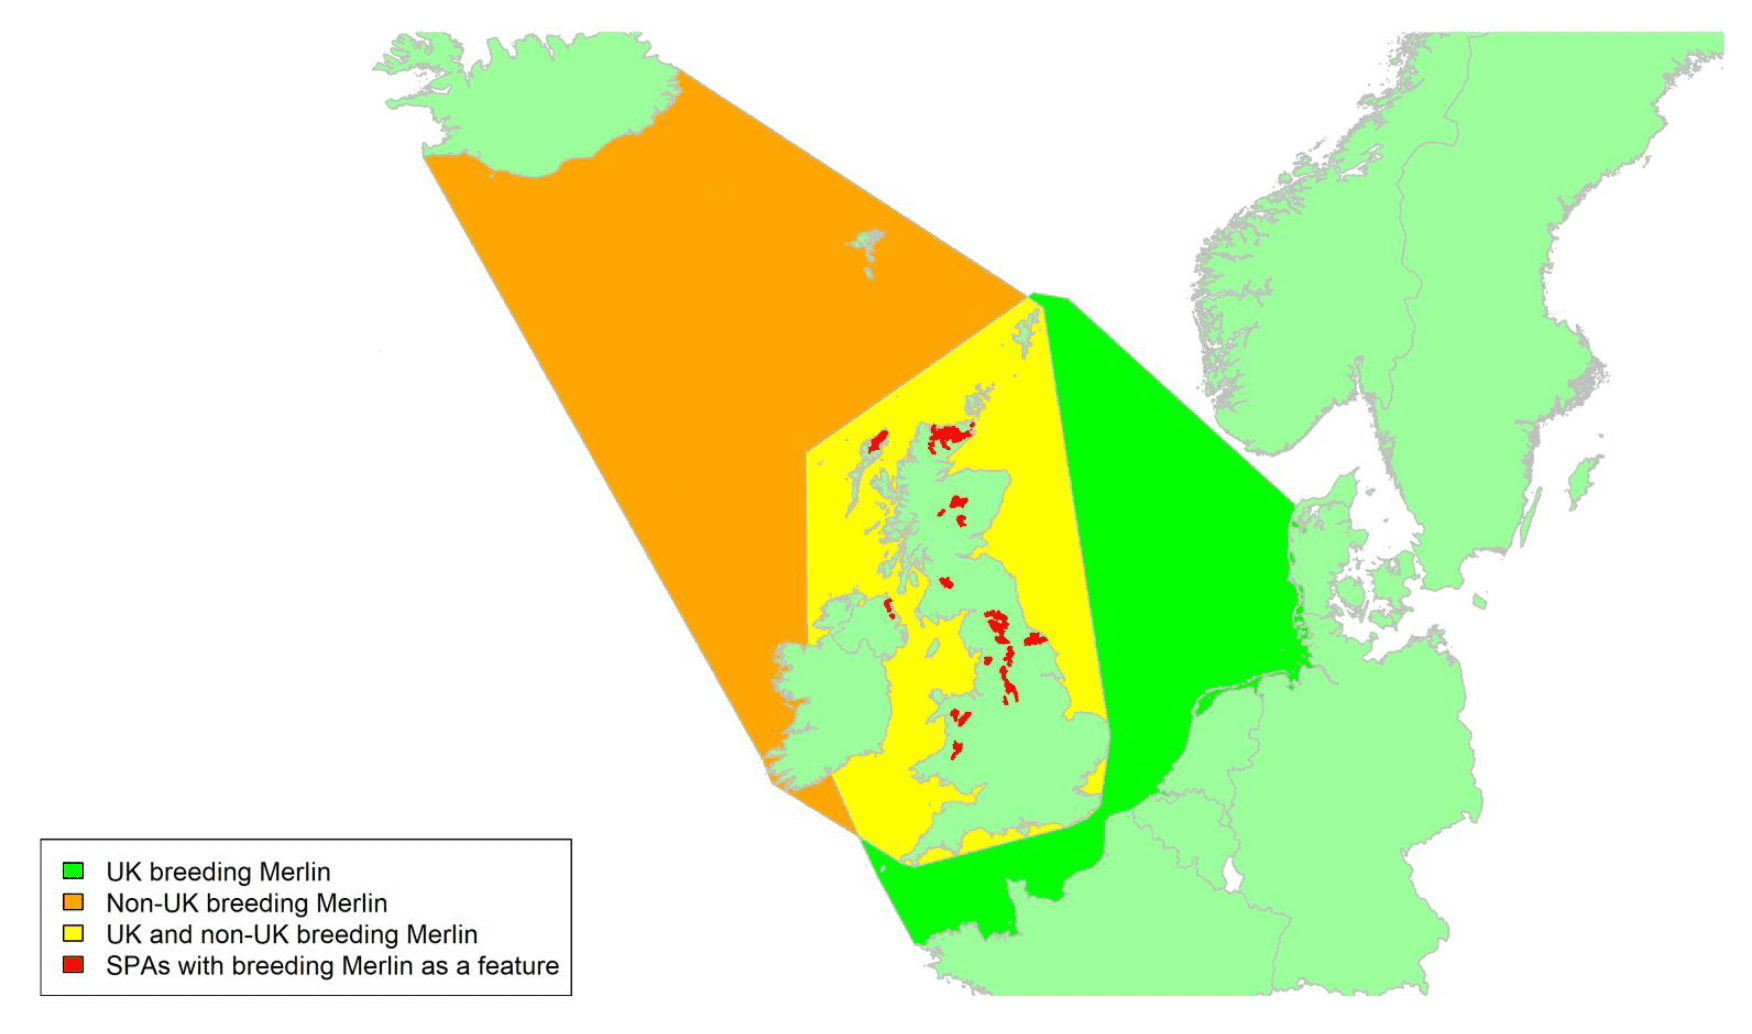
Migratory routes
Confidence: Low
The Merlin is a widespread species, found across North America, Europe, and central Asia. Two subspecies are found in the UK. The F. c. aesalon subspecies breeds from Ireland to northwest Siberia and is resident year-round. Resident Merlins make altitudinal migrations from upland breeding areas to inland lowland and coastal areas for winter, with most remaining within the UK; however, some British breeders have been recovered from western France and Spain (Wernham et al. 2002). In contrast, F. c. subaesalon breeds in Iceland, and winters in Britain, Ireland, and southwest Europe: Merlins are long-distance migrants and can make long water crossings (Bildstein, 2004). The main movements of Merlin across UK waters therefore occur when F. c. subaesalon birds migrate to and from their breeding grounds in Iceland to wintering areas across Britain, Ireland, and further south. Resident birds may sometimes also make movements across water during their autumn and spring migratory movements. Ringing recoveries indicate substantial movement between mainland Scotland and the Western and Northern Isles.
UK breeders may therefore pass through most coastal waters around the UK, indicated by the yellow shading on the above map, including southerly movements of birds breeding on Orkney and Shetland. Some UK breeders will also cross the North Sea, as indicated by the green shading. Icelandic breeders will pass through northwest Scottish waters on migration, indicated by the orange shading on the above map. There is very little information on what specific routes Merlin travel during migration, with no new studies since Wright et al. (2012), and so a broad corridor of movement must be assumed.
Based on the population estimates, UK breeding birds make up between 1.7% and 4.5% of the European population of Merlin. The Icelandic population is estimated 1,000–1,200 pairs (BirdLife International, 2015); hence between 2.0% and 3.8% of the European population. A large proportion of the Icelandic breeders could be potentially at risk of collision with wind turbines in UK waters as well an unknown proportion of UK breeders (possibly small). Hence, the proportion of the European population potentially at risk of collision is estimated to be between 2% and 8% (and is possibly closer to the lower end of this estimate if it is correct that most UK birds remain in the UK overwinter).
Timing of migration
Confidence: Low
A marked change in reporting rates of Merlin on Scottish coasts and in Wales indicates peak spring migration between late March and early May (see Appendix 2). Reporting rates decline steadily in the east of England between January and early May, but there is no clear peak in migration timing. However, a marked decrease in reporting rates occurs in northwest England between mid-March and mid-May. Autumn migration occurs between the mid-August and the end of November, with reporting rates peaking in October. Differences in timings of migratory movements between resident Merlins moving between wintering grounds in lowland and coastal areas to upland breeding areas, and migratory movements of Icelandic birds coming to Britain and Ireland for winter, are not clear. However, the records from southern and eastern English regions are likely to involve mostly birds breeding overseas and hence may give the best indication as to when most inbound and outbound movements may occur.
It is likely that the majority of over-sea migration occurs during the day, to take maximum advantage of thermals in the manner of most migrating raptors (Newton, 2010). However, nocturnal flight may be necessary at times, particularly where routes include extensive overwater flights or in cases of adverse weather.
Flight heights
Confidence: Low
There is very little data available on flight heights of migrating Merlin. One study found mean flight heights of 7.5 m ± 6.1, based on three Merlin recorded with a clinometer and rangefinder at an overland site in Texas, USA (Wulff et al. 2016). Of these birds, none were at a potential collision risk height of 32-124m. In the absence of specific data relating to migration over the sea, it is recommended that a precautionary assumption of 100% of birds at collision risk height is used.
Flight speeds
Confidence: Low
There is very little data available on flight speeds of migrating Merlin. One radiotracking study (at an unspecified location, but likely to be in North America) recorded the flight speeds of four birds. The study reported an average groundspeed of 12.7 m/s ± 5.8, for flapping flight only (Cochran & Applegate, 1986).
For the purposes of collision risk modelling, it is recommended that a flight speed of 12.7 m/s ± 5.8 is assumed.
Avoidance rates and behaviour
Confidence: Very Low
No reliable avoidance rates have been reported for this species, and there is low certainty around avoidance rates of raptors as a group. A macro avoidance rate of 0.28 has been suggested for raptors based on the percentage of birds tracked by radar entering a wind farm in the North Sea (Krijgsveld et al. 2011). A strong avoidance response to offshore wind was indicated by a marine radar study of migrating raptors in the south of Mexico, with raptors adjusting flight trajectories to avoid new windfarms; but this was not quantified (Cabrera-Cruz & Villegas-Patraca, 2016).
Analysis of data collected from falcons at onshore wind farms suggests avoidance is likely to be high. Reflecting this, it is recommended that an avoidance rate of 0.9891 ± 0.00033 is used.
Contact
Email: ScotMER@gov.scot
There is a problem
Thanks for your feedback