Scottish Social Attitudes Survey 2019: intra-household distribution of resources
Looks at how couples organise their income and financial responsibilities and how they conduct financial decision-making.
This document is part of 2 collections
Chapter 2 – Income organisation
The Family Resources Survey collects income data at household level in Scotland, however it does not allow for intra-household analysis. In order to better understand how couples who live together in Scotland organise their income and financial responsibilities, SSA 2019 asked all those living with a partner a series of questions about what they do with their personal income, in whose name certain financial assets are held and in whose name any child benefits are received. Asking these questions not only helps us to understand how couples in Scotland organise their income, but also helps us to see if there are any differences between how men's and women's income is organised or in whose name assets are held.
Organisation of personal income
All those who were living with a partner at the time of the survey were asked a series of questions on how they organise their income. Respondents were first asked how they organise their own personal income and were shown five possible response options. Respondents were then asked how their partner organises their own personal income.
People organise their income in different ways. Which of the following statements comes closest to what you do with your own personal income?
1. I keep all (or almost all) of my own income
2. I keep most of my own income and put the rest into a joint bank account or pool with my partner
3. I keep about half of my own income and put the other half into a joint bank account or pool with my partner
4. I keep some of my own income and put the rest into a joint bank account or pool with my partner
5. I keep none (or almost none) of my own income and put all (or almost all) of it into a joint bank account or pool with my partner
Table 2.1 below shows that the most common way people with a partner organise their own income is keeping none or almost none of their own income and putting all of it into a joint pool[4], with four out of ten (40%) people with a partner doing this. A fifth (20%) of people living with a partner said they keep all or almost all of their own income, while 16% keep 'some' of their own income, 12% keep 'most' of their own income and 7% keep 'about half' of their own income putting the rest into a joint pool. There were clear differences by gender with women (25%) being significantly more likely than men (15%) to keep all of their own income, while men were more likely (45%) than women (35%) to keep none of their own income and put all of it into a joint pool with their partner. Younger men were significantly more likely than older men to say that they keep all their own income (34% of those aged 16 to 34 compared with 9% of those aged 65 and over). There were no significant differences between women of different ages. Women who rent (36%) were more likely than women who own their own home (22%)[5] to say they kept all of their own income and a similar pattern was seen for men (23% who rent compared with 12% who own their own home).[6]
| Total % | Men % | Women % | |
|---|---|---|---|
| I keep all/almost all of my own income | 20 | 15 | 25 |
| I keep most of my own income and put the rest into a joint pool | 12 | 9 | 15 |
| I keep about half of my own income and put the rest into a joint pool | 7 | 7 | 7 |
| I keep some of my own income and put the rest into a joint pool | 16 | 18 | 14 |
| I keep none/almost none of my own income and put all of it into a joint pool | 40 | 45 | 35 |
| Weighted bases | 642 | 323 | 318 |
| Unweighted bases | 556 | 272 | 284 |
Base: all respondents living with a partner
Respondents were also asked how their partner organises their personal income and the results show that the majority of couples organise their income in the same way. Table 2.2 below shows that just over seven in ten (72%) of those who said they keep all of their own income said that their partner does the same, over eight in ten (83%) of those who keep a portion (most/about half/some) of their own income and put the rest in a joint pool said their partner does the same, and around nine in ten (91%) of those who said they keep none of their own income and put it all in a joint pool said that their partner organises their income in the same way. Of those who said that they keep all their own income and put none of it into a joint pool, 16% said that their partner keeps a portion of their own income and puts the rest in a joint pool and 8% said that their partner keeps none of their own income and puts it all in a joint pool.
As discussed in the previous section, women were more likely than men to say that they keep all of their own income. Women who said they keep all of their own income were also significantly less likely than men (who keep all of their own income) to say that their partner also keeps all of their own income (63% of women compared with 88% of men). Women were also significantly more likely than men to say that their partner keeps a portion (most/about half/some) of their own income (25% of women compared with 1% of men). Nearly all women (96%) who said they keep none of their own income and put it all into a joint pool said that their partner also keeps none of their own income compared with 87% of men who did the same.
| I keep all of my own income (%) | I keep most/about half/some of my own income and put the rest in a joint pool (%) | I keep none of my own income and put all of it into a joint pool (%) | |
|---|---|---|---|
| My partner keeps all of their own income | 72 | 8 | 4 |
| My partner keeps most/about half/some of their own income and puts the rest in a joint pool | 16 | 83 | 5 |
| My partner keeps none of their own income | 8 | 8 | 91 |
| Weighted base | 128 | 227 | 259 |
| Unweighted base | 102 | 202 | 232 |
Base: all respondents living with a partner
How does income organisation between partners living together vary between different societal groups?
The way people living with a partner organise their income and arrange their financial responsibilities varied between different societal groups. There were clear differences by age in how people living with a partner organise their income. For young people aged 16-34, the most commonly cited way (46%) they organise their income is to keep a portion of it (most, about half or some) and put the rest in a joint pool with their partner. For all other age groups, the most commonly cited way they organise their income is to keep none of it and put all of it into a joint pool, whereas this was the least common response for those aged 16-34 with only around a fifth (22%) saying they organise their income this way. Those aged 16-34 and living with a partner were also the most likely to keep all their own income and put none of it into a joint pool, with three in ten (30%) of them doing so compared with between 15% and 20% of their older counterparts.[7] Full results are shown in Table 2.3 below.
| I keep all of my own income (%) | I keep most/about half/some of my own income and put the rest in a joint pool (%) | I keep none of my own income and put all of it into a joint pool (%) | Weighted Base | Unweighted base | |
|---|---|---|---|---|---|
| 16-34 | 30 | 46 | 22 | 132 | 80 |
| 35-44 | 16 | 37 | 42 | 118 | 90 |
| 45-54 | 18 | 39 | 42 | 138 | 124 |
| 55-64 | 20 | 23 | 49 | 108 | 93 |
| 65+ | 15 | 31 | 48 | 144 | 168 |
Base: All respondents living with a partner
Those living with a partner and on lower household incomes were more likely to pool all their income and keep none (or almost none) of it themselves – around three-fifths (63%) of those in the lowest income group did this compared with just under two-fifths (38%) of those in the highest income group.[8] Married couples[9] were also twice as likely (46%) to pool all their income than those living with a partner and not married (23%).
Whether there were children aged 0 to 17 living in the household also affected how couples organise their income. Those with no children in the household were more likely to keep all their own income (22%)[10] than those who have children aged between 0 and 17 (15%) living in the household, as were those who rent their accommodation (28%) compared with those who own their home (17%). There was also a relationship with whether the person was living with a long-term illness or disability, with those living with a long-term illness or disability being more likely to pool all their income with their partner (48%) than those not living with a long-term illness or disability (36%).
Similar demographic trends were evident in the responses to the question on how the person's partner organises their income. Younger people aged 16-34 living with a partner were least likely (25%) to say that their partner keeps none of their own income and puts all of it in a joint pool with themselves, whereas this was the most popular response option for all those living with a partner in the older age groups. The most common response for those aged 16-34 (48%) was that their partner keeps a portion of their own income (most/about half/some) and puts the rest in a joint pool.
Those who were married were much more likely to say their spouse keeps none of their income and puts it all into a joint pool (49%) than those who were living with a partner and not married (18%), while renters were more likely to say their partner keeps all their own income (27%) than those who own their home (17%).
Child benefit and ownership of accommodation
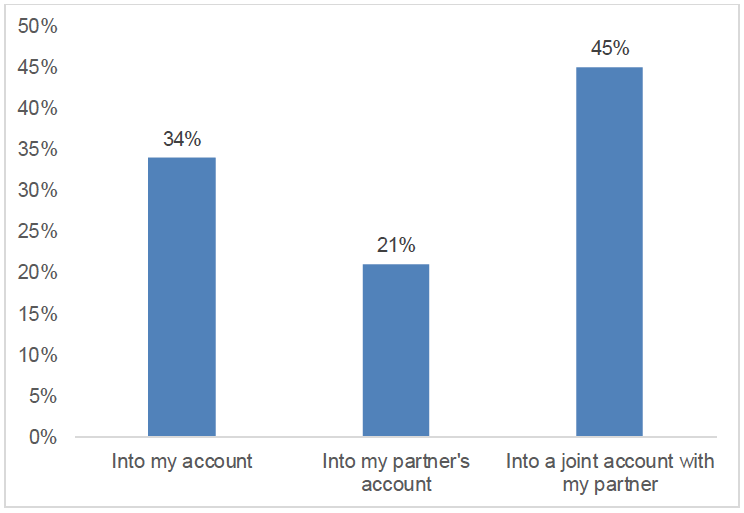
To gauge who in the partnership held certain financial responsibilities, those living with a partner were asked who has child benefit paid into their account (if applicable) and in whose name their accommodation is either owned or rented. Focusing first on child benefit, Figure 2.1 below shows that the most common way child benefit is paid is into a joint account with their partner (45%), around a third (34%) said it is paid into their own account and around a fifth (21%) said it is paid into their partner's account.
Base: all respondents living with a partner
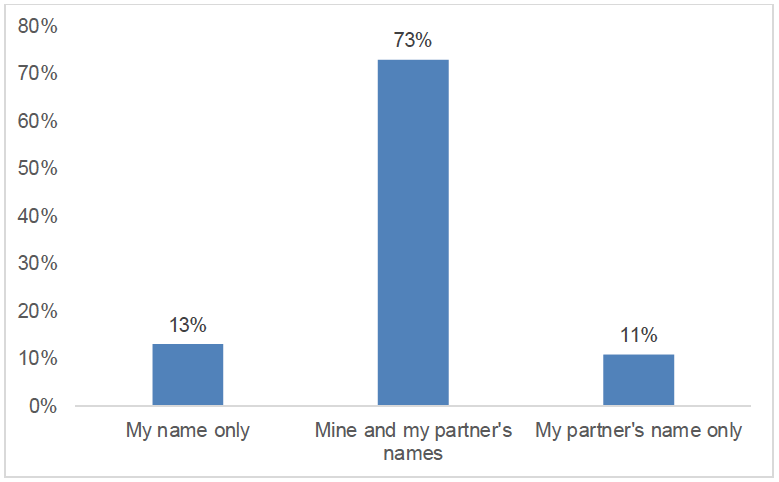
Almost three-quarters (73%) of those living with a partner said that their accommodation is owned or rented in both their own and their partner's names, as shown in Figure 2.2 below. Just over one in ten of those living with a partner said their accommodation is owned or rented in either their own name only (13%) or in their partner's name only (11%).
Base: all respondents living with a partner
How does financial responsibilities between partners living together differ between different societal groups?
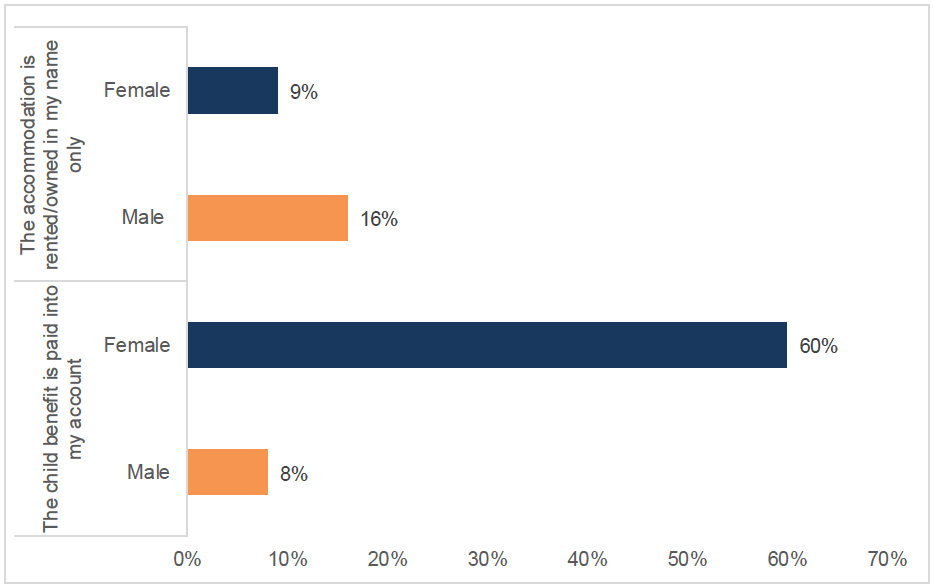
On the payment of child benefit, the clearest demographic relationship was by gender. Figure 2.3 below shows that women were over seven times more likely to say that child benefit is paid into their own account (60%) than men (8%), and men were more likely to say that it is paid into their partner's account (37% compared with only 5% of women). In contrast, men living with a partner were more likely (16%) than women living with a partner (9%) to say that the accommodation they owned or rented is in their name only.
The other key demographic difference on the accommodation question was by marital status, with four-fifths (80%) of married couples stating their accommodation is owned or rented in both their and their partner's name compared with over a half (54%) of those who are living with a partner and not married. Renters were also less likely to say their accommodation is rented in both their and their partner's name (65%) than home owners were to say that their accommodation is owned in both their and their partner's name (77%).[11]
Base: Accommodation: all respondents living with a partner (Weighted base: Women=316, Men=314, Unweighted base: Women=280, Men=267); Child Benefit: All respondents living with a partner and in receipt of child benefit (Weighted base: Women=82, Men=78, Unweighted base: Women=66, Men=53)
Finally, Table 2.4 below shows that those who keep all their own income and put none of it into a joint pool are more likely (31%) to have their accommodation (whether owned or rented) in their name only than those who keep a portion of their own income (8%) or none of their own income (7%). Those who keep a portion (78%) or none of their own income (85%) and put the rest in a joint pool are more likely to have their accommodation in both their and their partner's name than those who keep all their own income and put none of it into a joint pool (46%).
| I keep all of my own income (%) | I keep most/about half/some of my own income and put the rest in a joint pool (%) | I keep none of my own income and put all of it into a joint pool (%) | |
|---|---|---|---|
| Accommodation is in my name only | 31 | 8 | 7 |
| Accommodation is in mine and my partner's names | 46 | 78 | 85 |
| Accommodation is in my partner's name only | 16 | 12 | 7 |
| (Other) | 6 | 3 | 1 |
| Weighted base | 125 | 224 | 258 |
| Unweighted base | 101 | 198 | 231 |
Base: all respondents living with a partner
Contact
There is a problem
Thanks for your feedback