Scottish Housing Market Review: Q3 2021
Summary of the latest Scottish housing market data.
Lending To Homebuyers: Interest Rates
Mortgage Interest Rates
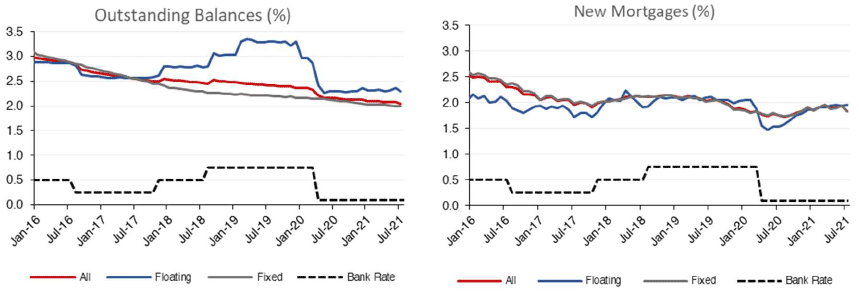
Charts 4.5 & 4.6 show the effective (or average) interest rate on outstanding mortgage balances and new mortgage advances.
In March 2020, Bank Rate was cut by a total of 65 basis points, leaving it at 0.1%. The reduction in Bank Rate has fed through to outstanding variable rate mortgages, with the average interest rate falling from 2.97% in February 2020 to 2.30% in June, before stabilising, with the level at 2.29% in July 2021. The average interest rate on new variable rate mortgages fell from 2.06% in February 2020 to 1.53% in June 2020, although it has since increased to 1.96% in July 2021. The average fixed rate on new mortgages has been relatively stable throughout the period of Covid-19, standing at 1.83% in July 2021. (Source: BoE)
Source: Bank of England
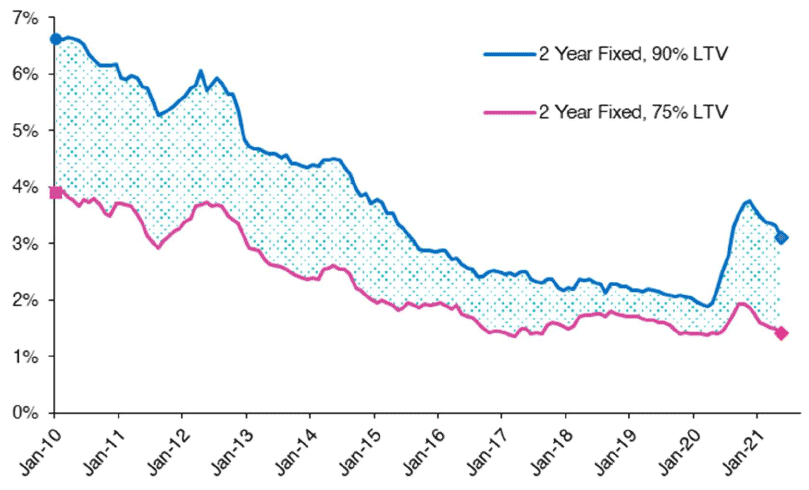
The spread between the average advertised rate on 2 year fixed 90% and 75% LTV mortgages increased during the pandemic from 54 basis points in May 2020 to 188 basis points in February 2021, as shown in Chart 4.7. However, since May 2021 the spread has fallen from 182 basis points to 124 basis points in August 2021, potentially reflecting an increase in lender risk appetite. (Source: BoE)
Source: Bank of England
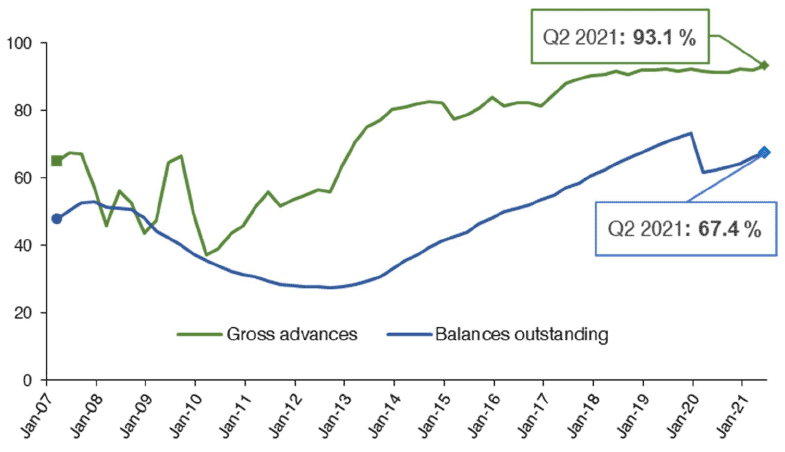
Chart 4.8 shows that the majority of new mortgage lending (93.1%) is on fixed rates. The share of outstanding mortgages on fixed rates fell from 73.2% in Q4 2019 to 61.6% in Q1 2020, possibly due to borrowers whose fixed rate mortgages reached their end of term either choosing to remain on default variable rates, since these had fallen, or being unable to switch immediately to a new fixed rate mortgage due to lender capacity constraints during lockdown. The share has since increased to 67.4% in Q2 2021. (Source: FCA)
Source: FCA
Contact
Email: William.Ellison@gov.scot
There is a problem
Thanks for your feedback