Scottish Household Survey 2020 - telephone survey: key findings
A summary of the key findings from the Scottish Household Survey 2020 telephone survey.
This document is part of a collection
Section one - Housing
The results of the SHS 2020 telephone survey are not directly comparable to SHS results for previous years. Please see Introduction for more detail.
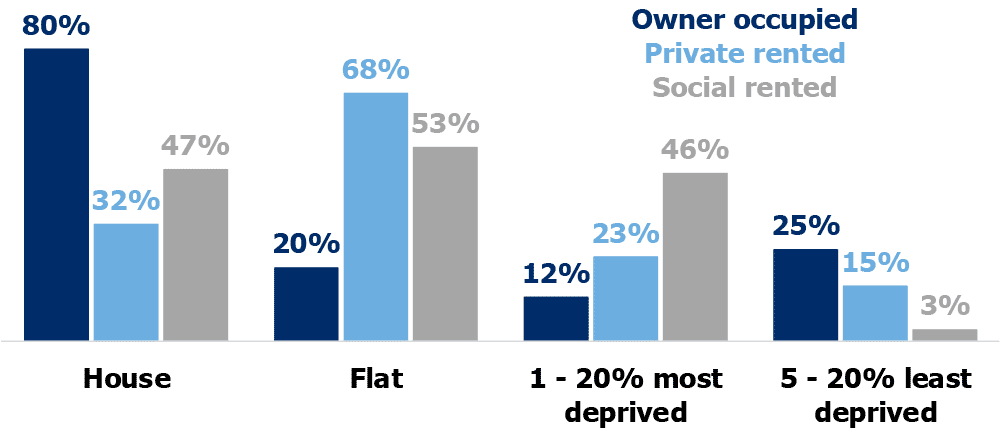
The majority of owner occupied properties (80%) were houses and the majority of private rented properties (68%) were flats (Table 1.7).
46% of social rented households were in the 20% most deprived areas, compared to only 3% in the 20% least deprived areas (Table 1.8).
25% of owner occupied households were in the 20% least deprived areas, compared to 12% in the 20% most deprived areas.
Owner occupiers tended to have lived at their current address the longest, with 59% of adults having lived there for eleven years or more (Table 1.26).
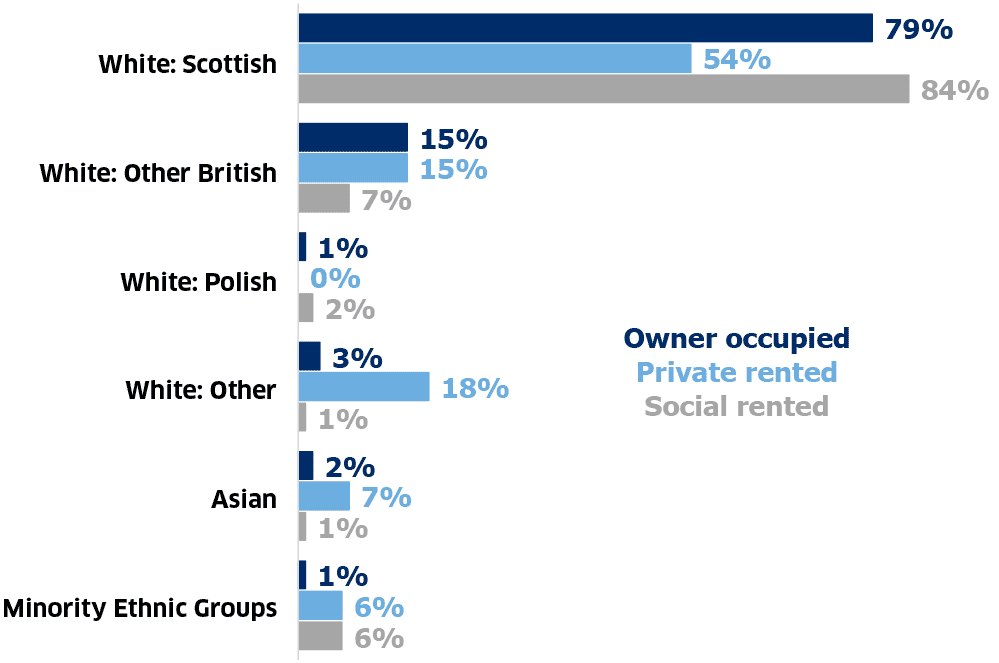
54% of adults in private rented households reported their ethnicity as white Scottish, which is lower than for other tenures (Table 1.24).
Also among adults in private rented households, 18% reported their ethnicity as white ‘other’ (i.e. not white Scottish, other British, or Polish), and 7% reported their ethnicity as Asian. These are higher than for other tenures.
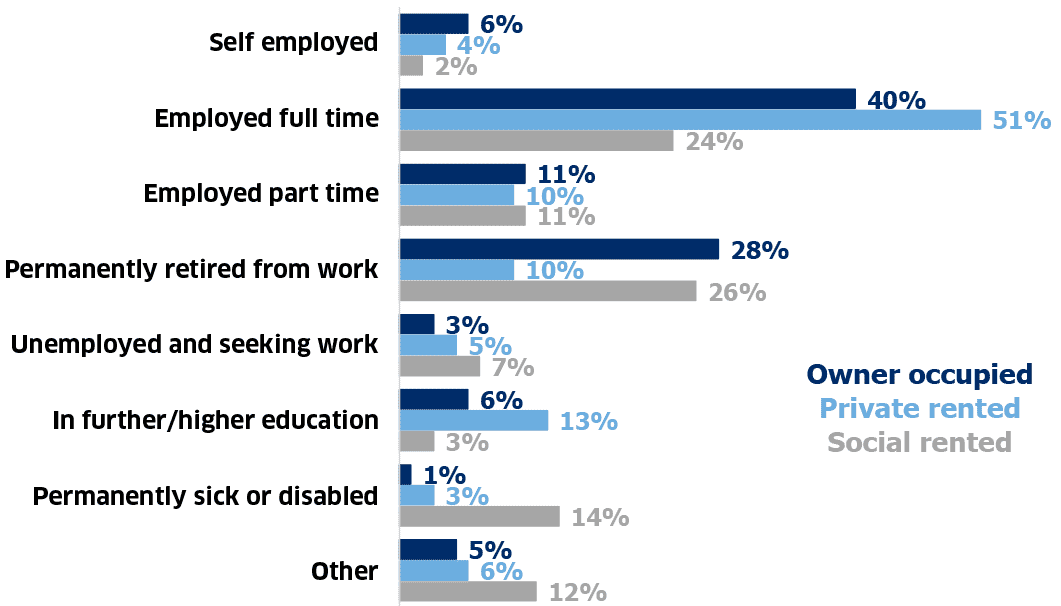
62% of adults in social rented households were not in employment (Table 1.25).
26% were permanently retired from work, 14% were permanently sick or disabled (higher than those in all other tenures), 8% were at school or in further or higher education, 7% were unemployed and seeking work, and 5% were looking after the home or family.
51% of adults in private rented households were employed full time and 13% were in further or higher education, which are higher than for other tenures.
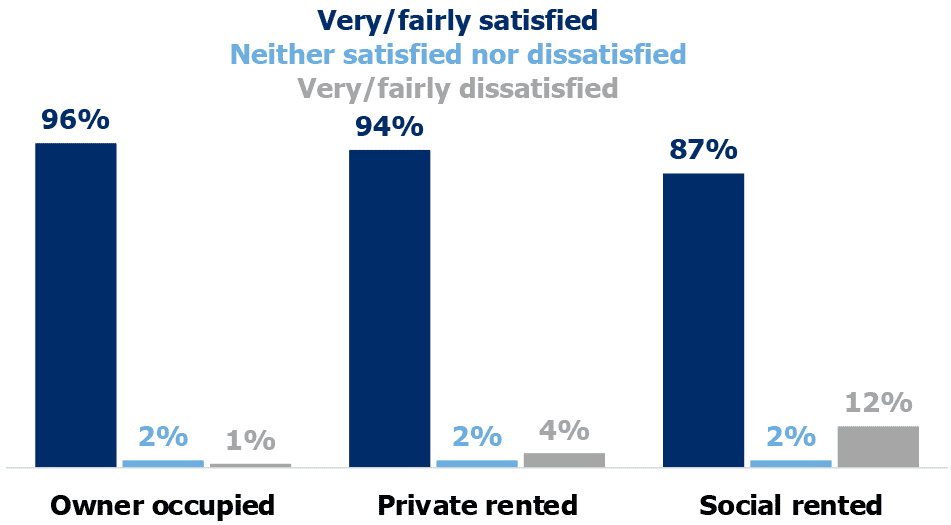
94% of households were either very or fairly satisfied with their housing (Table 1.39).
Owner occupied households (96%) were more likely to be satisfied with their housing than social rented households (87%).
Contact
Email: shs@gov.scot
There is a problem
Thanks for your feedback