Sandeel fishing consultation: review of scientific evidence
The review of scientific evidence that has been used to inform the development of proposals to close fishing for sandeel in all Scottish waters.
3 Fisheries
3.1 Predation on sandeel
Initial analyses of fish stomach contents by ICES (of which the most recent analysis is 1991; ICES 1997) revealed that sandeel constituted up to 20% of age 1 cod diet in July-September and between 5-10% of the diet in other age classes in April to September, when sandeel actively feed. In haddock, sandeel constituted >50% of age 0 fish in April to June and between 40-50% of the diet for all other age classes in July to September. In whiting, sandeel composed around 45% of the diet of all age classes in April to June and decreased to around 20% in July to September. Whiting body condition was also found to be correlated with the amount of sandeel present in their stomachs (Engelhard et al. 2012) and their spatial distribution was found to be influenced by sandeel, with whiting found to aggregate near sandeel-rich areas (Temming et al. 2004, Engelhard et al. 2008).
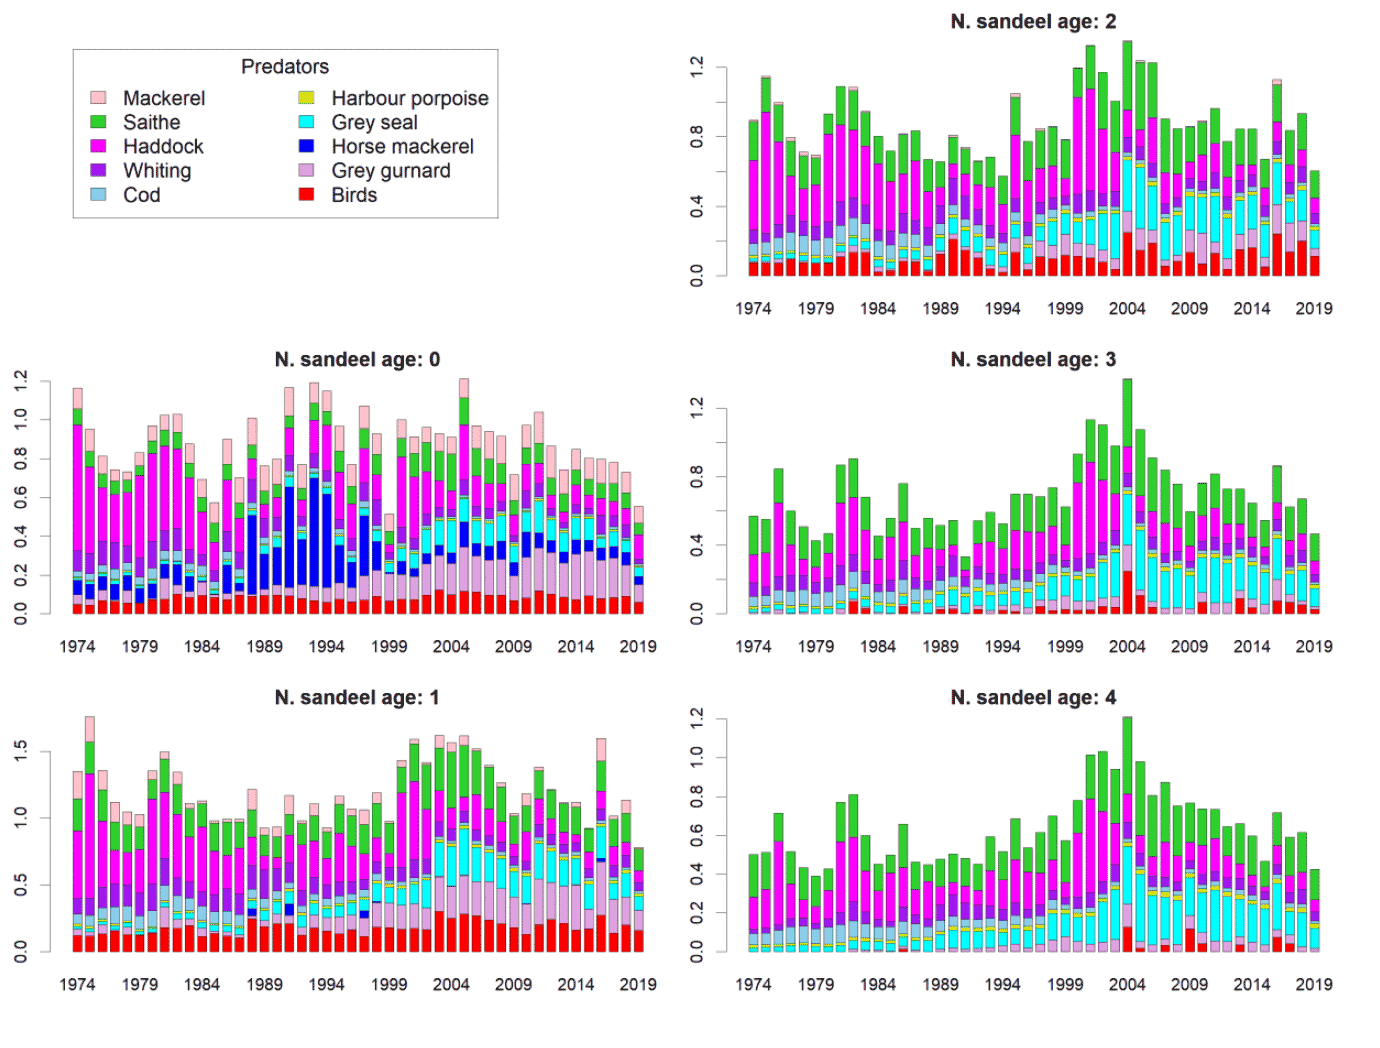
Following these initial analyses, the ICES Working Group on Multispecies Assessment Methods (WGSAM) recommended the use of natural mortality estimates from the North Sea Stochastic Multispecies Model (SMS) key-run for both southern and northern North Sea sandeel. Multispecies models of fish stocks in the North Sea help determine which species prey on which other species, and how important such predation is for total mortality. Predation mortalities are estimated every three years and are based on recent analytical stock assessment data, available data on predators not included in the SMS (including mammals, birds, and other fish), as well as historical sampling data on stomach contents of predators. Results for northern North Sea sandeel are presented from the most recent SMS key-run from 2020 (ICES, 2021). In Figure 17, annual predation mortalities (expressed as M2, the natural logarithm of the ratio of abundance in year t to abundance in year t +1) are shown by age class.
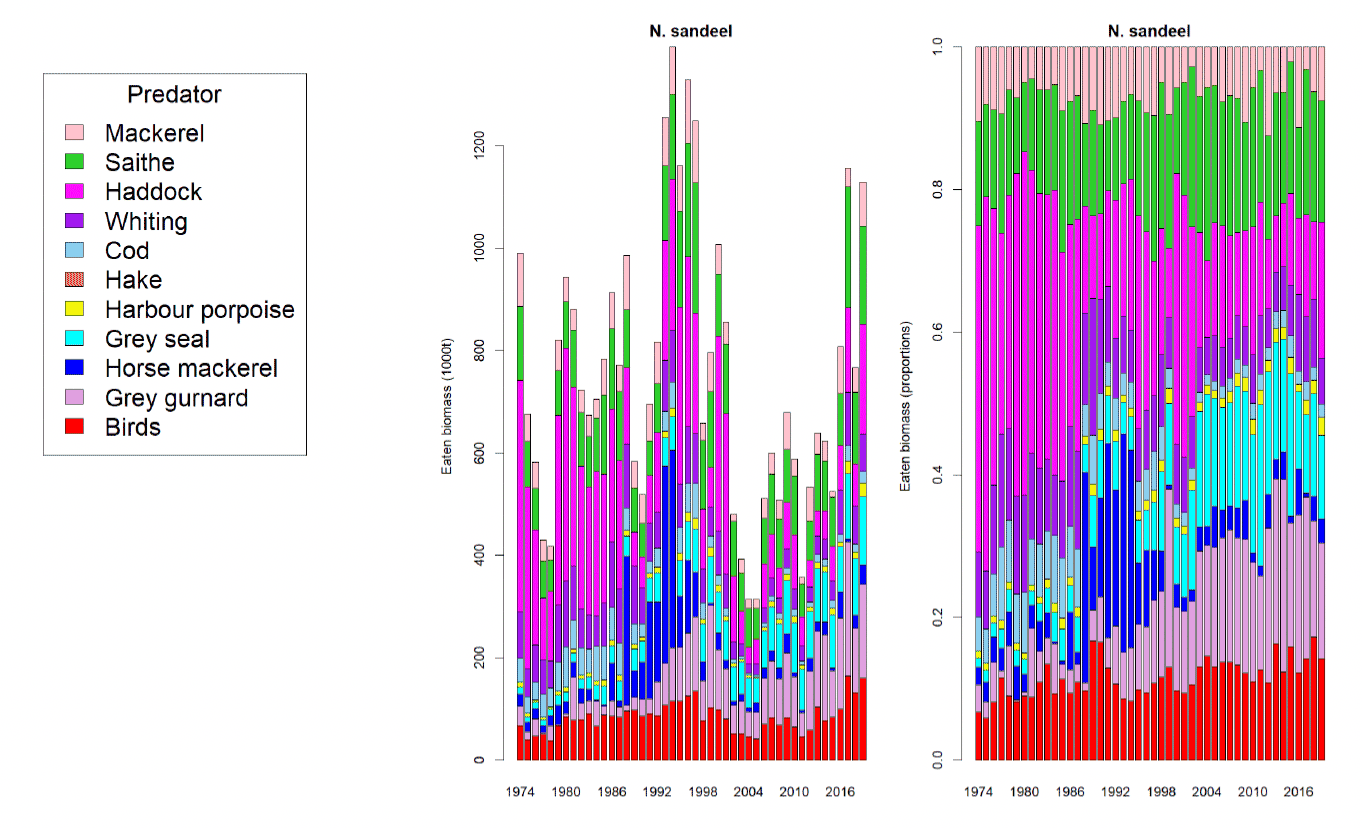
Predation mortality is relatively high for this stock and is considerably higher than fishing mortality in younger ages. Young sandeel are preyed upon particularly by haddock, saithe, and birds, as well as by grey gurnard in recent years. Older ages (>2 years) are preyed upon to a larger extent by grey seal as well as haddock and saithe. In Figure 18, the overall biomass of sandeel eaten by predators is illustrated. An increasing proportion of sandeel is taken by grey gurnard and grey seal. While predation by mackerel, saithe, and birds is assumed relatively constant over time, a decreasing proportion of the biomass is taken by cod and horse mackerel due to their decrease in abundance in the North Sea since the 1980s and 1990s respectively.
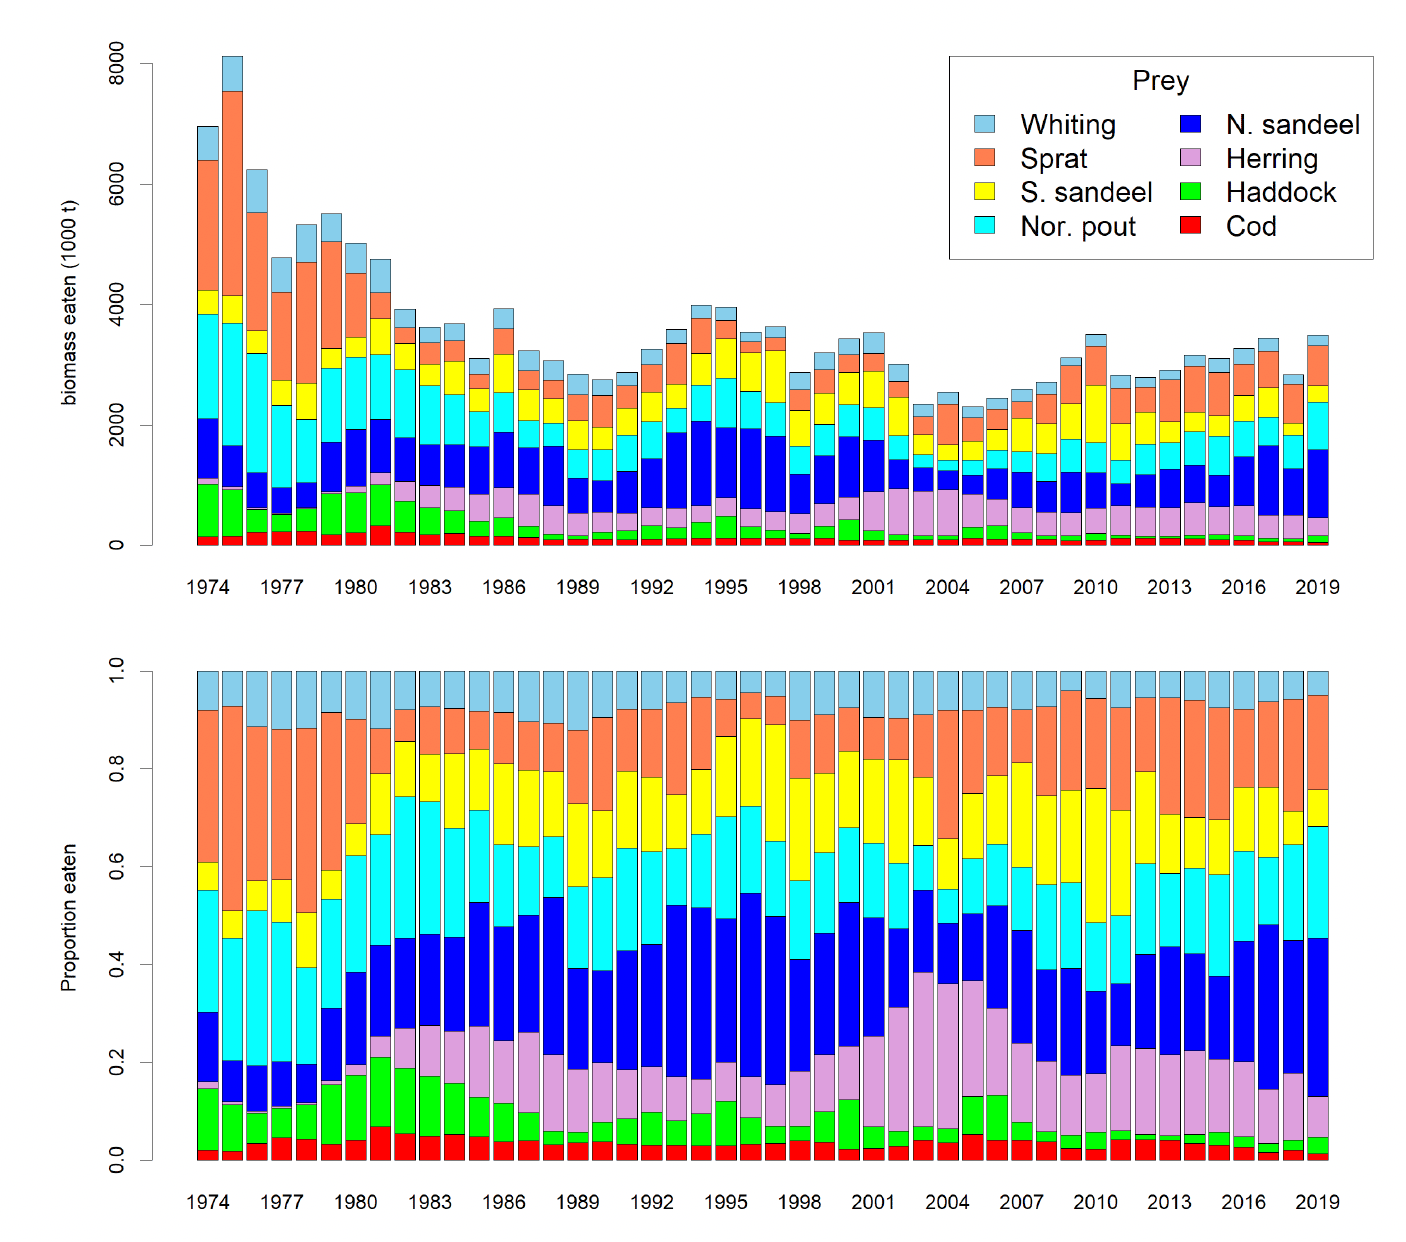
There were no simulations run to evaluate the impact on other fish species of lowering the fishing mortality of sandeel following a closure. From personal communication with WGSAM experts, it seems the impact for other stocks of lowering fishing mortality (F) of sandeel is likely to be small in the current set up of the SMS key run (ICES, 2021). Whilst predator species may show higher proportions of sandeel in their diets following an increase in sandeel biomass, it should be noted that the SMS key run does not include a feedback loop to directly infer predator abundances. Figure 19 shows the estimated annual amount of sandeel overall eaten by all predators as compared to other prey species. Northern and Southern sandeel taken together constitute a large proportion of predators' diets in the North Sea. The proportion of northern North Sea sandeel in the diet of predators increased in recent years following a recent increase in SSB of northern North Sea sandeel.
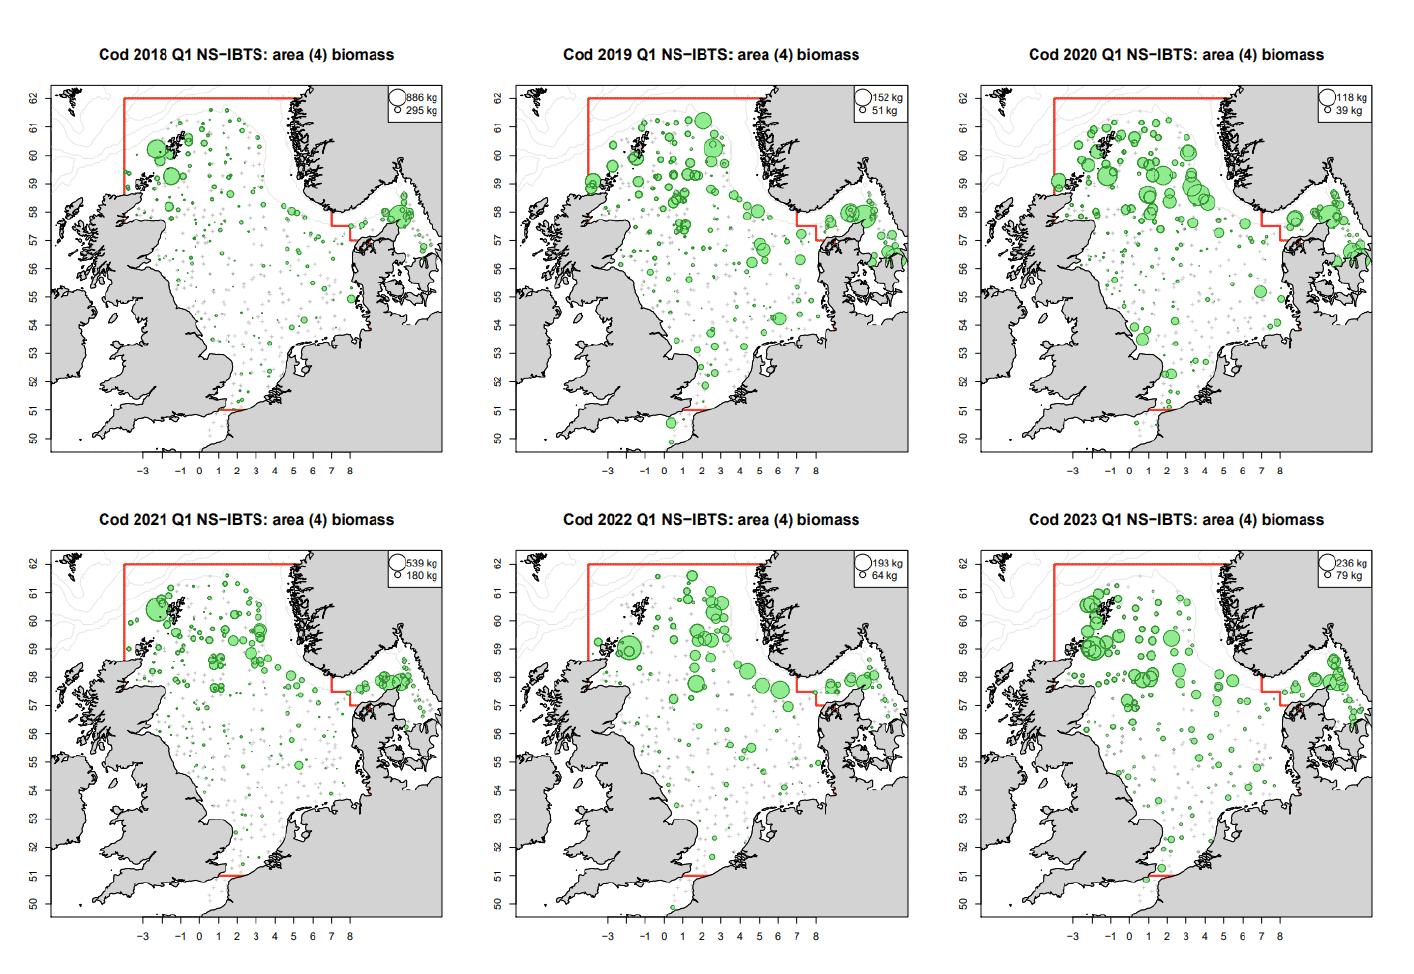
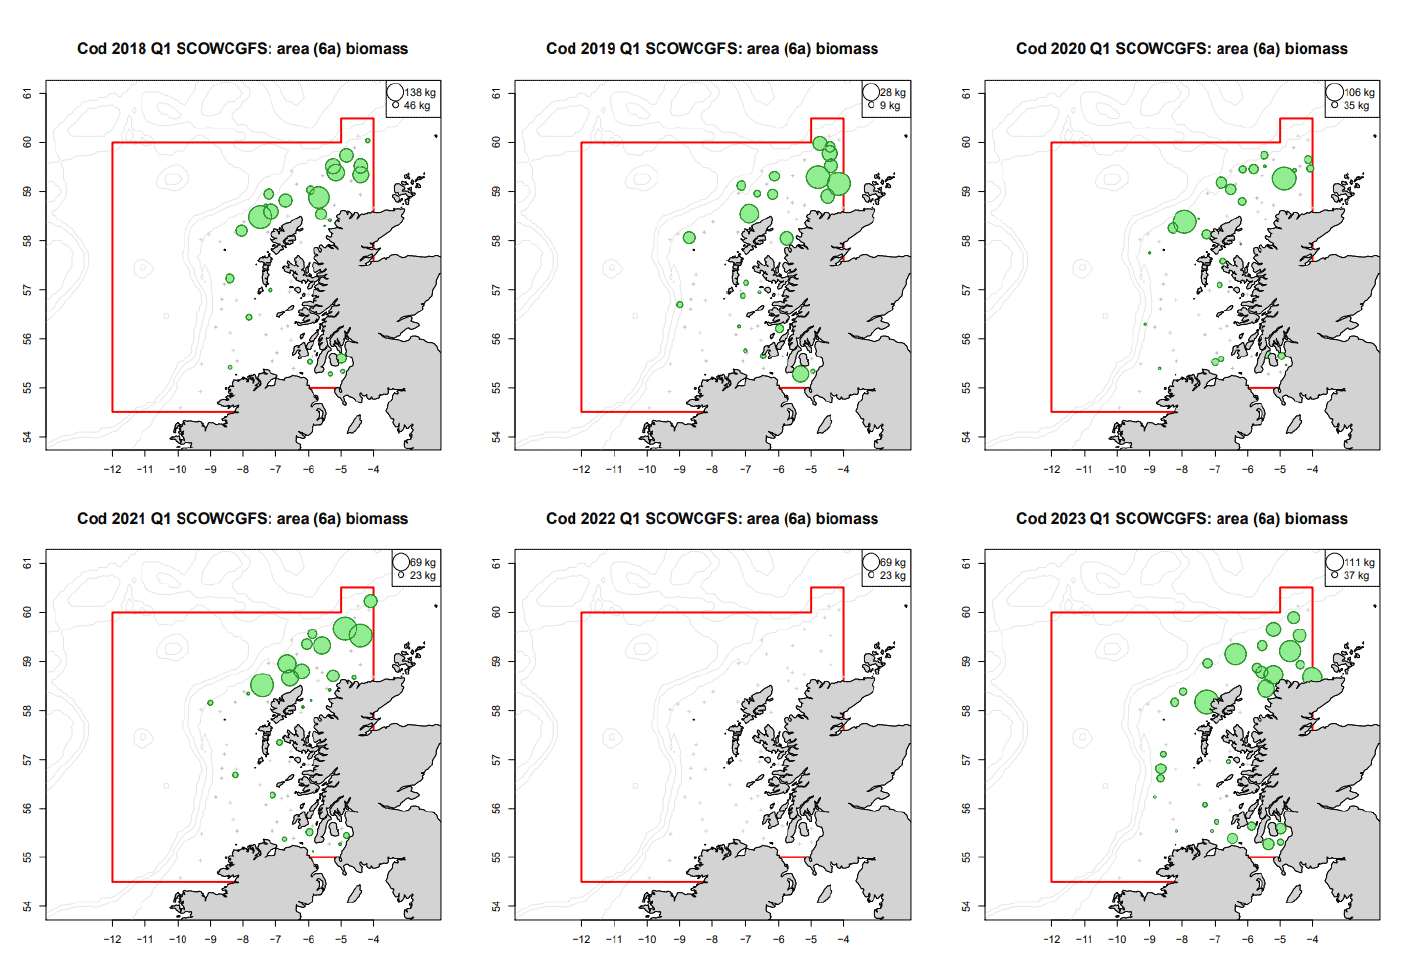
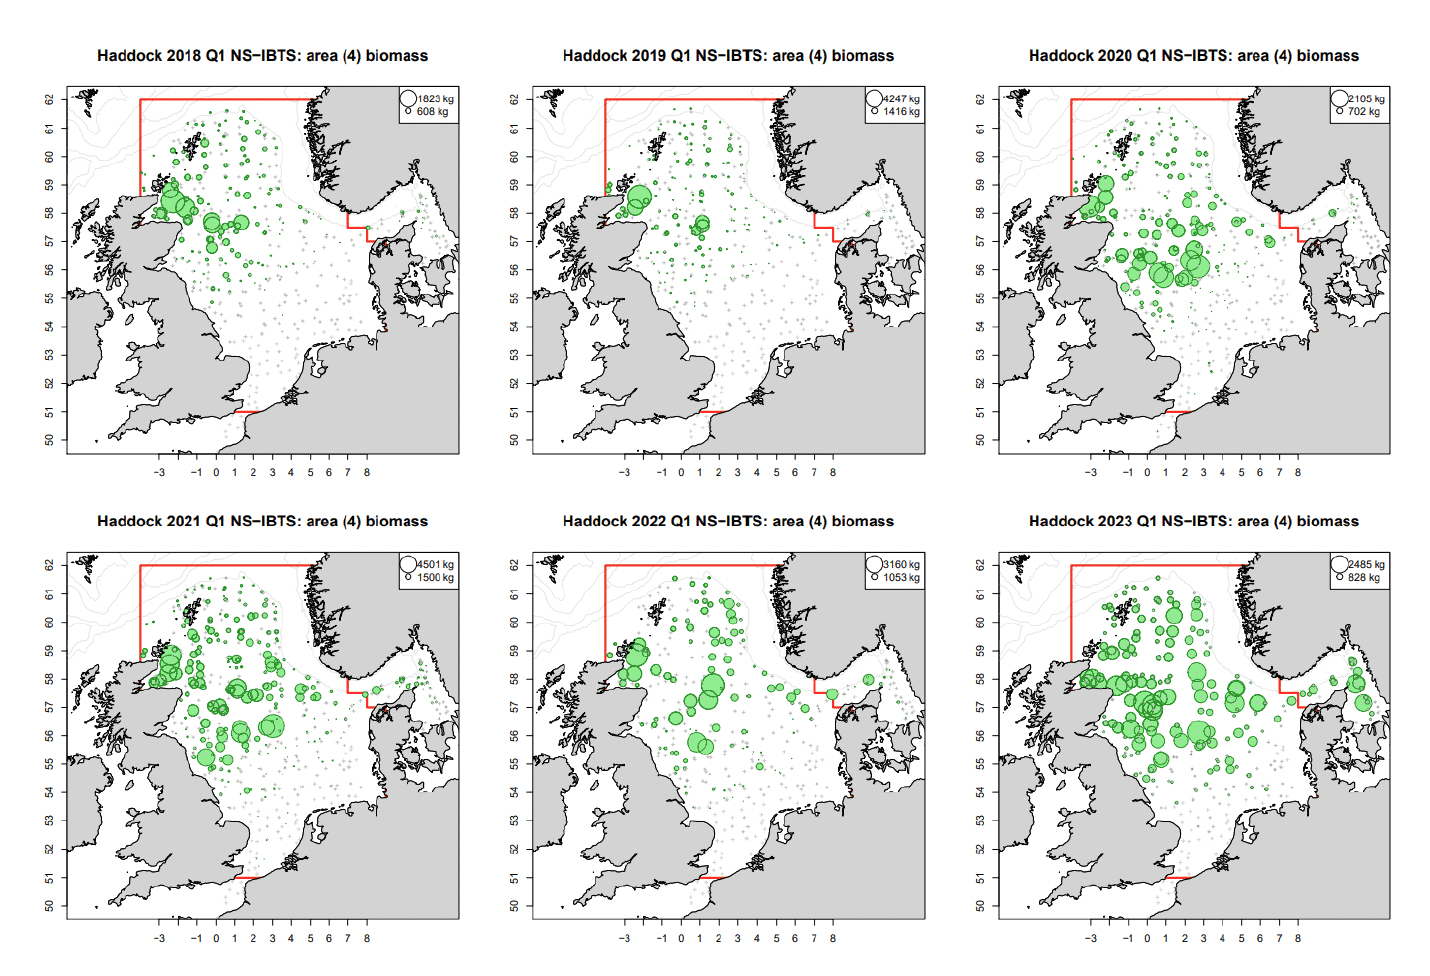
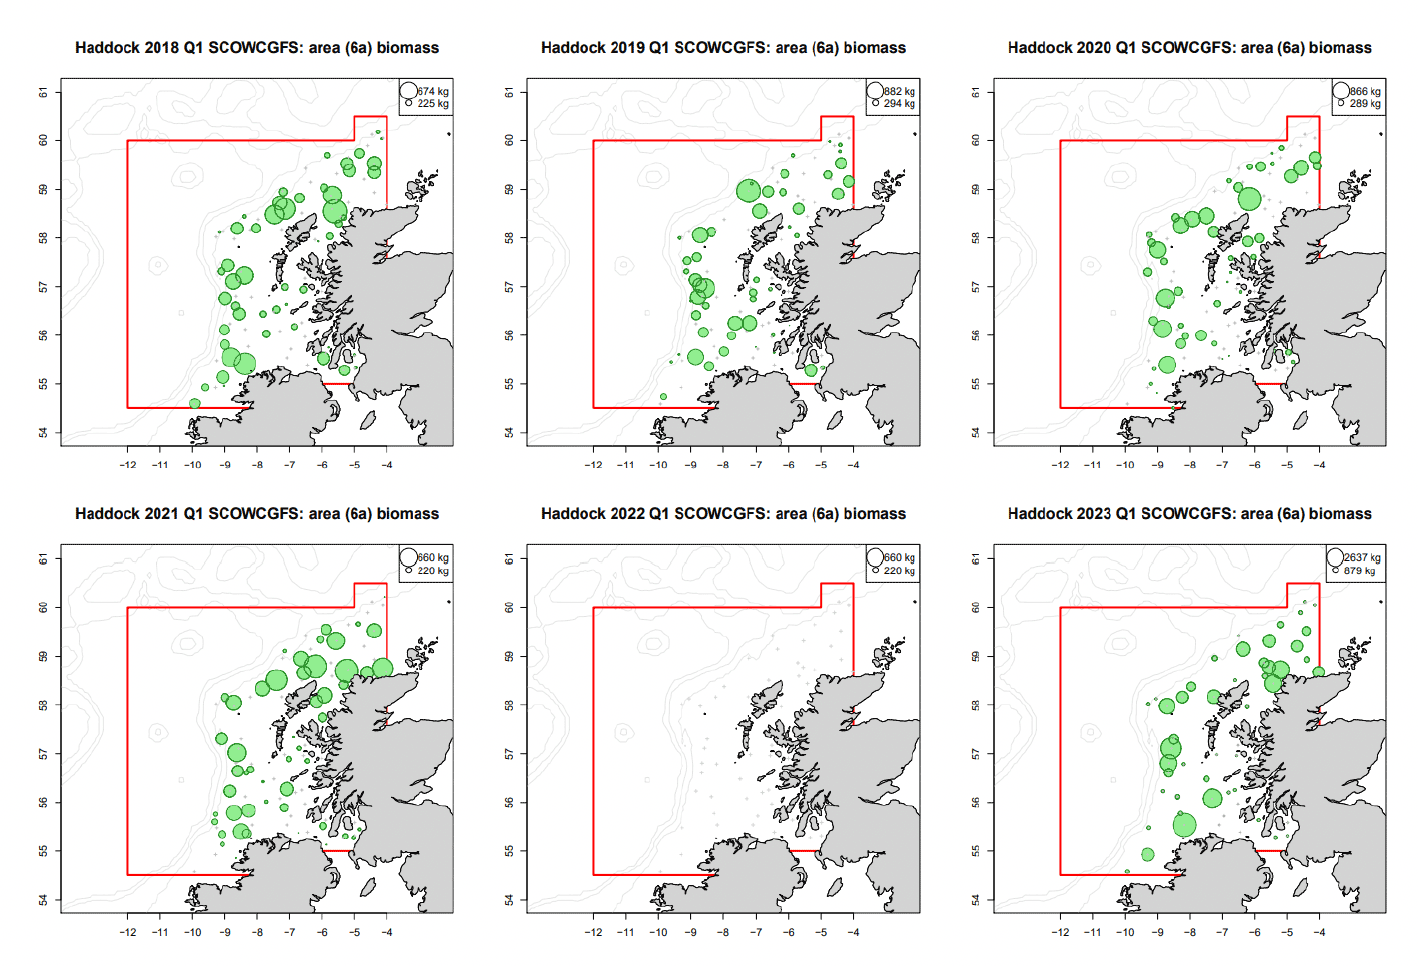
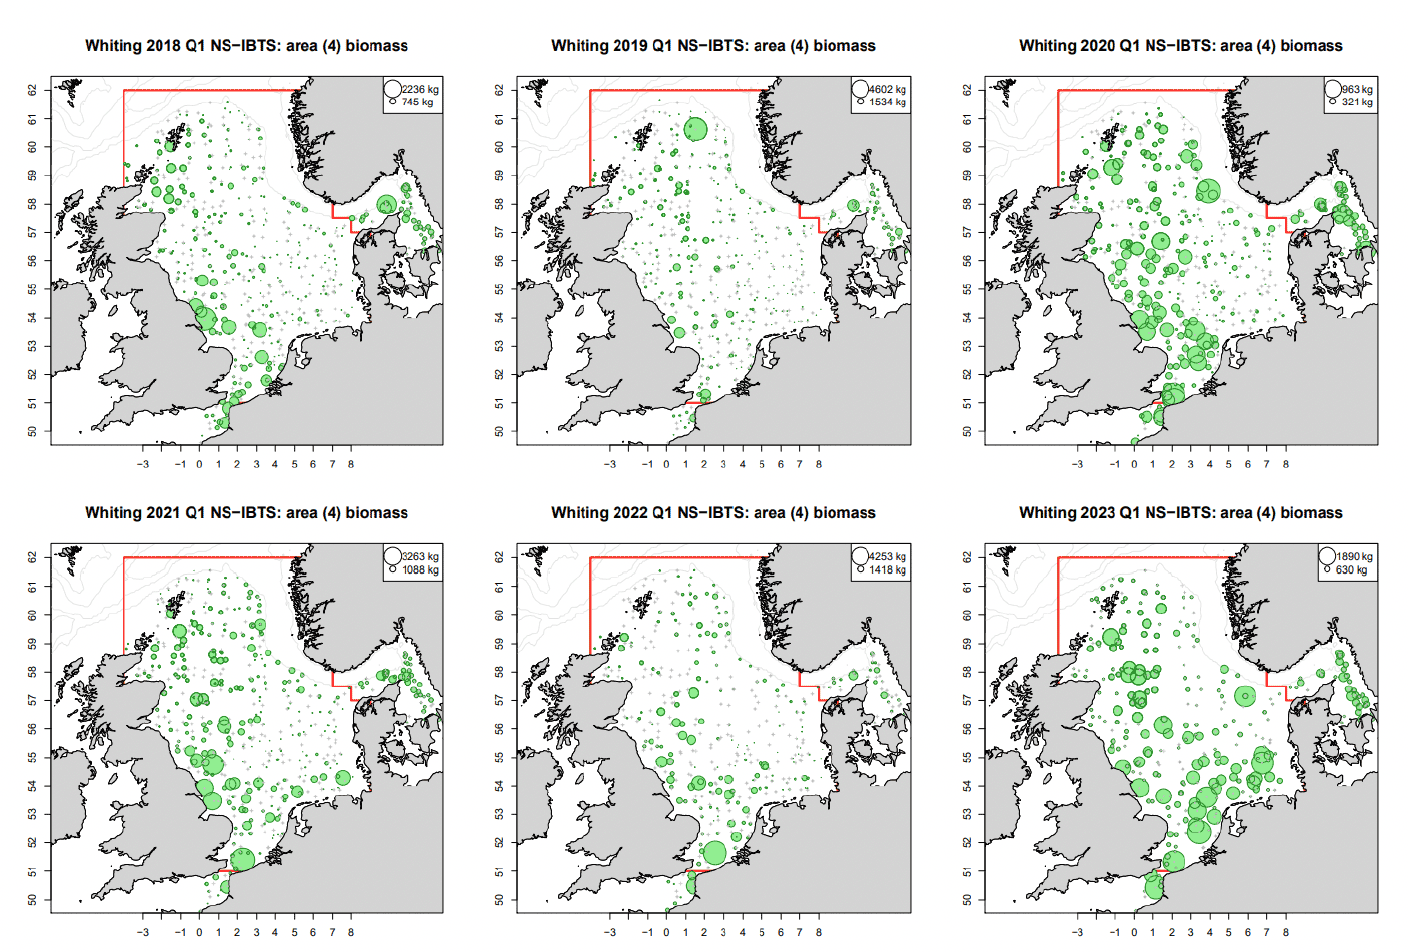
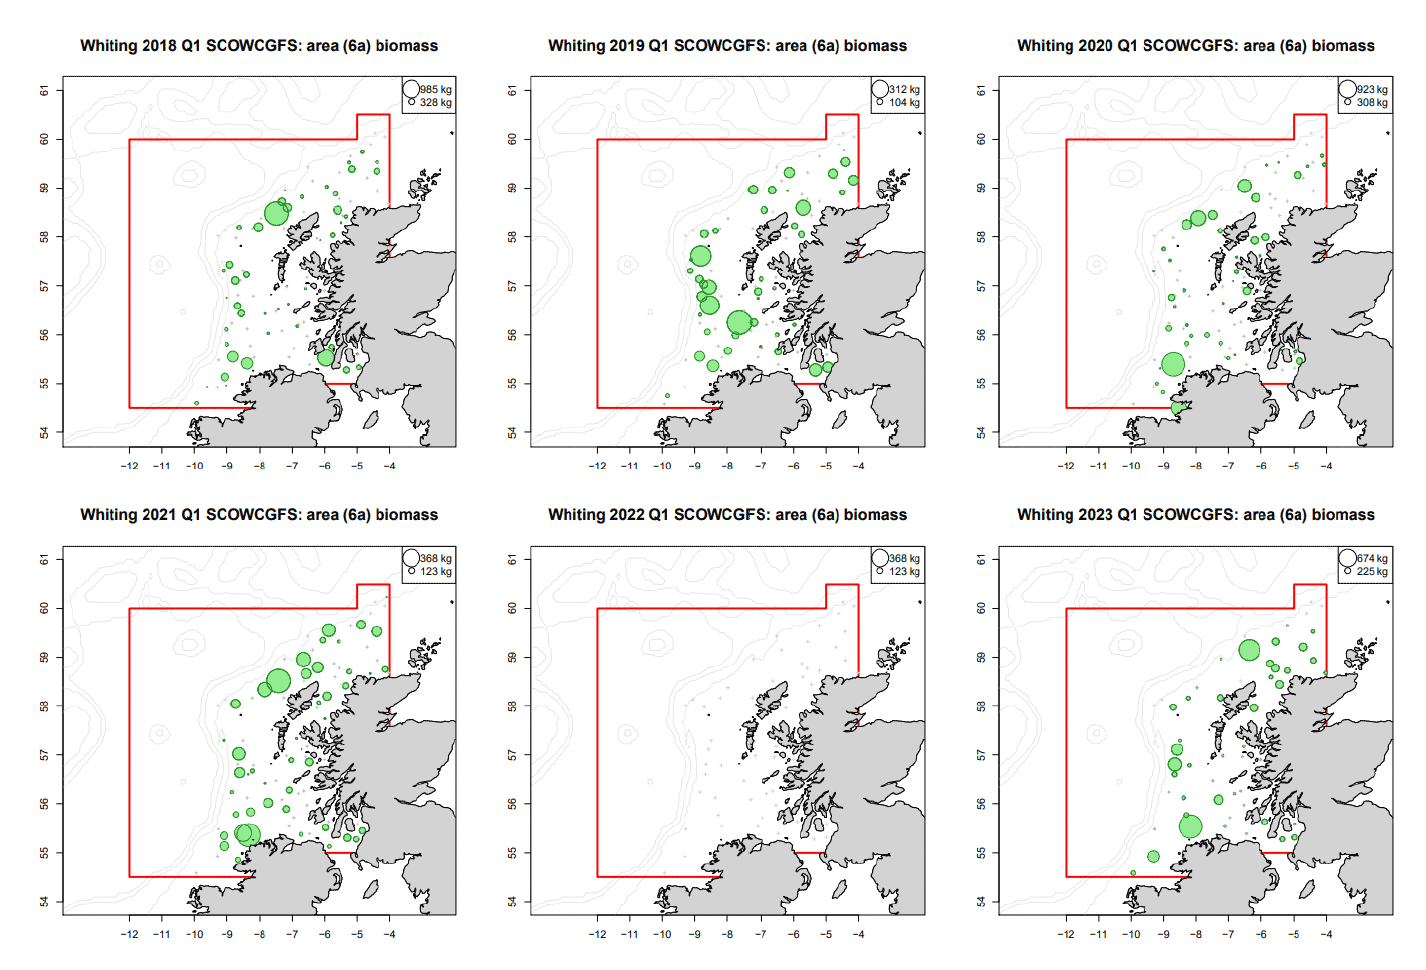
The amount of sandeel consumed by predators will also depend on predator stock abundance and spatial distribution. Northern shelf haddock and North Sea whiting have shown a strong recent increase in stock size (ICES, 2022b), which could lead to increase in predation on sandeel. Spatial distributions for cod, haddock and whiting are illustrated for quarter 1 surveys in Figure 20, 21, 22, 23, 24 and 25. On the other hand, NE Atlantic mackerel, Northern shelf saithe and grey gurnard have shown a decreasing trend in stock size (ICES 2022b,c).
3.1.1 Benefits of a sandeel closure on predatory fish
Predatory fish are often generalist feeders, where the diet typically consists of no more than 20% of any species, as predators switch between prey species based on availability (Engelhard et al. 2014, Trenkel et al. 2005). The importance of sandeel as a food source is more variable for predatory fish than for seabirds and mammals (Engelhard et al. 2014). Some fish species such as whiting, haddock, cod, plaice, lesser weever and grey gurnard have shown higher body condition indices or growth in years of high sandeel abundances (Engelhard et al., 2013; Rindorf et al., 2008). Body condition relates to growth, survival and reproduction and can thereby affect fitness and abundance of predators.
As previously noted, complex environmental interactions, including dynamics in predatory fish populations, competition for food sources, cannibalism and climate change may also affect the abundance of sandeel in the North Sea, making prediction of sandeel stock development following a fishery closure difficult (Arnott & Ruxton 2002, Eigaard et al. 2014, Engelhard et al 2014, Furness 2002, Furness 2003, Henriksen et al. 2021, Frederikson et al. 2007, van Deurs et al 2009).
3.2 Bycatch by sandeel fishery of other species
With the data currently available, it is not possible to comment definitively on the quantity of other fish caught in the fishery directed at sandeel after 2020. Estimates of "industrial bycatch" are included in ICES assessments for haddock and whiting in the North Sea, but these cover fisheries for sandeel, Norway pout and sprat, and it is not possible to distinguish bycatch from these fisheries at present. There is also an "industrial" component to the herring assessments in the North Sea and Skagerrak, but that represents fishing for small herring, rather than specifically sandeel fishery bycatch. So, while it is certainly the case that sandeel fisheries do include some bycatch of other fish, and for whiting in particular this may be considerable, it is not possible to quantify the bycatch component of the sandeel fishery due to a lack of detail in the ICES data collation. However, data are available for the 2017-2020 period to indicate the bycatch of other species in the international fishery directed at sandeel in UK waters. The average bycatch percentage by weight over these years was 0.05%.
3.3 Displacement of fisheries
One common response of a fishery to an area closure is displacement, in which the vessels concerned move to a different area to fish (spatial displacement) or change their fishing gear and methods to focus on different species (species switching). The fishery distribution plots in Figure 11 show that there remains significant sandeel fishing activity in Scottish waters. The current ICES advice for sandeel indicates that the assessment model doesn't take account of the current Scottish closure, meaning that the available TAC must be taken from a smaller area than intended. This situation would be exacerbated if the closure was extended. However, without a robust model of fleet dynamics (which does not yet exist for these fisheries) or an extensive consultation with the international fishing industry, it is impossible to determine what the response of the fleet would be to an area fisheries closure in Scottish waters.
3.4 Summary of Evidence on Fisheries and Sandeel
The evidence of the effect of a fishery closure on sandeel and related predatory species is currently unclear. As sandeel stock dynamics are driven more by environment and ecosystem effects, rather than by fishing, it is similarly difficult to predict the effect on the sandeel stock of a reduction in fishing mortality. There has been an overall decrease in predation mortality on sandeel from 2005 until 2020. However, a reduction of fishing mortality could promote resilience in local sandeel populations by providing a buffer against an increase in predation mortality as predator stocks increase in abundance (for example recent positive stock trends for whiting and haddock). It is also not possible to comment on the quantity of other fish caught in the fishery directed at sandeel, with the data currently available. Finally, without a robust model of fleet dynamics (which does not yet exist for these fisheries) or an extensive consultation with the international fishing industry, it is impossible to determine what the response of the sandeel-directed fleet would be to an area fisheries closure in Scottish waters.
Contact
Email: sandeelconsultation@gov.scot
There is a problem
Thanks for your feedback