Non-methane volatile organic compound emissions from malt whisky maturation: final report
Review of the human health and environmental impacts of non-methane volatile organic compound emissions from malt whisky maturation facilities prepared for the Scottish Government by Aether.
4 Human health impacts
4.1 Direct inhalation of ethanol
Impacts of some individual species of NMVOC such as benzene (PHE, 2019) and formaldehyde (PHE, 2017) have been identified previously at concentrations close to typical ambient levels for public exposure. However, less research has been conducted into the harm from human exposure to typical ambient concentrations of ethanol or other likely evaporative emissions from the storage of whisky. The majority of studies performed on the impacts of ethanol do not concern the inhalation of ethanol but rather the consumption of it. It should be possible to estimate the quantity of alcohol inhaled annually by people living close to the bonded warehouses if ambient concentration data were available. Unfortunately, monitoring of ambient concentrations of ethanol does not occur. The International Agency for Research on Cancer (IARC, undated) states, however, that:
"There is no safe level of alcohol consumption for cancer risk, and all types of alcoholic beverages, including beer, wine, and spirits, are linked to cancer risk, regardless of their quality and price. The risk of developing cancer increases substantially when more alcohol is consumed."
The NHS (2022) provides information for the public on the impacts of different levels of alcohol consumption. The following points are pertinent here:
- If you drink less than 14 units a week, this is considered low-risk drinking. It's called ‘low risk’ rather than ‘safe’ because there's no safe drinking level.
- The type of illnesses you can develop after 10 to 20 years of regularly drinking more than 14 units a week include: mouth cancer, throat cancer and breast cancer, stroke, heart disease, liver disease, brain damage, damage to the nervous system. Additionally, multiple studies conclude that alcohol consumption can make your mental health worse with strong links between alcohol misuse and self-harming, including suicide.
- The effects of alcohol on your health will depend on how much you drink. The less you drink, the lower the health risks.
That there is no safe drinking level indicates that any exposure has potential for harm, even amongst those that do not drink at all.
When alcohol vapour is inhaled, it is thought to bypass initial metabolism and instead be rapidly transmitted to the brain via the arterial blood (MacLean et al., 2017). A literature review of the impacts of inhalation found that results were inconclusive due to a lack of studies in this area (MacLean et al., 2017). It may be possible that inhalation of alcohol vapour increases the propensity for alcohol addiction to develop, as shown in trials on mice (McCool et al., 2015). It is unclear if a similar effect may be seen in humans, particularly in vulnerable populations who are already at an elevated risk of developing substance addictions.
Some studies have also examined the impacts associated with inhalation of alcohol vapours produced from the use of alcohol-based hand sanitisers (Mahmood et al., 2020; Han et al., 2022). The US Food and Drug Administration (FDA) warned that the vapours from alcohol-based hand sanitisers can cause symptoms such as headache, nausea and dizziness (FDA, 2022). However, it is worth noting that such products may not purely contain ethanol, but instead are likely to produce vapours that contain a variety of alcohols. Most commercially available hand sanitisers contain 70% ethanol and isopropanol (Bessonneau and Thomas, 2012). It is therefore unclear whether any conclusions drawn from these studies will also apply to inhalation of ambient ethanol from Scotch whisky production.
Public Health England list the possible side effects of acute exposure to ethanol vapours (PHE, 2015). These include irritation of the throat and difficulty breathing at 9,400,000 μg/m3, and lacrimation and coughing at 30,000,000 μg/m3. At higher concentrations, central nervous system depression may occur. Emergency response planning guideline (ERPG) values have also been provided in the US, which are designed to anticipate health effects to airborne chemical concentrations (AIHA, 2014). The maximum airborne concentration below which it is believed that nearly all individuals could be exposed for up to 1 hour without experiencing other mild transient adverse health effects is listed as 3,456,000 μg/m3. The concentration below which it is believed nearly all individuals could be exposed to for up to 1 hour without experiencing irreversible or serious health effects is 6,336,000 μg/m3. These are short term exposure limits, and therefore it is still unclear what the effects may be due to long term ambient exposure for those living in the vicinity of Scotch whisky facilities. Due to the typical accumulation of exposure effects, long-term exposure limits are generally set at significantly lower concentrations than short term limits. For ethanol, this may not be as relevant as for other pollutants, as ethanol does not accumulate in the body (OECD, 2004), and therefore the greatest risk is likely to be from short term exposure to high concentrations.
The American Conference of Governmental Industrial Hygienists (ACGIH) is cited by the Indiana State Department of Health (2019) as concluding that airborne ethanol has chronic non-cancer health effects at concentrations of 2,200 μg/m3 or higher. ACGIH (undated) refers to a higher level for effects (though possibly for cancer, specifically), giving a Threshold Limit Value – Short Term Exposure Limit (TLV-STEL) of 1,880 mg/m3 (1,000 ppm), citing ethanol as a confirmed animal carcinogen.
The above exposure risk concentrations are summarised below in Table 3.
| Study/Organisation | Ethanol concentration | Human health risk | Groups affected |
|---|---|---|---|
| PHE | 9,400,000 μg/m3 | Irritation of throat and difficulty breathing | All |
| PHE | 30,000,000 μg/m3 | Lacrimation and coughing | All |
| ERPG | 3,456,000 μg/m3 | Mild transient adverse health effects | All |
| ERPG | 6,336,000 μg/m3 | Irreversible or serious health effect | All |
| ACGIH | 2,200 μg/m3 | Chronic non-cancer health effects | All |
In the UK, the Health and Safety Executive (HSE) sets essentially the same workplace exposure limit of 1880 mg/m3 (1,880,000 μg/m3), though describes it as a long-term limit (8-hr reference period, versus 15 minutes for short term) (HSE, 2020).
Due to the lack of monitoring of ethanol concentrations, it is not possible to compare these exposure limits to the concentrations individuals may be exposed to. However, likely order-of-magnitude estimates for the ethanol concentration close to bonded warehouses were produced in Section 3.2. Concentrations 100 m from a Scotch whisky facility emitting the median or mean estimated emissions (200 μg/m3 and 800 μg/m3, respectively) do not exceed the thresholds stated above. However, the estimated concentrations from the largest emitting bonded warehouse (23,000 μg/m3) does exceed the exposure threshold provided by the ACGIH for chronic non-cancer health effects. Note, however, that occupational limits tend to be many times higher than those established for exposure of the public. For example, limits for members of the public set under clean air regulations are all significantly lower than workplace exposure limits to pollutants where both such limits exist. The ambient air regulations in the UK, or any other country so far as we are aware, do not address ethanol concentrations specifically.
Rumgay et al. (2021), in a study conducted at the International Agency for Research on Cancer (IARC), provide analysis of cancer risks related to increments in consumption of alcohol of 10 g/day from <10 g/day to >150 g/day as part of the Global Burden of Disease initiative[1]. This study attempted to quantify the impact and the scale of the problem of excess drinking in different parts of the world. However, deriving response functions is complicated, for example because of potential confounding factors such as the relationships between consumption with diet, tobacco use, exercise and social interaction. Rumgay et al. (2021) note that they did not consider the synergistic effect between alcohol and tobacco, or, in the case of liver cancers, alcohol and hepatitis. Regarding cognitive function, a meta-analysis by Brennan et al. (2020) reported that results were inconclusive, noting:
“major limitations in the design and reporting of included studies made it impossible to discern if the effects of ‘lower’ levels of alcohol intake are due to bias. Further review of the evidence is unlikely to resolve this issue without meta-analysis of individual patient data from cohort studies that address biases in the selection of participants and classification of alcohol consumption.”
Converting atmospheric concentration to an estimate of alcohol consumption, and adopting the position that there is no safe level of alcohol consumption, we could generate an estimate of increased cancer incidence following the approach used for the Global Burden of Disease initiative by Rumgay, et al. (2021). Their paper refers to the ‘Cancers Attributable to Alcohol Tool’[2] which may facilitate analysis. Quantification may be possible for some other effects such as stroke, but, bearing in mind the findings of Brennan et al. (2022), likely not all.
Quantification could either describe a change in risk (e.g. from X cases/100,000 people/year to Y cases/100,000 people/year), or the additional number of cancers if the affected population is known, though this number is likely to be very small indeed given the results of Rumgay et al. (2021).
Information on the website of the European Chemicals Agency (ECHA, 2022) states that ethanol: can cause damage to organs, is toxic if swallowed, may cause cancer, is toxic in contact with skin, is toxic if inhaled, causes serious eye damage, and causes skin irritation. However, this information is based on all exposure pathways, including ingestion. Inhalation, even in areas where ethanol concentrations are comparatively high, does not seem likely to be a major pathway.
The following assumptions have been used to quantify the amount of ethanol inhaled:
- Exposure assumes the concentrations at 100 m from a bonded warehouse as presented above in Section 3.2 (200 μg/m3 for a median facility, 800 μg/m3 for a mean facility and 23,000 μg/m3 for the largest facility in Scotland).
- It is assumed that 100 m is a reasonable distance for the modelling work. If the exposed population is closer the points of release then they will be more highly exposed, by a factor of 4, for example, if located around 50 m from the site of release. If the exposed population is further away than 100 m, they would naturally be less exposed.
- Breathing rate for a resting adult is taken as 11 m3 per day (Papathanasiou, 2017).
- A hypothetical case is taken of an elite male athlete who trains hard for 4 hours per day without moving from the area, during which inhalation increases to 240 litres per minute (Papathanasiou, 2017). In total (accounting also for periods when at rest) the athlete would inhale about 67 m3 per day, 6 times more than the resting individual. This is a worst-case example designed to assess a feasible (even if highly unlikely) upper bound for exposure.
- Individuals remain exposed to the same high levels of ethanol throughout the day.
- An average adult weighs 80 kg.
- All ethanol inhaled is absorbed into the blood stream.
- 1 unit of alcohol is equal to 10 ml, or 8 g (Department of Health 2008).
| Concentration, ug/m3 | 200 | 800 | 23,000 |
|---|---|---|---|
| Adult at rest | |||
| Grams inhaled/day | 0.0022 | 0.0088 | 0.25 |
| mg/kg body weight | 0.028 | 0.11 | 3.2 |
| Units of alcohol per day | 0.00028 | 0.0011 | 0.032 |
| Units/week | 0.0019 | 0.0077 | 0.22 |
| % of 14 units per week | 0.014% | 0.055% | 1.5% |
| Elite male athlete training hard for 4 hours per day | |||
| Grams inhaled/day | 0.013 | 0.053 | 1.5 |
| mg/kg body weight | 0.17 | 0.67 | 19 |
| Units of alcohol per day | 0.0017 | 0.0067 | 0.19 |
| Units/week | 0.012 | 0.047 | 1.34 |
| % of 14 units per week | 0.083% | 0.33% | 9.6% |
Gorgus et al. (2016) considered exposure to ethanol for children from food not labelled as containing alcohol. They report that:
“orange, apple and grape juice contain substantial amounts of ethanol (up to 0.77 g/L). Furthermore, certain packed bakery products such as burger rolls or sweet milk rolls contained more than 1.2 g ethanol/100 g. We designed a scenario for average ethanol exposure by a 6-year-old child… An average daily exposure of 10.3 mg ethanol/kg body weight (b.w.) was estimated. If a high (acute) consumption level was assumed for one of the “categories,” exposure rose to 12.5–23.3 mg/kg b.w..”
Against this background level of exposure from food intake, the estimates above for the median and mean sized warehouses (<1 mg/kg b.w.) appear insignificant. The estimates around the largest plant are of a similar order of magnitude (accepting that our calculations are made for adults, though of course normalised against body weight).
Gürler et al. (2022) note that:
“Most foods produce higher methanol concentrations than the maximum allowable dose level (23 mg). Especially fruit juices lead to the critical level of ethanol for children (6 mg/kg body weight). Based on the results, adult daily intake of selected food groups does not bear ethanol that exceeds the legal limit of BAC [blood alcohol content] or the limit not allowed from a religious perspective and does not lead to acute alcohol toxicity. But these low levels of ethanol and methanol consumed via non-alcoholic foods for life can raise the vulnerability to chronic health problems (cancer, liver cirrhosis, Alzheimer’s disease, autism, ocular toxicity and alterations in foetal development) and may lead to positive ethanol metabolite results (e.g., ethyl glucuronide) when a low cut-off level is used.”
Gürler et al. (2022) thus raises two further issues that may need further investigation:
- The science behind the ‘critical level of ethanol for children’ of 6 mg/kg b.w.;
- Links between low levels of alcohol exposure and chronic disease.
NHS guidance (2022) is not to drink more than 14 units of alcohol per week. Intake via inhalation is estimated to be less than 1% of this for the cases where exposure is to concentrations of 800 μg/m3 or less. However, in the highest concentration zone, inhalation accounts for 2% and 10% of the weekly maximum for the resting adult and elite male athlete, respectively.
Exposure to emissions of ethanol from whisky production appears in most situations likely to lead to only a small increase in exposure to ethanol. No evidence has been identified to indicate that this could cause acute effects on the population. However, the analysis presented here should be seen in the context of:
1. Exposure to these emissions is additive to other exposures. Even amongst those who do not consumer alcohol deliberately there is exposure from food and drink such as bread and orange juice.
2. There are indications that low level exposure increases vulnerability to a range of chronic diseases.
3. Exposure of the public to emissions from whisky production is not voluntary.
4. Exposure would affect all age groups.
There are limited studies on the direct inhalation of ethanol particularly beyond the fenceline of maturation and production facilities, however given there is no safe drinking level of alcohol then an element of risk remains. While it is likely that the impact on human health beyond the fenceline of Scotch whisky production facilities as a result of direct inhalation of ethanol is likely to be minor, monitoring of the actual ethanol concentrations close to the larger bonded warehouses is recommended.
4.2 Baudoinia compniacensis
Baudoinia compniacensis is a sac fungus which thrives in habitats with a high concentration of airborne ethanol, such as outside or near distilleries, bonded warehouses or commercial bakeries. In appearance, the fungus forms black crusts on the façades of buildings where conditions are favourable and it uses ethanol for carbon nutrition as a source of calories. Baudoinia compniacensis is also known for its ability to withstand high temperatures with warm environments even increasing spore germination. As a result, the fungus is able to form colonies on the outside of buildings involved in whisky production as well as in the vicinity of those buildings if ethanol concentrations are high enough to sustain this.
A review of literature relating to the ethanol concentrations to sustain the growth of Baudoinia compniacensis has produced inconclusive results. A 2021 study determined that typical atmospheric ethanol concentrations of 5,000 to 10,000 μg/m3 optimised growth (Craig et al., 2023), however there are some indications that higher concentrations of approximately 15% may begin to restrict growth (Ewaze et al., 2008). Therefore, if fungal growth is visible on neighbouring properties it is likely that the ethanol concentrations at these locations is within the 5,000 to 10,000 μg/m3 range. Numerous climatic factors also have an impact on the growth of the fungus. The conditions in Scotland, especially in the west of the country, create ideal conditions for fungal growth. This is due to the combination of cool summers, mild winters and frequent rainfall (Craig et al., 2023).
There are three possible routes for exposure for the public:
- Touching Baudoinia compniacensis on the outside of buildings.
- Inhaling spores or other allergens produced by the fungus on the outside of buildings.
- Exposure to the fungus inside houses or other buildings around the bonded warehouses. This would require concentrations of ethanol inside the buildings concerned to be high enough to stimulate fungal growth, and other environmental conditions (damp) to provide a suitable habitat for the fungus. This route seems unlikely given information on the ecology of the species (Scott, 2016).
Research conducted by the Indiana State Department of Health Environmental Public Health Division did not find any reports of health risks from short or long-term exposure to Baudoinia compniacensis (Indiana State Department of Health, 2019).
Further investigation into the ethanol concentrations with which Baudoinia compniacensis grows is recommended. Ethanol concentrations close to Scotch whisky facilities will be greater either close to the larger facilities that emit the greatest quantities of ethanol, or in locations where air flow is reduced, for example in urban areas. In such areas, Baudoinia compniacensis growth is anticipated to be the most extensive. In addition, a watching brief should be maintained for any future studies that demonstrate if there are any human health impacts of Baudoinia compniacensis .
4.3 Ozone formation
Photochemical reactions between NMVOCs (including ethanol) and NOx can form ground-level ozone. Therefore, NOx concentrations must also be considered when trying to understand the extent of ozone formation from NMVOCs. The reaction pathways between NOx and NMVOCs to produce ozone are complex, but in general ozone formation will be limited by whichever pollutant appears in the lowest concentrations in the atmosphere.
From an air quality legislation perspective, interest in NMVOCs has mainly focused on their contribution to ozone formation. Health impacts of ozone have been extensively reviewed by the UK Committee on the Medical Effects of Air Pollutants (COMEAP)[3] which is sponsored by Department of Health and Social Care but has a remit to advise government departments generally.
Ethanol has an intermediate photochemical ozone potential (POCP) of 46 g/mole (Altenstedt & Pleijel, 1998), a measure of an NMVOC’s propensity to form ozone. This means that there are many NMVOCs that more readily form ozone than ethanol, but also many with a lower ability to form ozone.
Defra has also produced a damage cost tool (Birchby et al., 2019) that provides an estimate of cost per tonne of VOC emitted. The current estimate is £172/tonne of VOC (Defra, 2023) covering the following effects of exposure to ozone linked to VOC releases:
- Mortality
- Respiratory hospital admissions
- Cardiovascular hospital admissions
- Productivity
- Damage to materials (rubber goods)
- Damage to ecosystems (crops, forests, etc.)
- Damage to livestock production
The damage cost per tonne has been revised up to £172 in the latest update published in early 2023 from the previous value of £115/tonne of VOC. This revision is related to updating ecosystem valuations for ozone impacts on livestock production.
Toxicology studies reviewed by the US EPA (2013) report also on effects on the central nervous system including alterations in neurotransmitters, motor activity, short and long-term memory, sleep patterns, and histological signs of neurodegeneration.
Defra’s modelling to quantify damage costs of pollutant releases covers the emissions themselves and their subsequent air transportation and chemistry, alongside the likely exposure and its impacts and resulting costs. It is convenient to use damage costs as an indicator for the likely significance of the impacts associated with the release of NMVOCs, rather than developing original modelling of the emission impacts. The use of the damage costs leads to some additional uncertainty in assessment but avoids the need to develop emission scenarios and run complex pollutant chemistry/dispersion models, which generate their own uncertainties. Modelling of this type would need to account for emissions of VOCs and NOx from all sources, including transboundary inputs at a European scale. This could be carried out in the UK, for example by the UK Centre for Ecology and Hydrology using the EMEP4UK model but would require significant additional input, beyond the scope of the present work.
The current estimate of £172/tonne (2022 price) represents an average across all VOC emissions, with each VOC species having a variable potency for generating ozone, i.e. the species’ photochemical ozone creation potential (POCP). Further analysis could be undertaken to weight the £172/tonne estimate specifically to ethanol, drawing on information regarding the POCP and emission figures for VOCs more widely. Applying this damage cost to the emissions quantified above gives the following results.
| 2018 | 2019 | 2020 | |
|---|---|---|---|
| Emissions (t) | 74,931 | 77,307 | 79,744 |
| Damage cost (£M) | 13 | 13 | 14 |
Premature deaths in the UK attributable to exposure to ozone were estimated to be 880 in 2019 (EEA, 2021b). The same study calculated the estimated years of life lost for the same year, which was 15 years of life per 100,000 inhabitants. The study covered most European countries, and it ranked the UK as having the third lowest relative impacts on health from ozone exposure in Europe. The two countries with the lowest relative impacts on health were Iceland and Ireland, reflecting both their northerly latitudes and prevailing wind directions that lead to reduce transboundary input compared to other European countries. Ozone production at low altitudes requires sunlight, and countries with the greatest relative health impacts were all in the Mediterranean region. Ground-level ozone concentrations are seasonal and highly episodic, with concentrations varying significantly month to month and year to year. The latest version of this work (EEA, 2022) does not contain information on the UK and instead only considers EU-27 countries.
Through the WHO, the Health Response to Air Pollutants in Europe (HRAPIE) study produced recommendations for changes to the concentration-response functions for the cost-benefit analysis of pollutants, including ozone (WHO Regional Office for Europe, 2013). The study estimated relative risks of exposure, defined as the comparison between the risk of a health event when pollutant exposure is occurring and the risk of a health event where pollutant exposure is not occurring. A relative risk of greater than one therefore indicates that pollutant exposure is increasing the likelihood of a health event. The relative risk of mortality for all natural causes and for all ages posed by short-term exposure to ozone was 1.0029 for a daily maximum 8-hour mean concentration of more than 70 μg/m3, at STP EU[4]. In that study, this finding applied to all age groups. There was also evidence that this relative risk also applied to concentrations above a lower value of 10 ppb. For exposure to a concentration of more than 70 μg/m3, at STP EU, as a daily maximum 8-hour mean, the relative risk of hospital admission due to cardiovascular disease was 1.0089 and admission due to respiratory diseases was 1.0044 for the age group of more than 65 years. Again, there was also evidence that these relative risk ratios also applied to concentrations of more than 20 μg/m3, at STP EU.
In 2015, the US EPA lowered the National Ambient Air Quality Standards (NAAQS) for ozone from 75 ppb (147.8 μg/m3 at STP US[5]) to 70 ppb (137.9 μg/m3 at STP US), based on the annual fourth-highest daily maximum 8-hour concentration averaged over 3 years. As part of the study that informed this decision, a causal relationship was determined between respiratory effects and short-term exposure to ozone (US EPA, 2013). In addition, the study concluded that there is likely to be a causal relationship between cardiovascular effects and short-term exposure, and that there is evidence suggestive of a causal relationship between short-term exposure and central nervous system effects. The reasons for reducing the NAAQS included evidence of decreases in pulmonary function to exposures of 120-140 μg/m3 at STP US in young, healthy adults, and evidence of increased blood coagulation at concentrations of more than 140 μg/m3 at STP US.
| Target | Area applied to | Concentration (μg/m3) | Measured as |
|---|---|---|---|
| New National Ambient Air Quality Standards (NAAQS), as of 2015 | US | 137.9 | The annual fourth-highest daily maximum 8-hour concentration averaged over 3 years |
| Previous NAAQS | US | 147.8 | The annual fourth-highest daily maximum 8-hour concentration averaged over 3 years |
| Air Quality Strategic Objective (AQSO) | UK | 100 | Target set as fewer than 10 exceedances in a year of a mean concentration greater than the target within an 8-hour period |
| World Health Organisation | Global | 100 | The mean concentration within an 8-hour period |
4.3.1 Scottish monitoring network data
Alongside the ozone monitoring network, monitoring relating to nitrogen dioxide (NO2) concentrations can also be considered to gain an understanding of the drivers for the formation of ozone in Scotland. There is some monitoring of NMVOCs, but not those related to the whisky industry. Any monitoring of ethanol concentrations associated with Scotch whisky production that takes place will be informal, and likely only monitoring concentrations within the warehouse for compliance with health and safety standards for the exposure of workers.
NO2 concentrations are monitored extensively throughout Scotland at over 1000 sites. The majority of these monitoring sites are passive monitoring with diffusion tubes which are cheap and easy to analyse, though have a higher uncertainty than the main pollution monitoring stations. As a result, a bias adjustment factor is frequently applied, derived from the discrepancy in measured concentrations measured by co-located diffusion tubes and an automatic monitor. Both automatic and passive monitors are operated by the local authority, and details of their locations and the measured concentrations at each monitoring site can be obtained from the air quality annual progress reports produced by each local authority.
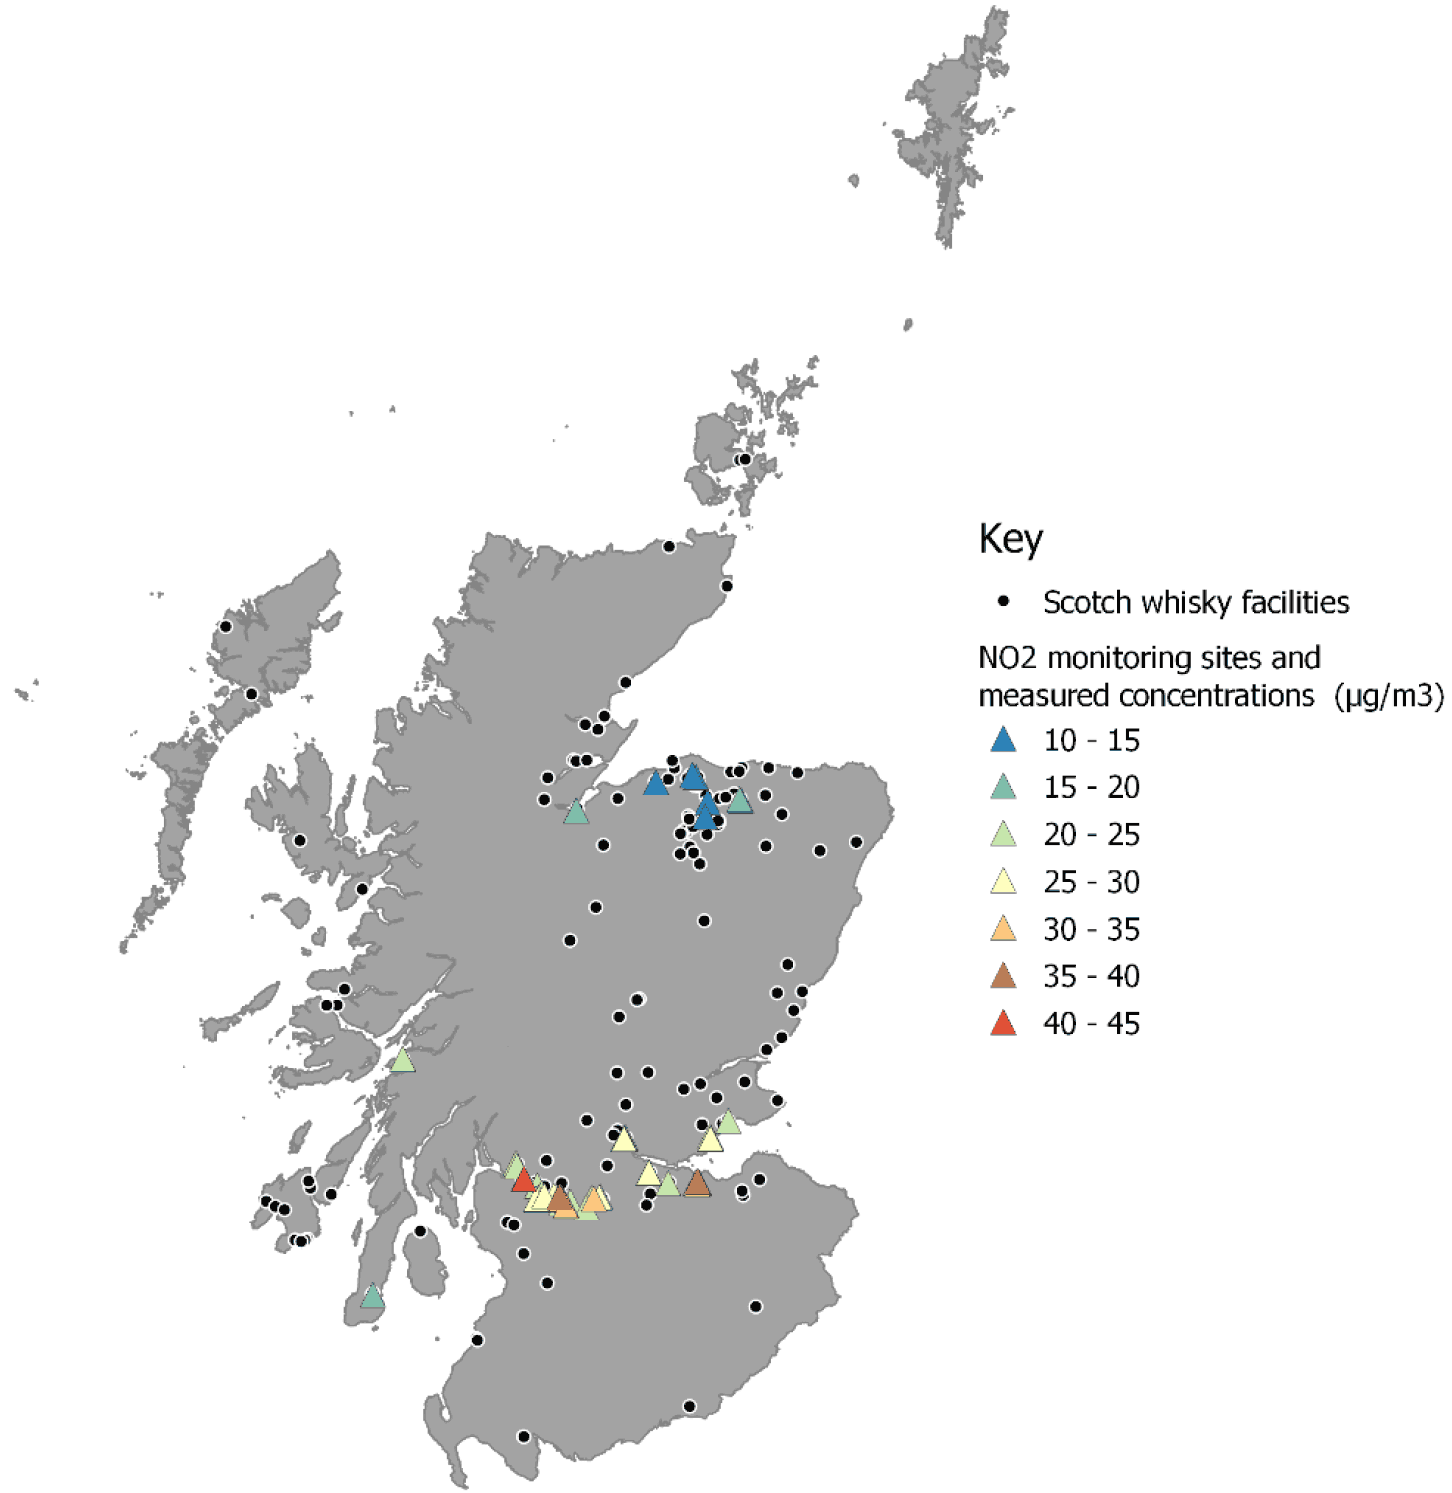
Due to the extensive usage of diffusion tubes by local authorities, the likely NO2 concentrations close to facilities where Scotch whisky maturation takes place can be estimated. For example, one of the facilities emitting the largest amount of NMVOC in Leven is located approximately 400 m from a diffusion tube on the side of a nearby A road. There, the concentrations measured in 2019 were 23 μg/m3 but due to the fall-off in NO2 concentrations with distance from a source, the concentrations at the facility are likely to be much lower than this. Figure 8 shows all NO2 monitoring sites in Scotland within 1 km of a Scotch whisky facility and the concentrations measured at these sites in 2019. Though the latest data available corresponds to 2021, the year 2019 was chosen as it represents a year unaffected by traffic reductions due to restrictions imposed as a result of the COVID-19 pandemic. In 2019, only one of these monitoring sites recorded annual mean concentrations greater than 40 μg/m3. This site is located just over 100 m from one of the bonded warehouses at the Dumbuck Maturation Site facility, which emitted 1,830 tonnes of NMVOCs in 2019.
The trend of reducing NOx emissions from road transport has resulted in ozone production now being mostly NOx limited in the UK (AQEG, 2021). As a result, increases in NOx concentrations will have a greater impact on ozone concentrations than increases in NMVOC concentrations. NOx emissions from road transport are anticipated to decline further in future years, which is likely to further limit the production of ozone.
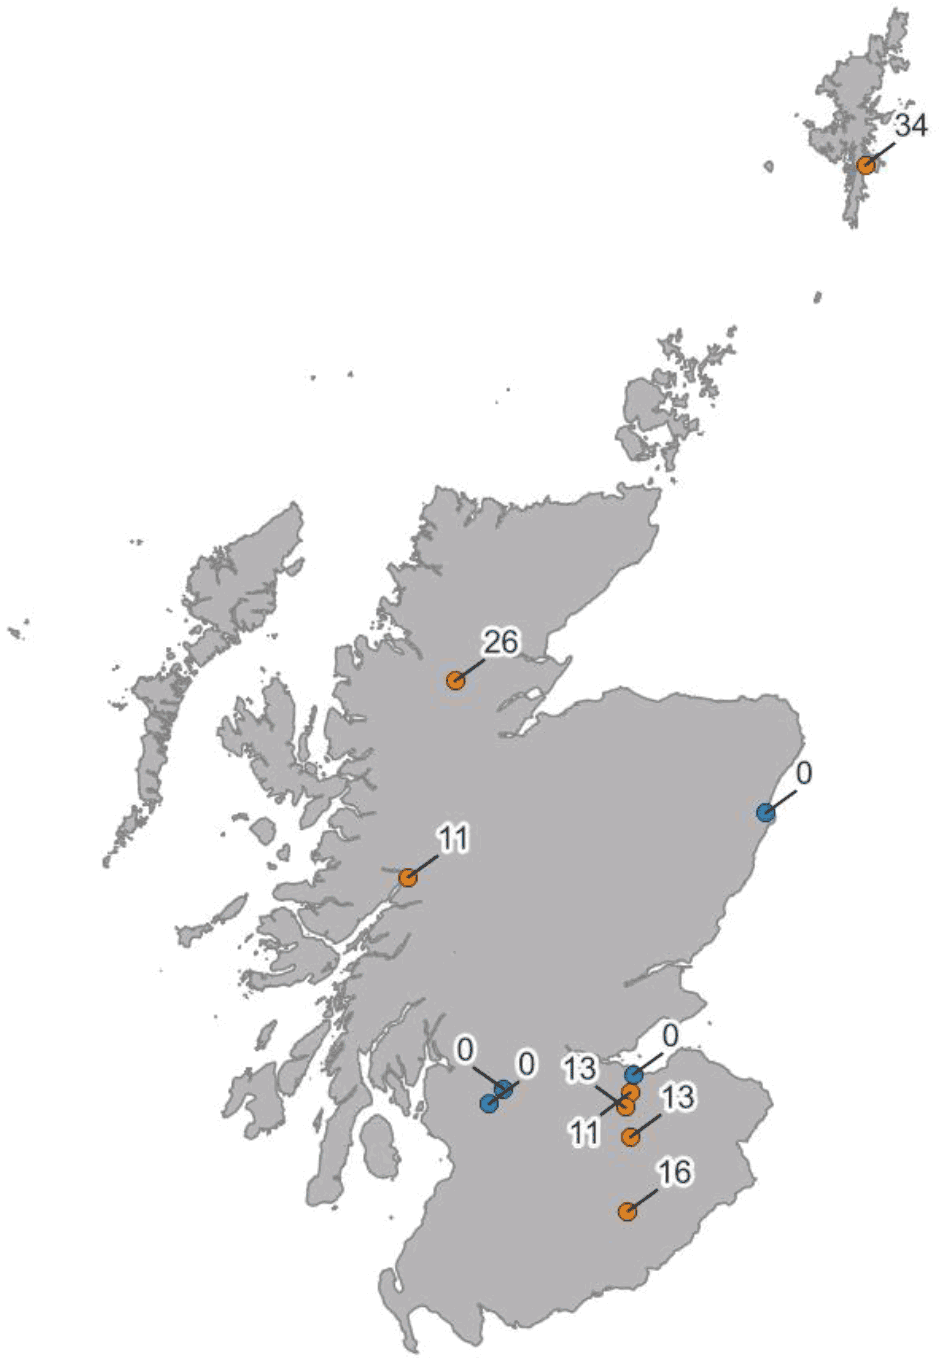
Across Scotland, there are 11 air quality monitoring sites which measure exceedances of the Air Quality Strategy Objective (AQSO) for ozone. These monitoring sites are shown in Figure 9 below with the latest year of monitoring data available. The AQSO is set by the Air Quality Standards Regulations 2010 and applies to the whole of the UK. For ozone, the AQSO is considered to be exceeded if there are 10 or more exceedances in a year of a mean concentration of 100 μg/m3 within an 8-hour period. This is similar to the World Health Organisation (WHO) Air Quality Guideline (AQG) for short term ozone exposure which is set at a concentration of 100 μg/m3 within an 8-hour period (WHO, 2021).
In 2018, almost all of the monitoring sites in Scotland recorded exceedances of the AQSO for ozone. This was even true for monitoring sites which rarely record even a single incident in other years where the mean concentration within an 8-hour period was more than 100 μg/m3. AQEG (2021) notes that 2018 was a year with meteorologically driven inter-annual variability in surface ozone concentrations and, as a result, ozone concentrations in 2018 were the highest recorded in the UK for multiple years (AQEG, 2021). This suggests that exceedances of the ozone AQSO are driven by meteorological conditions rather than local emission sources.
In addition, there is variation in the ozone concentrations recorded at urban and rural locations. Ozone monitors in rural locations record a greater number of incidences of the mean concentration exceeding 100 μg/m3 within an 8-hour period than urban locations. Therefore, it can be concluded that ozone concentrations are generally higher in rural areas than within towns and cities. This is due to the complex nature of the interactions between ozone and nitrogen oxides. Ground-level ozone reacts with nitric acid (NO) to produce NO2 and oxygen, and therefore reducing the concentrations of ozone. NO is emitted from road transport and so NO concentrations are typically higher in urban areas. This means that NO is more readily available to react with ozone to produce other gases. Those living in rural areas are therefore at a greater risk of being exposed to elevated concentrations of ozone.
It is worth noting that emissions from the road transport sector are anticipated to continue to decrease. This is due to the continued efficiency improvements of engines and emissions control equipment, and a move to electric vehicles. In the future, it is expected that the availability of NO molecules to take part in reactions with ozone in urban areas will therefore decrease. Over recent years, AQEG report (2021) concludes that it is likely that little change has occurred in ozone concentrations in rural areas. In urban areas, ozone concentrations have slightly increased.
Overall, however, 45% of UK surface-level ozone was derived from precursor emissions outside of the UK (AQEG, 2021). Therefore, precursor emissions, such as NMVOC emissions, produced from sources within the UK will only be responsible for just over half of the UK surface ozone monitored within the UK. However, it is unclear if this is true throughout the UK or if local emissions sources, such as Scotch whisky facilities, may change this ratio locally.
By comparing the measured number of exposure limit exceedances to the concentration levels at which health impacts are predicted, it is likely that the observed presence of ozone in Scotland causes health impacts. Monitoring sites in Scotland repeatedly measure 8-hour mean concentrations exceeding 100 μg/m3, despite evidence that health risks occur at concentrations exceeding 20 μg/m3. However, secondary formation of ozone is NOx limited in the UK, and therefore additional emissions of NMVOC are unlikely to greatly increase ozone concentrations. Related to this, ozone formation is highly dependent upon meteorological conditions, which are likely to have a greater impact on ozone concentrations than the emissions from the Scotch whisky industry. That being said, Scotch whisky production contributes significantly to the total NMVOC emissions in Scotland which may form ozone. Therefore, while the impact on human health of Scotch whisky production as a result of ozone formation is likely to be low further studies are recommended to fully verify this impact.
4.4 Secondary aerosol formation
Secondary aerosols are produced from interactions between VOCs and other molecules in the atmosphere. When VOCs are oxidised they produce secondary organic aerosols (SOAs) which may then form tertiary aerosols through further reactions. First-generation products are mostly hydroxyl, carbonyl, hydroxycarbonyl, hydroperoxide and peroxynitrate (Hallquist et al., 2009). Small oxygenated compounds, such as ethanol, have a low propensity to form SOAs (McFiggans et al., 2015). VOCs may also form secondary inorganic aerosols (SIA) through other reactions. The categories of both SIAs and SOAs encompass a large variety of different pollutants with different properties and therefore with varying impacts on human health.
There are no studies concerning the specific make-up of the SOAs produced from the Scotch whisky production process. This is partly due to SOAs in general not being traditionally targeted in emissions studies (AQEG, 2020). Some research has been conducted covering the SOAs formed from ethanol emissions from the evaporation of biofuels (Suarez-Bertoa et al., 2015). However, typical biofuels are usually blended with gasoline and therefore the conclusions made in these studies cannot be applied to the emissions from the Scotch whisky industry.
In addition to SOAs, NMVOC emissions from Scotch whisky may also form secondary inorganic aerosols (SIAs). SIAs consist of a mixture of components such as sulphates, nitrates, black carbon and mineral dust and are part of the particulate matter (PM) in the atmosphere. Smaller particles in the PM2.5 fraction can be carried over long distances by wind before settling elsewhere. Consequently, the secondary formation of PM2.5 as a result of the Scotch whisky industry will not have a purely localised impact.
Given the complexity of the formation pathways and the wide variety of aerosols which could be formed, assessing the human health impacts of SIAs and SOAs produced from Scotch whisky emissions will be difficult. It is still unclear what aerosols would be produced from ethanol emissions and the quantities of these aerosols produced.
If further research was conducted to fill the gaps in understanding the quantity and types of SIAs and SOAs that could be produced, then some progress may be able to be made to determine the likely human health impacts. Secondary aerosols are treated as PM2.5 in the Defra damage cost assessment, and they are not distinguished according to their chemical species. The same assumption is widely applied, for example in work for the US EPA and the European Commission (EC). Defra’s analysis of PM2.5 covering both primary particles and secondary aerosols (Birchby et al., 2019; Defra, 2023) includes the following impacts:
- Mortality
- Respiratory and cardiovascular hospital admissions
- Coronary heart disease
- Stroke
- Diabetes
- Lung cancer
- New incidence of asthma in children
- Productivity
- Building soiling
These effects are quantified for primary particles and secondary particles formed in the atmosphere following release of NH3, NOx and SO2. SIA impacts are not included in Defra’s damage costs for VOCs. They are, however, included in damage cost work for the European Environment Agency (EEA, 2014; Schucht et al., 2021a, 2021b) and this may provide a mechanism for data to be factored into an assessment of the damage costs associated with NMVOC emissions from Scotch whisky maturation. Such an assessment is, however, beyond the scope of this project.
As discussed in Section 4.3, NMVOC reacts with NO2 to form ozone. NO2 may then consume the ozone produced in this reaction, forming nitrates. Studies have found that secondary nitrates can be observed tens of hundreds of kilometres downwind from the source of the NO2 (Allen, 2019). It is therefore likely to be difficult to determine the quantity of nitrates produced from Scotch whisky production emissions. Research into the health impacts of exposure to nitrates is not extensive. Some studies have suggested links between exposure and propensity for individuals to develop cardiovascular issues or respiratory issues (Kim et al., 2012; Son et al., 2012). In addition to nitrates, evaporated ethanol may also be converted into acetaldehyde which is a well-known carcinogen (IARC, 2012). As a result, people in the vicinity of maturation sites could be exposed to concentrations of acetaldehyde above the expected background concentrations. Advice from the UK government and the World health Organisation is to treat nitrates as of equal harmfulness as other particles.
No studies could be found regarding the creation of secondary aerosols from ethanol production. Given the complexity of the formation pathways and the wide variety of aerosols which could be formed, determining the associated impacts on human health were not possible at this time. Although the health impact is likely to be minor or even negligible, judgement cannot be made as to the likely severity of the human health impacts from aerosol formation once the ethanol is emitted into the atmosphere without dedicated modelling.
Contact
Email: airquality@gov.scot
There is a problem
Thanks for your feedback