Building standards - ventilation guidance: research
Research to investigate whether changes made to the building standards guidance in 2015 (standard 3.14) have resulted in better occupant interaction with the dwellings natural ventilation components and improved levels of indoor air quality within the dwelling.
This document is part of a collection
4. Household survey
Aims and objectives
4.1. The main aim of WP2 (household survey) is to gather data about occupants' awareness of their ventilation provision, use of the CO2 indicators and how this affects their air quality. The objective was to undertake a general survey of 200 homes built under the 2015 regulations.
4.2. The survey was based on the questionnaire used in the 2014 study (Sharpe, 2014). This enabled some longitudinal comparison of responses, for example, to identify changes in awareness of trickle vents. The questionnaire has been complemented with additional survey content to address the specific questions raised in this study concerning the use of CO2 sensors and consequent interaction with ventilation provision, including mechanical and natural systems. Such questions included awareness of the sensors, how it affects their ventilation behaviours, the value of the alert systems and any unintended or negative consequences. For logistical reasons a commercial research company, Research Resource was used to conduct these surveys, based on a survey design and brief developed by the team and approved by BSD.
The Survey
4.3. The proposed figure of 200 household surveys proved to be challenging. Challenges related to timescale and budget were exacerbated by the limitations on face-to-face surveys posed by the governmental restrictions due to the Covid Pandemic.
4.4. As a result, the original plan of identifying 800 addresses in order to complete doorstep face-to-face survey was changed to 2000 addresses for a postal survey, in order to attain the original figure of 200 completed surveys. The postal survey resulted in 115 responses.
4.5. Following the restrictions posed by the Government, from 13 December 2021, the professional survey company stopped carrying out in-home interviews. After discussions, the Building Standards Division agreed that the survey could proceed via postal surveys until the ban on doorstep surveys was lifted. The doorstep interviews were resumed in January 2022. As a result, the postal survey was supported by 23 additional face-to-face interviews, bringing the total number of responses to 138 responses.
Results
4.6. The questionnaire presented questions regarding the household characteristics, awareness of ventilation systems (including pattern of ventilation in living room, bedroom and bedroom at night in winter and provision of ventilation advice), provision of a CO2 monitor (including occupants' understanding and use of the monitor) and the availability for long term monitoring.
4.7. The following section will focus on the responses related to engagement with ventilation systems and ventilation awareness. A complete set of responses is available in Annex A.
| method | responses obtained | interested in follow up monitoring | |
|---|---|---|---|
| postal survey (Sept. 2021): | 2000 addresses contacted via post | 115 | 39 |
| face-to-face (Nov.-Jan 2022): | 50 addresses visited | 23 | 18 |
| total | 138 | 57 |
Household information
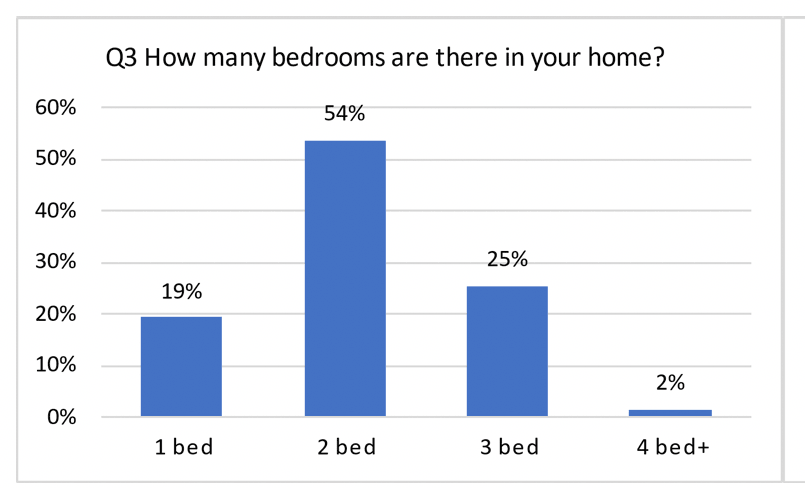
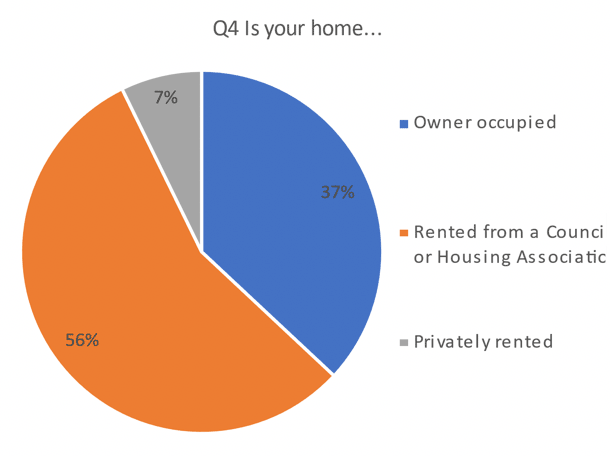
4.8. The main observation regarding the household survey is that more than half of the households were rented from a Council or Housing association while a small proportion (7%) were rented privately. 37% of properties were owner-occupied. In addition, over half of the households surveyed (54%) had 2 bedrooms.
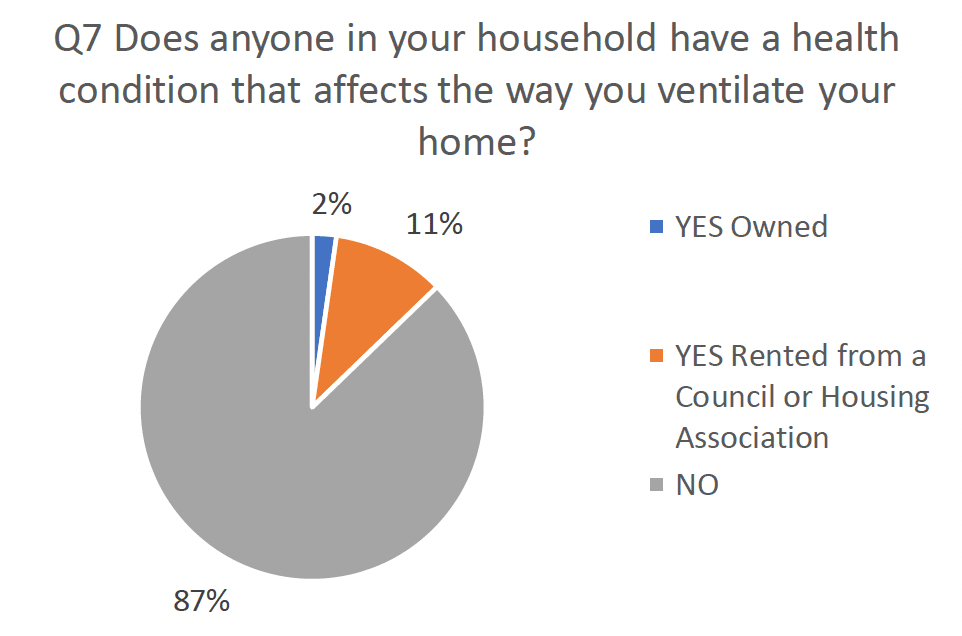
4.9. In total 13% of homes reported health conditions linked to the respiratory system, of which the majority (11%) live in social housing. Of all those households reporting health issues, the majority reported issues with asthma.
Awareness of ventilation systems
Trickle vents
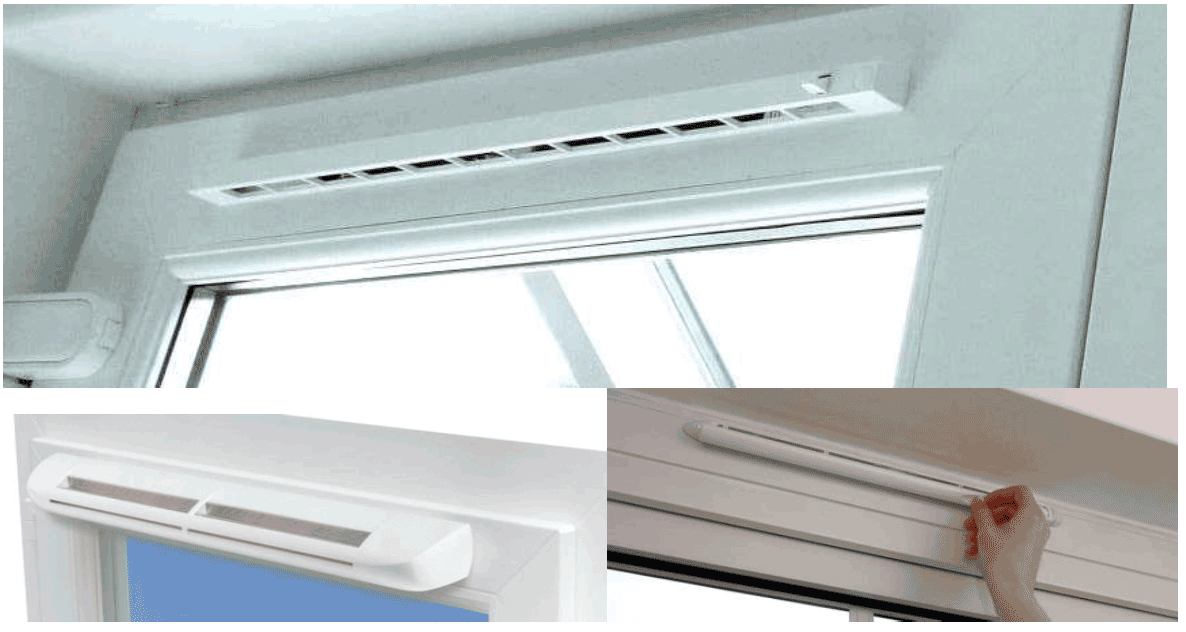
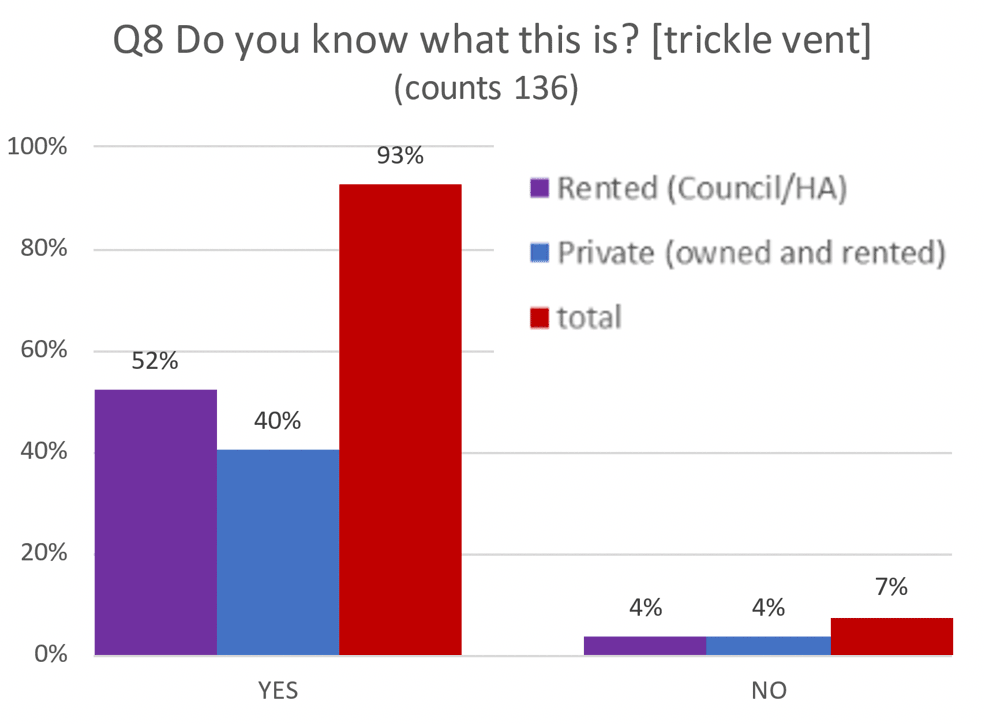
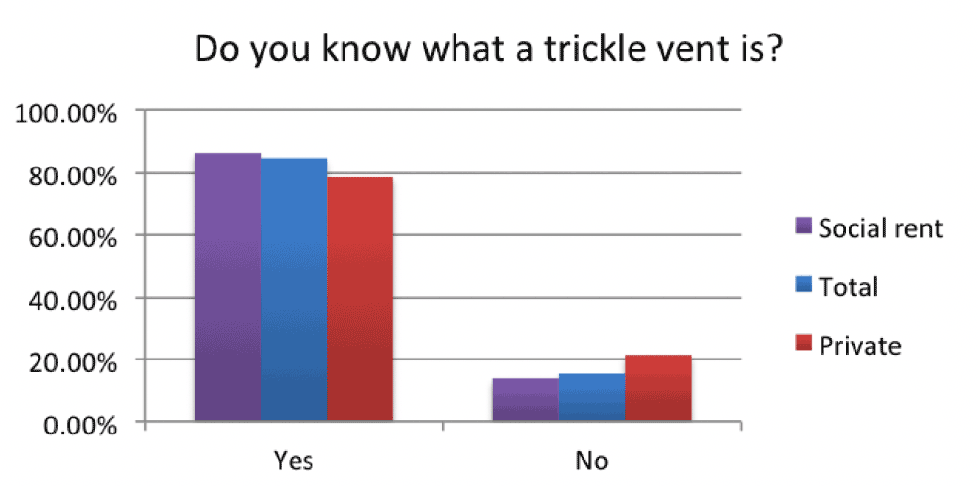
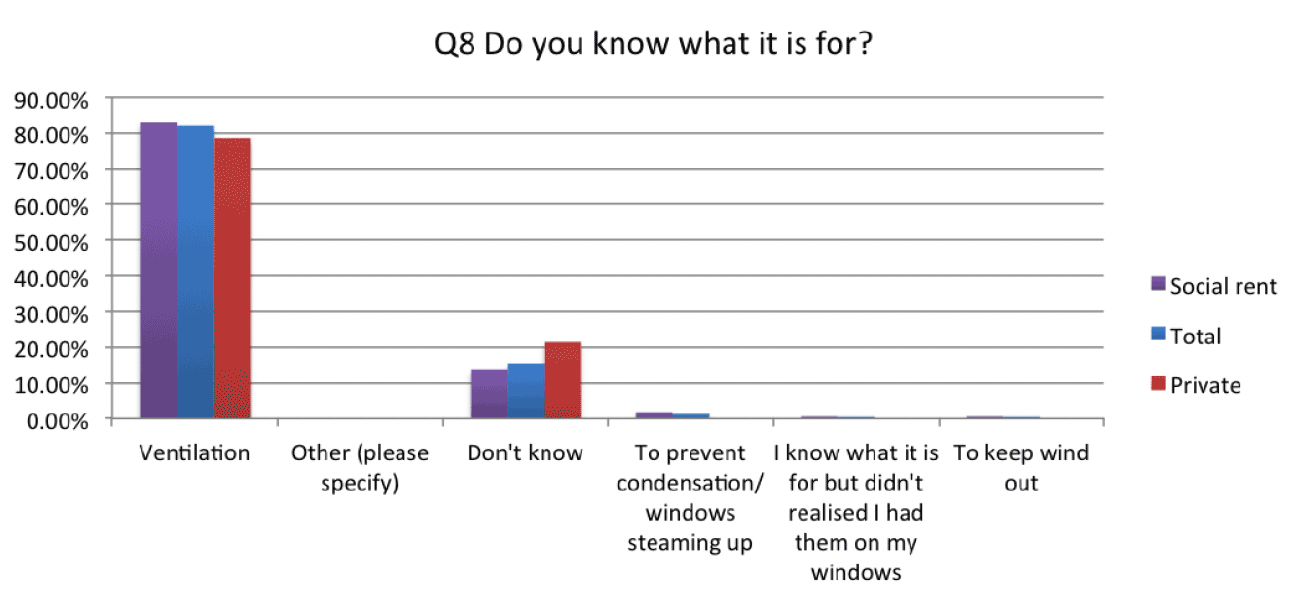
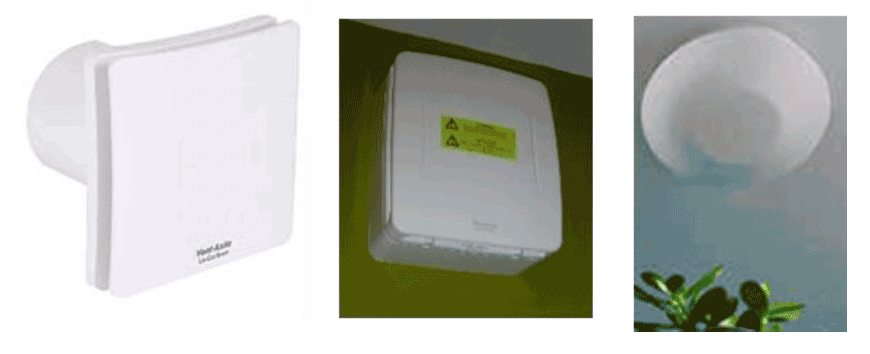
4.10. When shown the trickle vents in figure 4.4 below, and asked whether respondents know what this is, the vast majority (93%) confirmed that they knew what it is and what it is for. Results therefore suggest that there has been an increase in awareness of trickle ventilation compared to the 2014 study when about 80% of respondents stated their awareness of trickle vents.
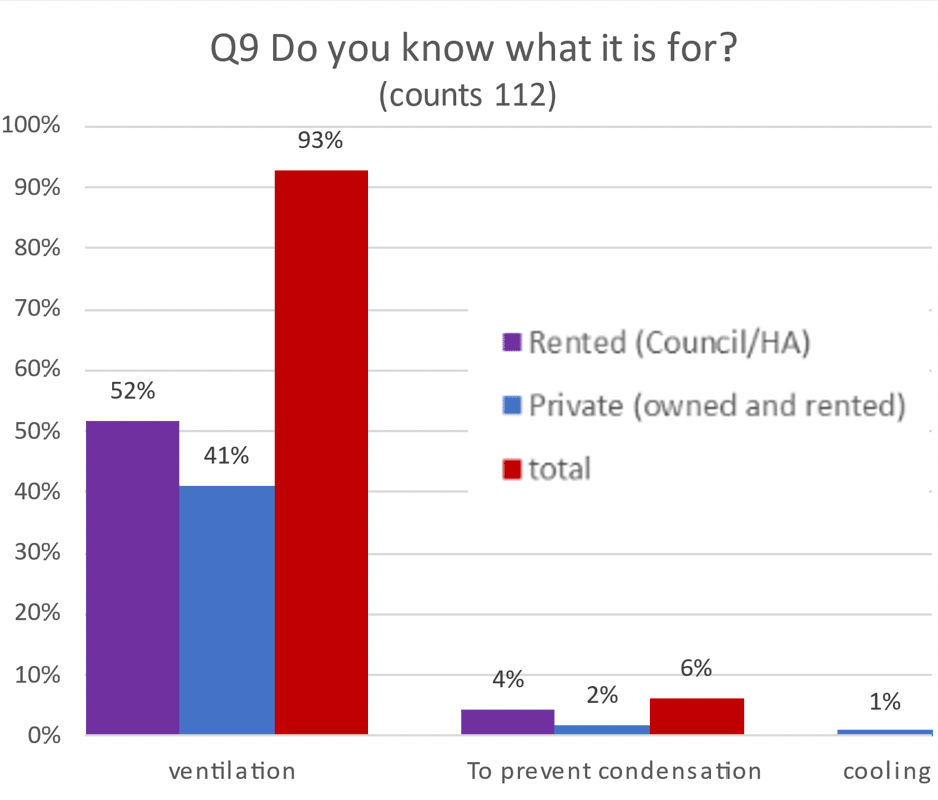
4.11. In question Q9, when asked what a trickle vent is for, 93% of responses were grouped under the generic category 'ventilation' (93%). Other responses include statements such as "to stop/help with condensation".
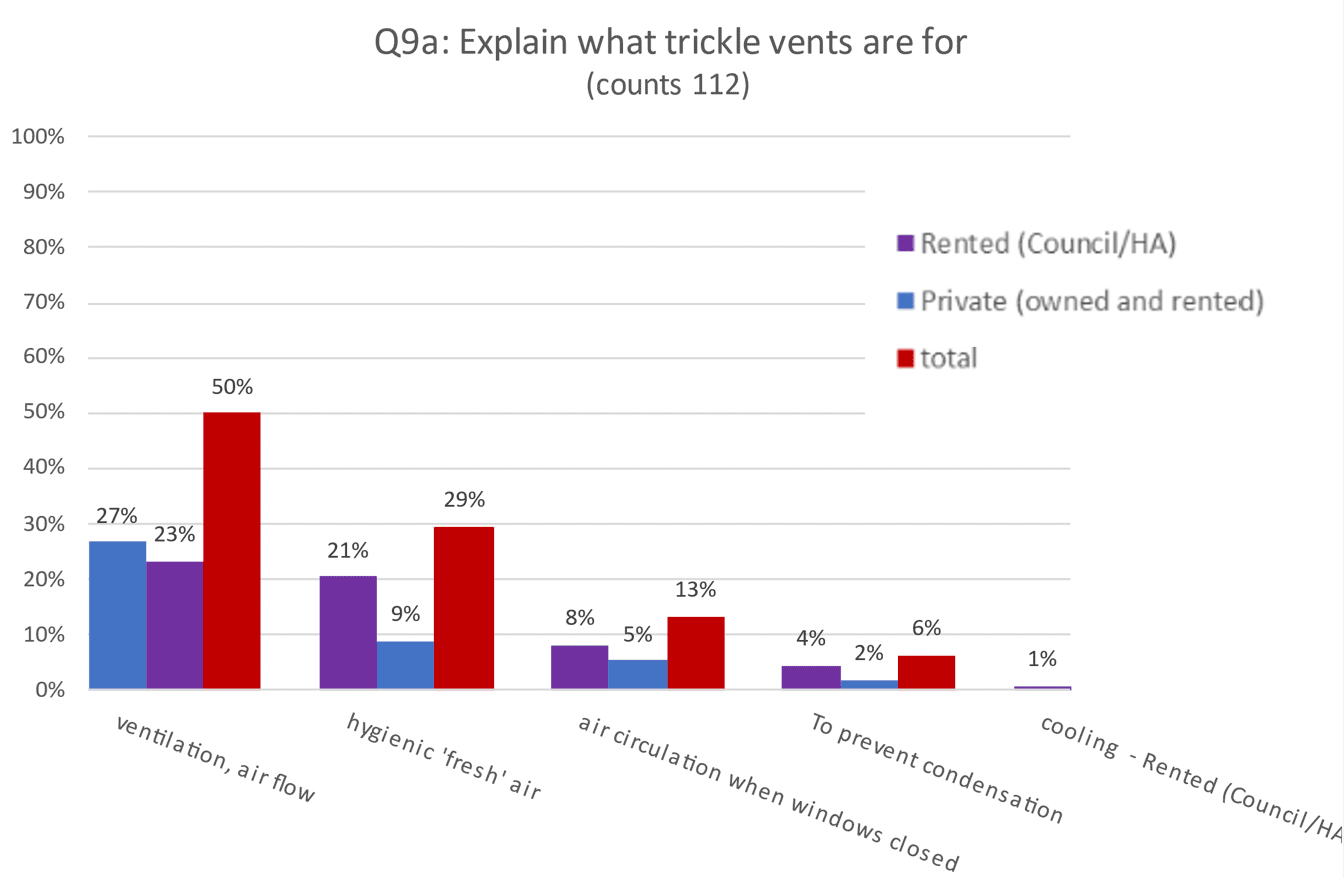
4.12. Q9a asks to detail what exactly trickle vents are for. For the majority (50%) trickle vents are part of the ventilation (generic concept). On the other hand, 29% stated the trickle vents provide 'fresh air', indicating that occupants consider the air hygiene aspects of ventilation. In addition, 13% stated the trickle vents provide air circulation when windows are closed, therefore suggesting that occupants consider trickle vents as an option to not open the windows. Then, 6% view trickle vents as a means to avoid condensation. Finally, 1% view trickle vents as means for ventilative cooling.
4.13. The different aspects nuanced for ventilation suggests that occupants have different levels of understanding of ventilation, strongly supporting the claim that occupants are increasingly aware of trickle vents and ventilation. While in the 2014 study (Sharpe, 2014) 15% of respondents stated to not know what trickle vents are, results of the current survey (2022) show that only a 7% don't know what a trickle vent is. This further strengthens the claim that occupants are increasingly aware of their ventilation systems. Whilst the survey did not include explicit questions about the influence of Covid, there has been increased messaging about ventilation from Government and the media, including the Hands, Face, Space, Ventilate[5] campaigns and this may be impacted on occupant awareness.
Extract fans
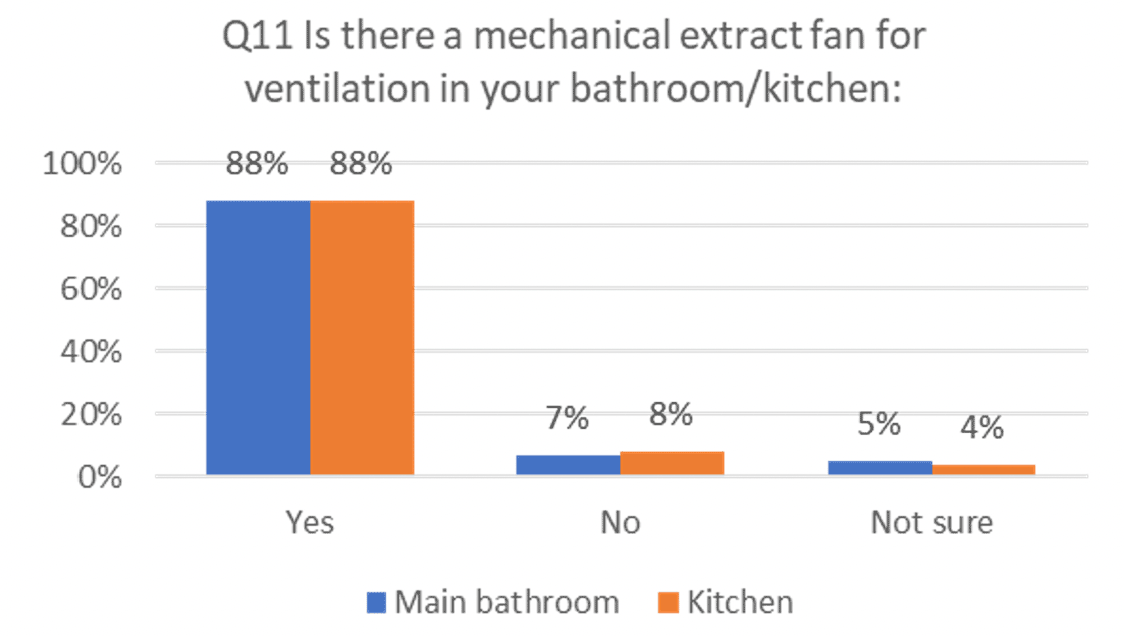
4.14. With regards to mechanical fan extracts, out of 138 responses, most households (88%) had a mechanical extract fan installed in both the kitchen and bathroom. Also, it was found that only a minor portion were unaware of the existence of a mechanical extract fan.
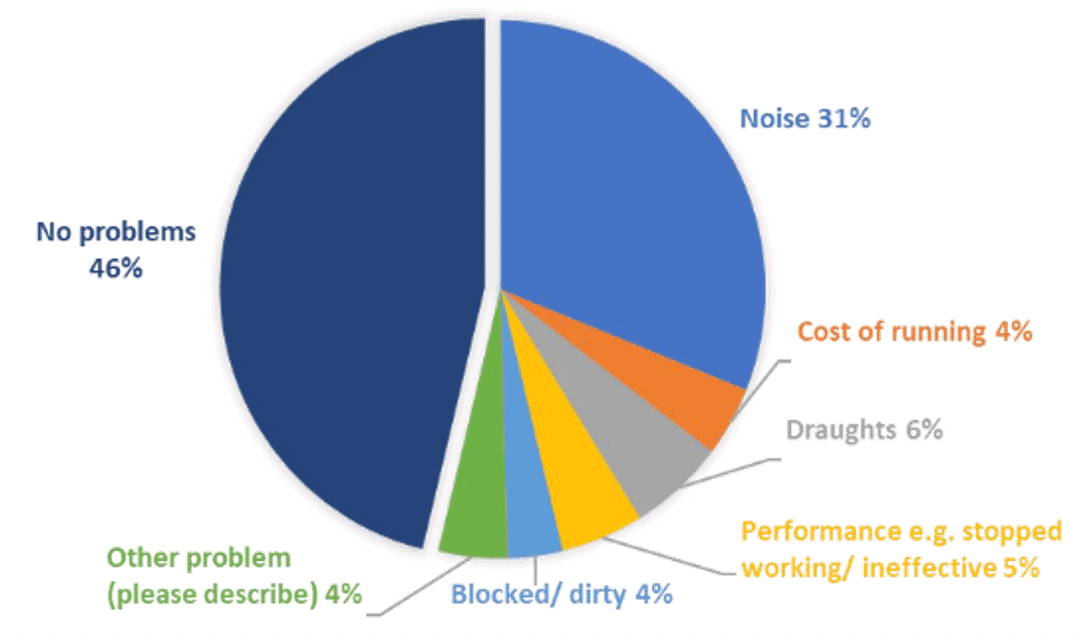
4.15. For those that stated they had an extract fan, more than half reported some problems with the fans, the main issue being noise. 'Other problem(s)' reported included: "Seems a waste of material when ventilation can be resolved with simpler/ natural solutions", "Downstairs toilet is freezing" and "an infestation of maggots so all my vents had to be closed off".
Practices of ventilation in living rooms and bedrooms
Trickle vents
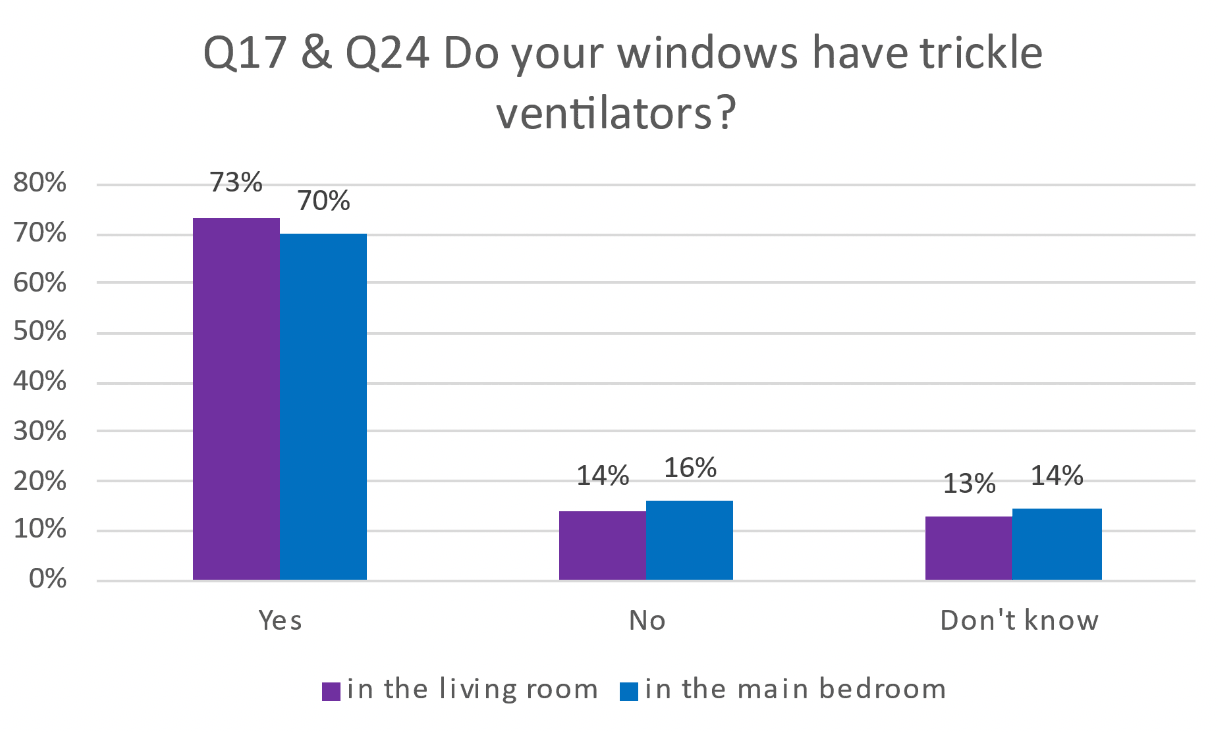
4.16. The majority of households are aware of the presence of trickle vents in their homes (73% in the living room and 70% in bedrooms). However, there is a significant portion of households (13-14%) that do not know if their windows are equipped with trickle ventilators.
4.17. Regarding trickle vent opening frequency, when asked 'how often are the vents open during the day', respondents largely (75% in living room and 69% in bedroom) left them open all of the time while a small portion (13% in living room and 12% in bedroom) never open. Looking at the 2014 study submitted between January and March 2014 (Sharpe, 2014), where the question was phrased differently 'how often do you open the trickle vents during the day?', respondents lean towards not opening the trickle vents, suggesting a change in tenency from "never open" to "open all the time".
4.18. This figure is in contrast with the responses obtained during the 2014 study depicting a noticable switch between "open all the time" and "never open".
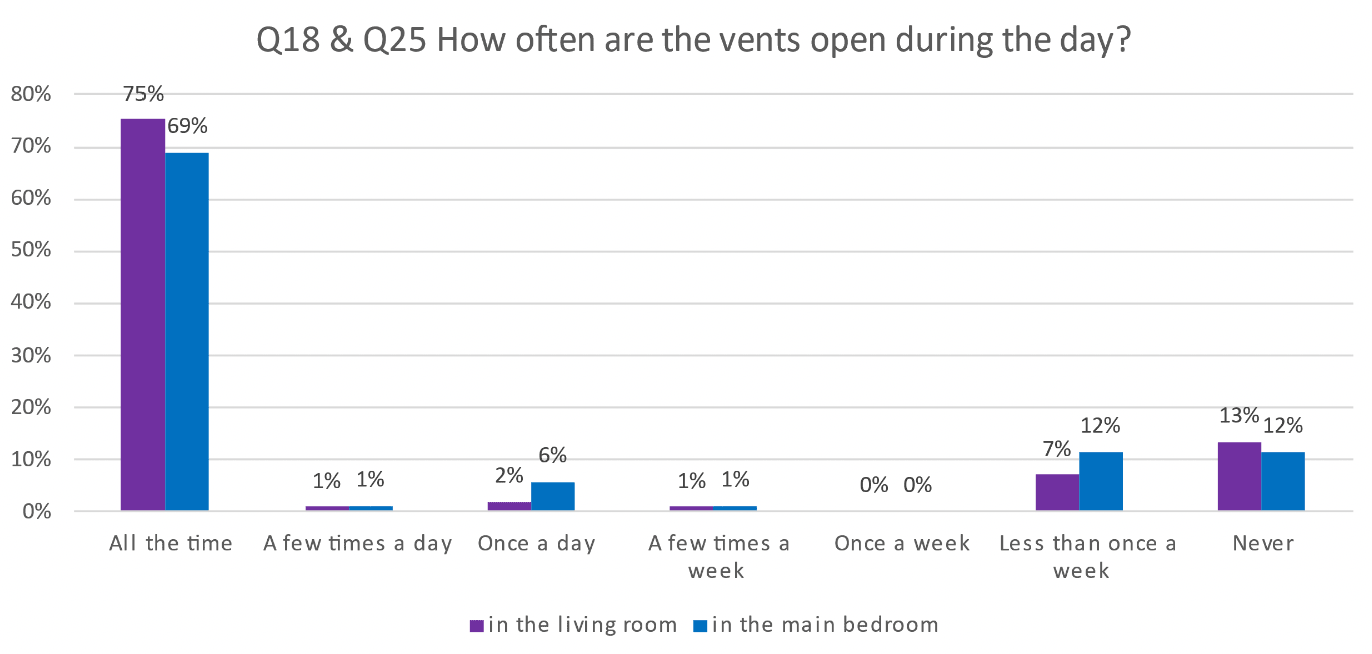
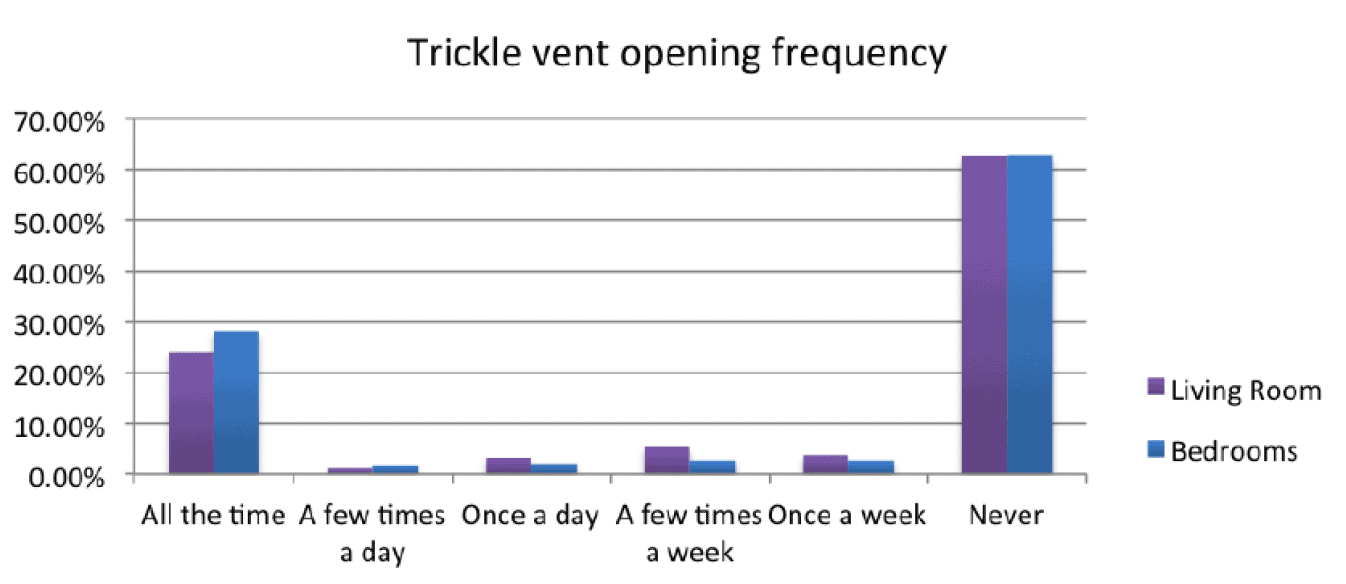
Occupants were asked how frequently they used the trickle vents in the bedrooms and living rooms.
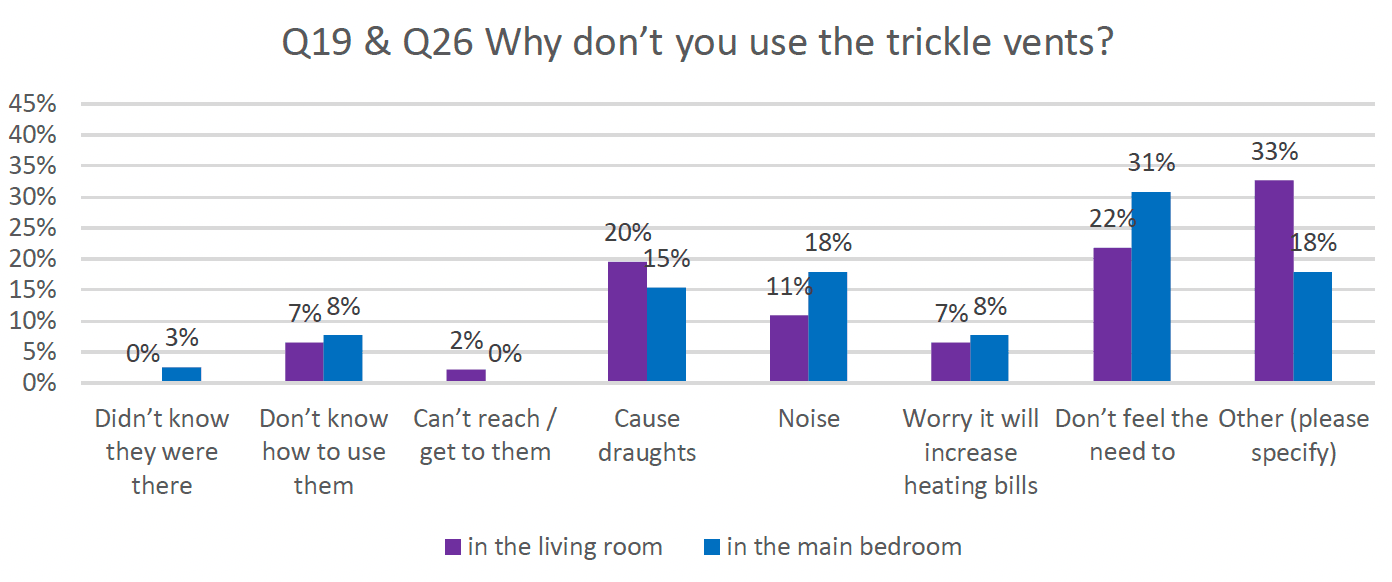
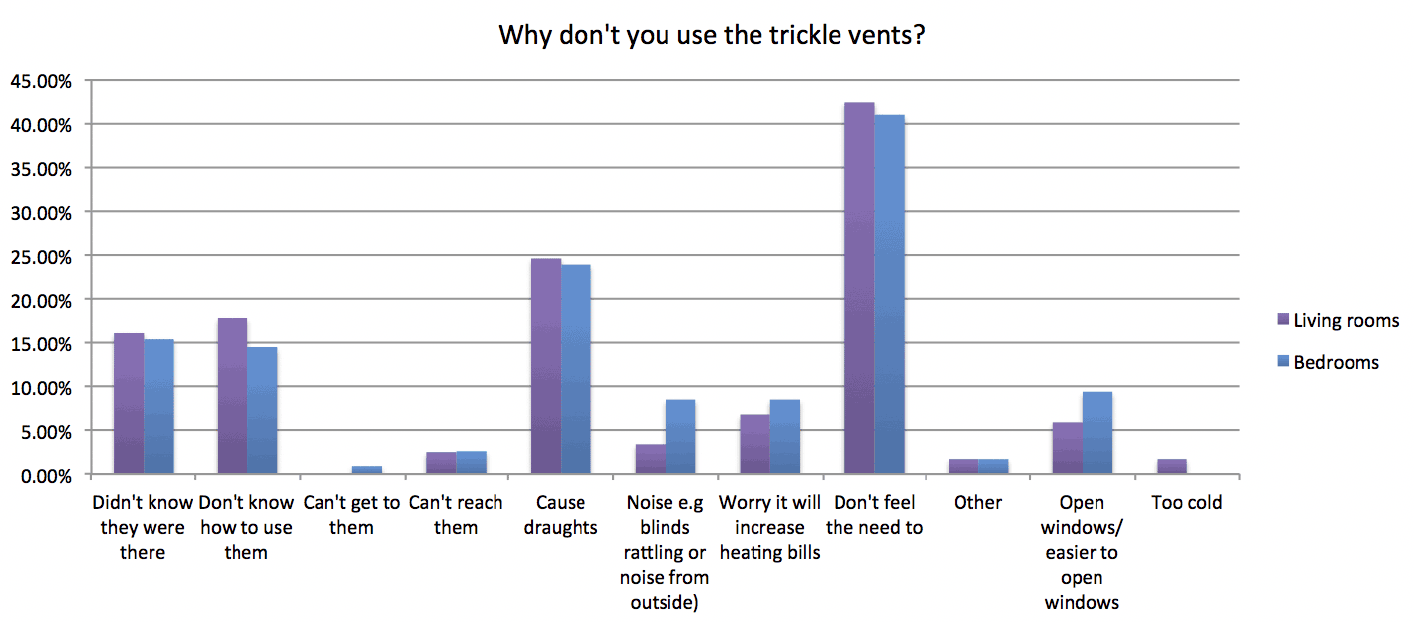
4.19. Of those that do not use trickle vents, reasons for not using the trickle vents remain similar to the 2014 study (Sharpe, 2014), where the most reported reasons to not use trickle vents are noise, drafts and don't feel the need to.
Windows
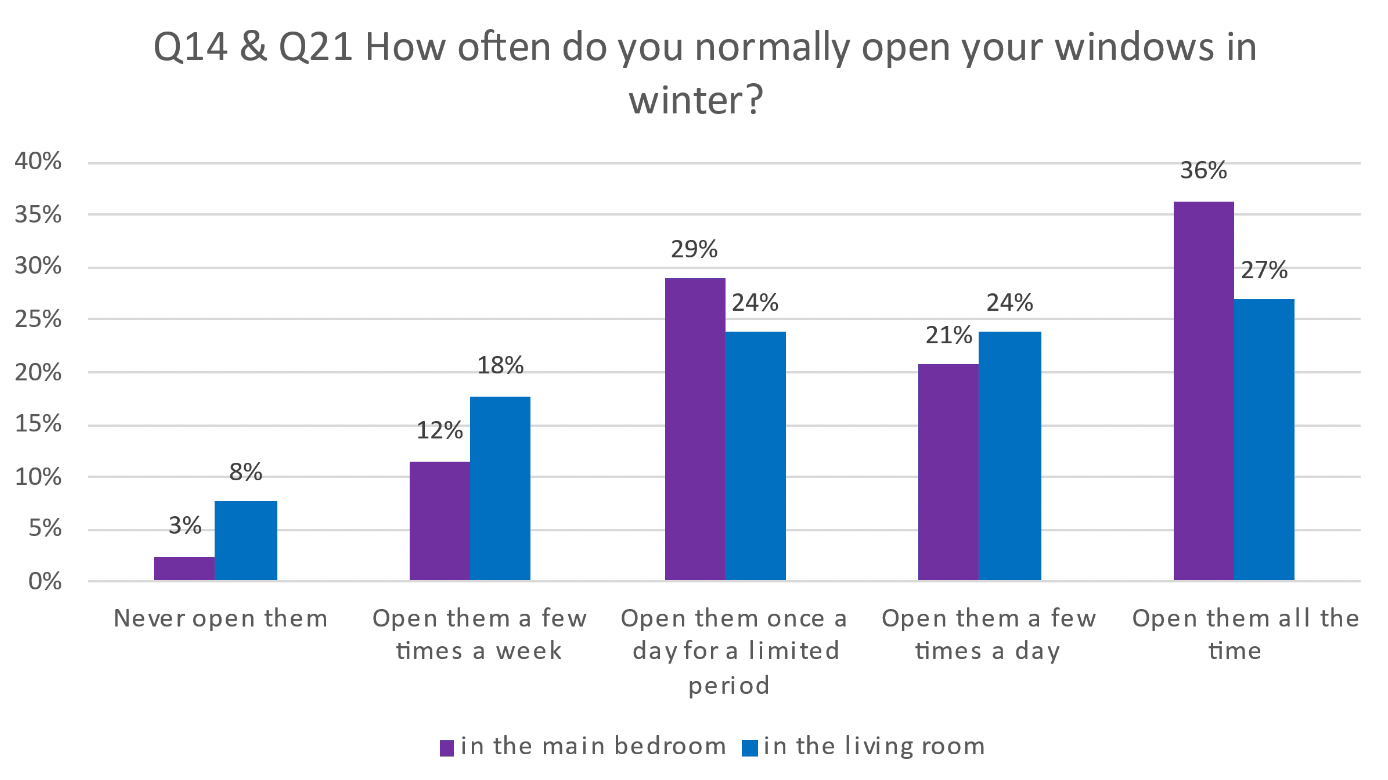
4.20. Occupants were asked about window opening use in the living room and bedroom. In general, people showed engagement with window opening. In fact, the majority of occupants (27%) open the living room windows all the time, in contrast to 8% never opening them. Bedrooms showed a similar response with 36% opening windows all the time, and 3% never opening them.
4.21. This represents a major change from the 2014 survey (homes built to 2010 regs), with a considerable increase in reported window opening. This could be due to an increased awareness of indoor air quality or increased need to open windows due to indoor environments being stuffier. The latter hypothesis however is not supported by evidence provided in paragraph 4.26 in which responses, in general, reported a satisfactory perception of the indoor environment, but as noted above, the Covid pandemic may have increased awareness of ventilation use.
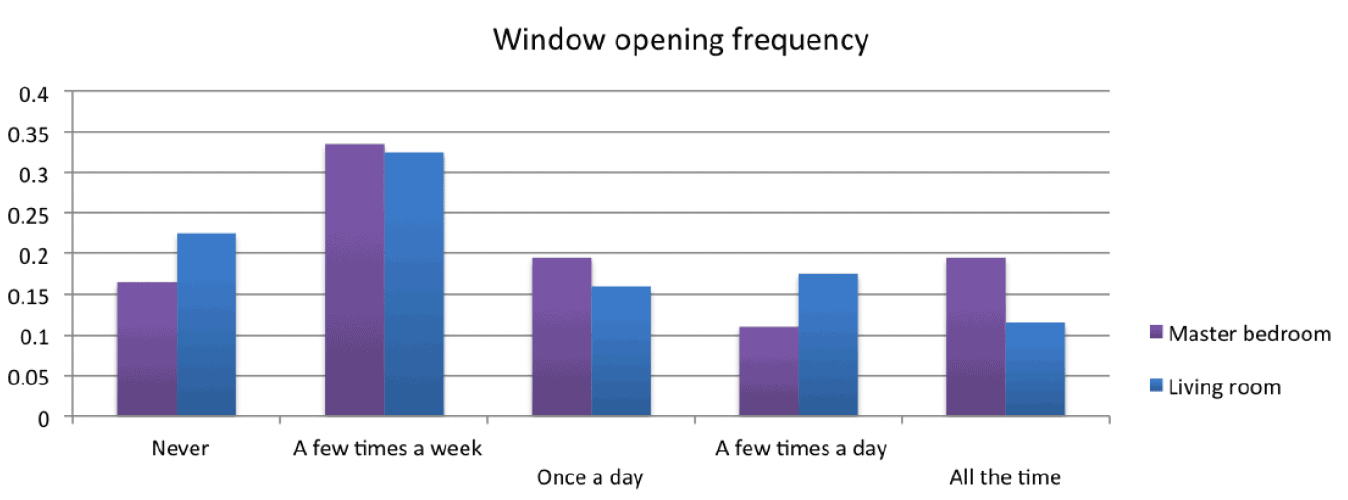
4.22. Occupants were also asked about the drivers and barriers for opening windows. The predominant driver was to provide "fresh air", followed by "too warm". In comparison, the main driver reported in the 2014 survey (2014) was "too warm".
4.23. At the time, the 2014 survey which included addresses completed after 2014 (to meet Building regulations 2010) the specified air tightness requirement was of a maximum 10m3/hr/m2 @ 50 Pascals (Pa.) The current survey is based on addresses completed by 2019 (to meet Building regulations 2015) with a requirement of a maximum air loss figure of 5m3/hr/m2 @ 50 Pascals.
4.24. To provide "fresh air" is one of the main drivers for window opening. Linking this answer to the one provided in paragraph 4.20, may be an indication of an increased need to ventilate homes, especially bedrooms. This hypothesis is strengthened by the fact that the response "to provide fresh air" has grown when compared to the 2014 study (in bedrooms from about 10% to about 40%).
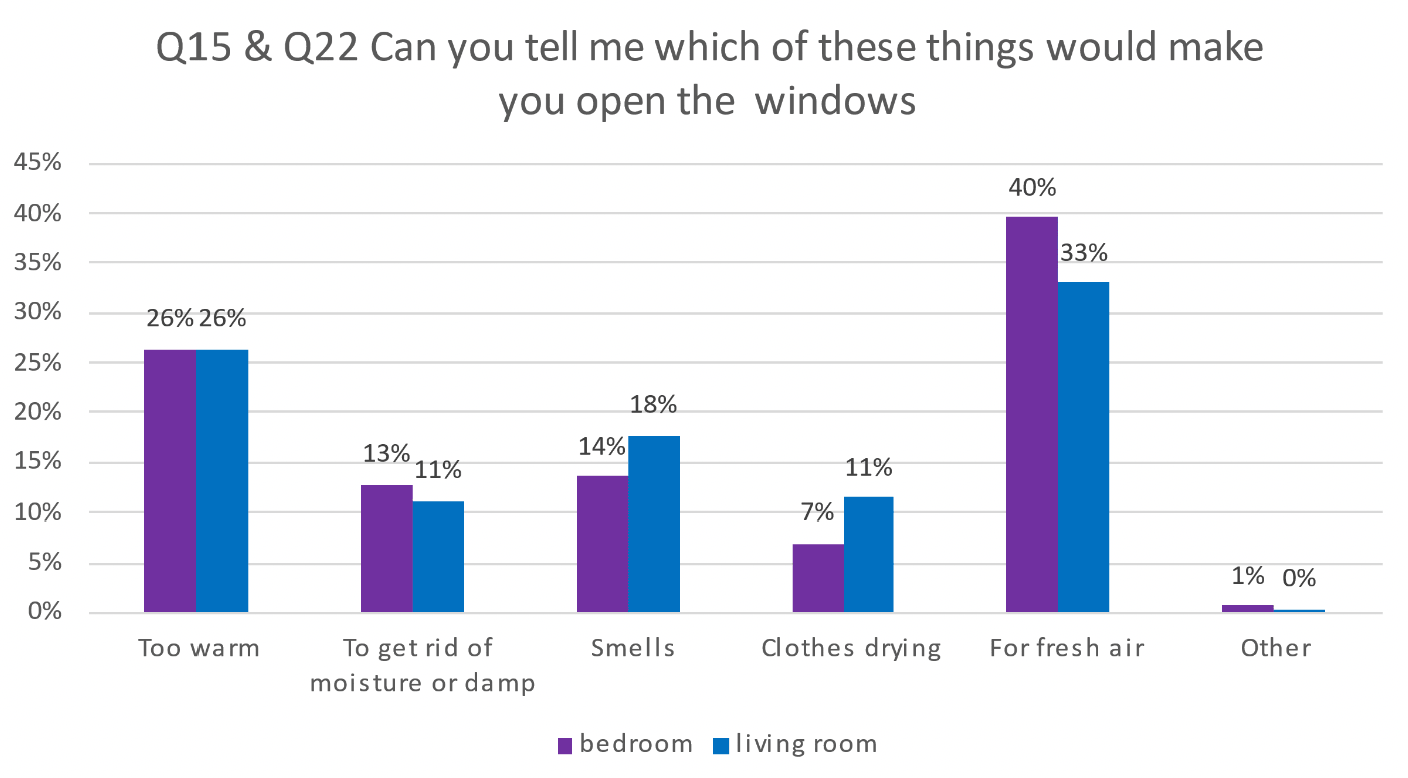
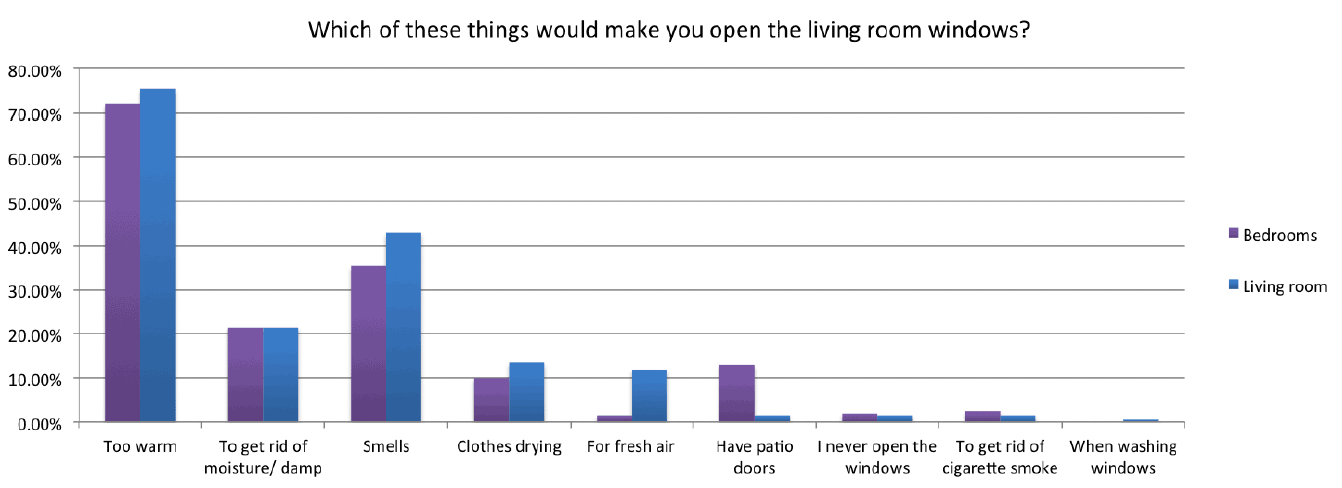
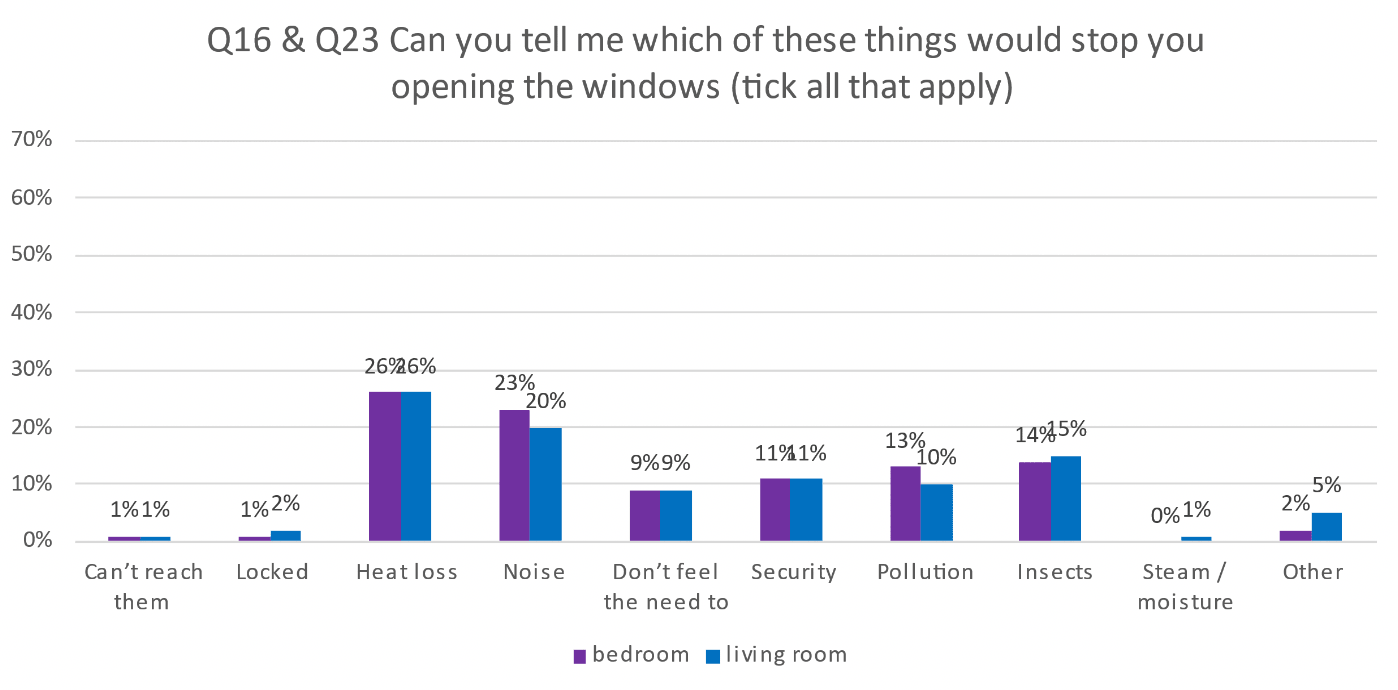
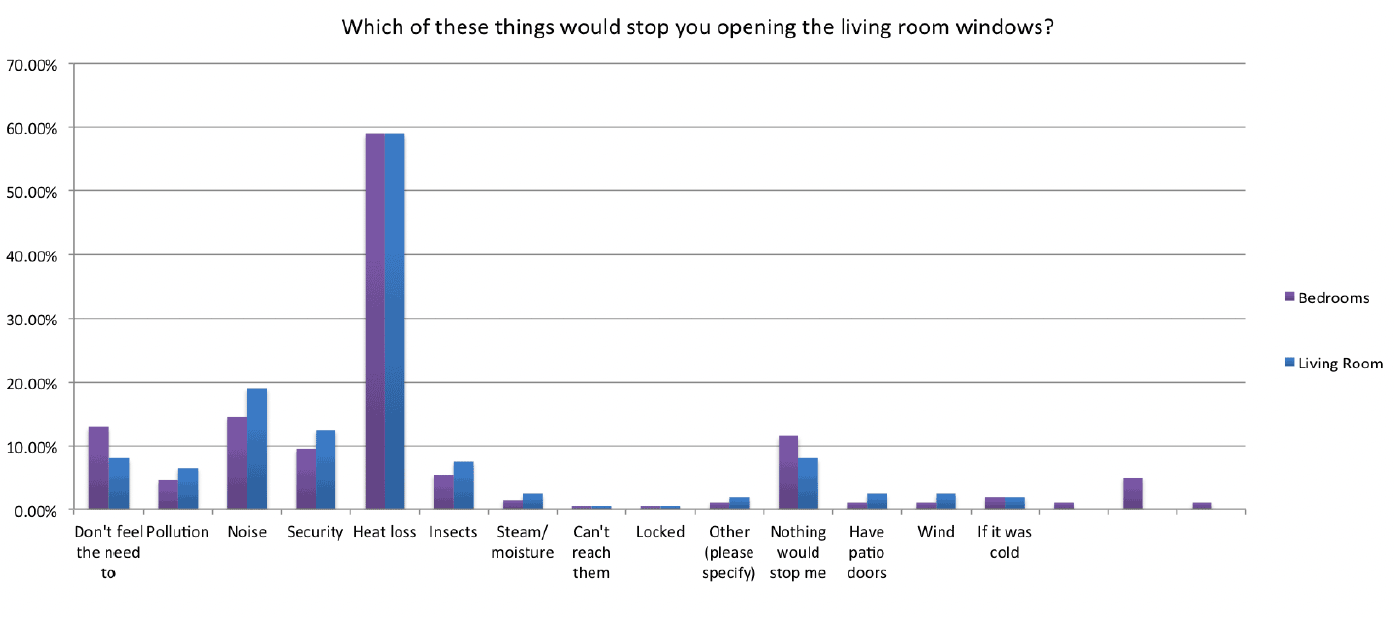
4.25. In comparison to the 2014 survey, "heat loss" as a barrier to window opening has significantly reduced (from 60% to 26%). "Noise" as a barrier remains unchanged.
Bedroom conditions at night in winter
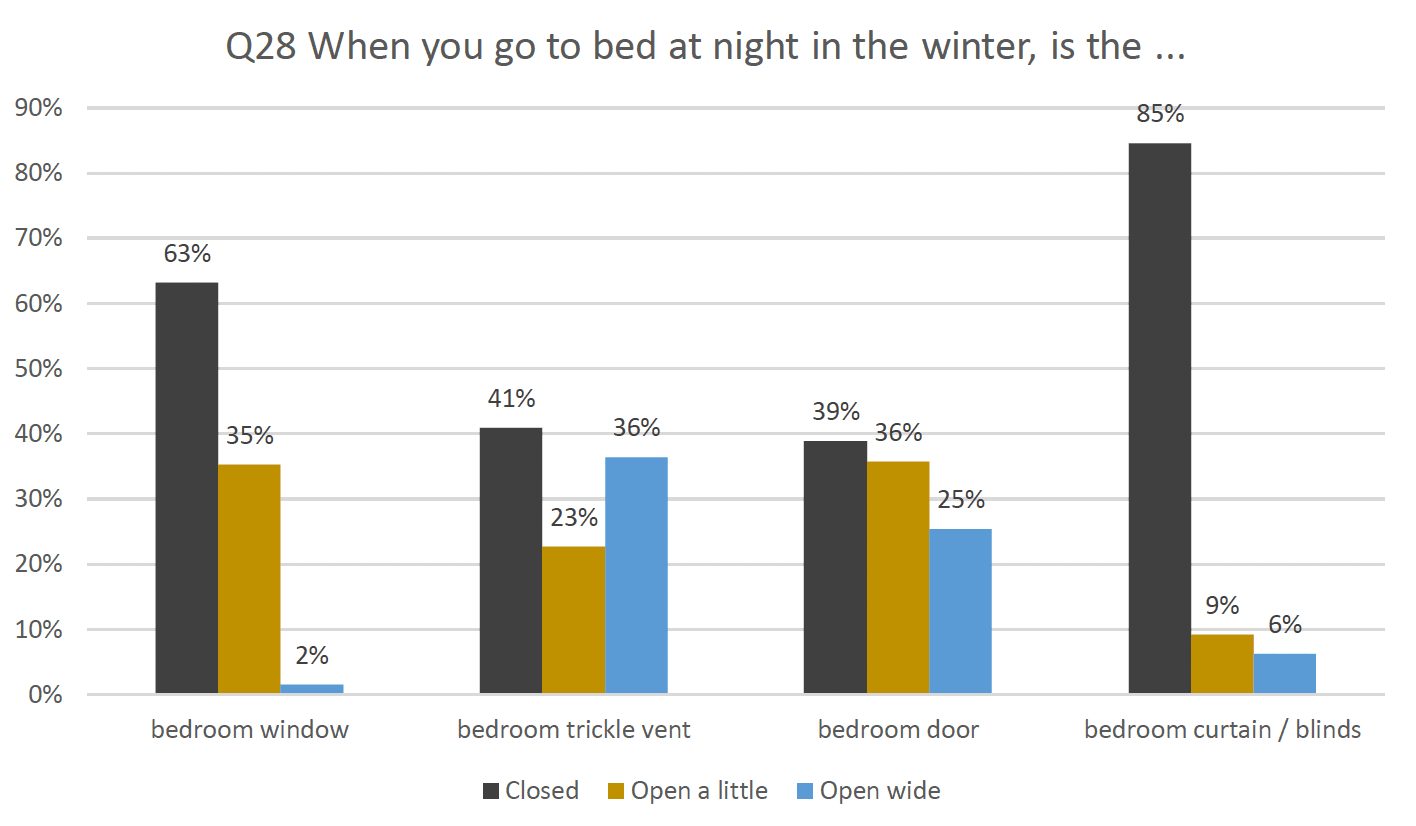
4.26. The majority of respondents keep windows closed at night (63%). While 39% of respondents keep bedroom door closed at night, a combined 61% keep the door either open or open a little. Similarly, for trickle vents, while 41% keeps the trickle vents closed at night, a combined 59% leaved them either open wide or open a little.
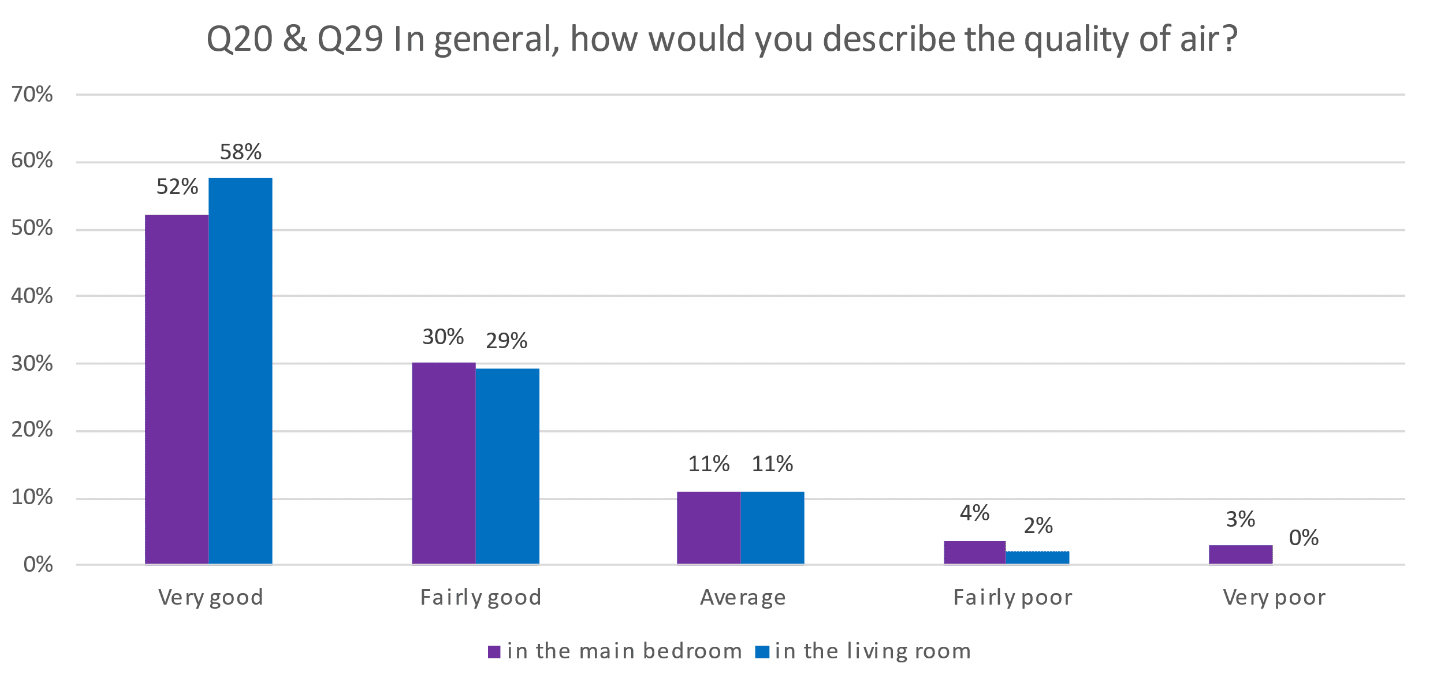
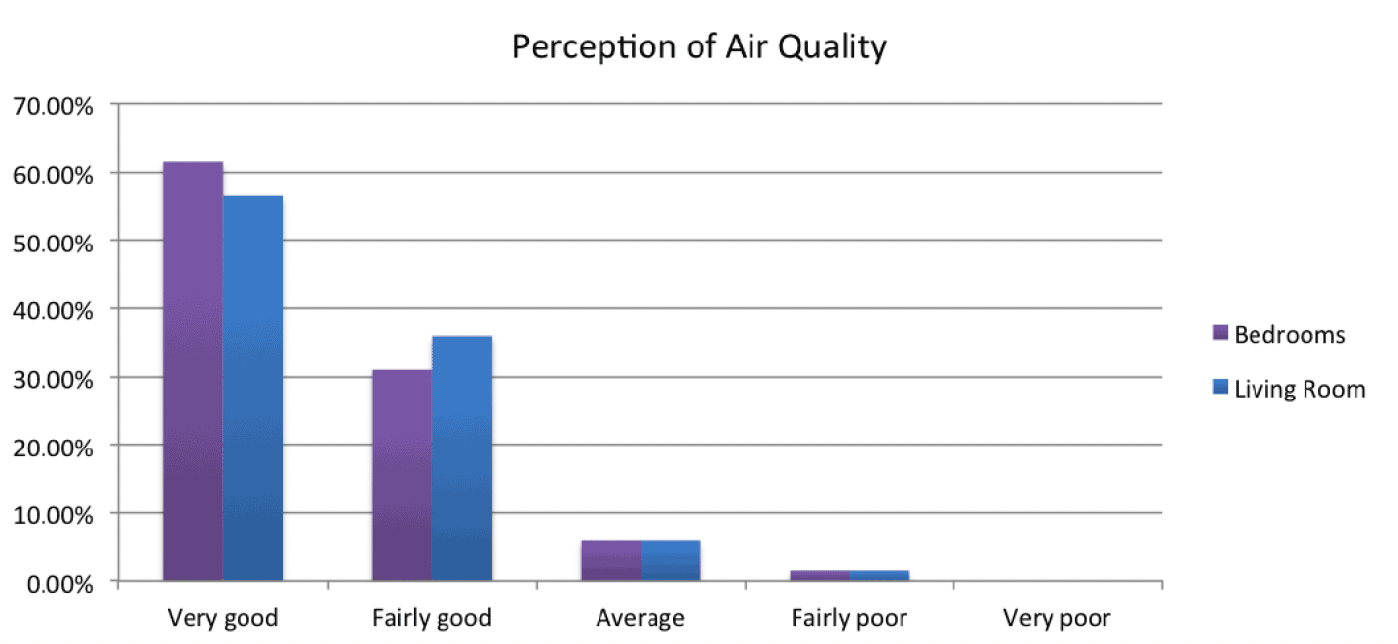
Indoor air quality perception
4.27. The majority of respondents perceived the quality of air in their home as 'very good'. This is similar to the 2014 survey, however the perception of air quality in bedrooms has decreased.
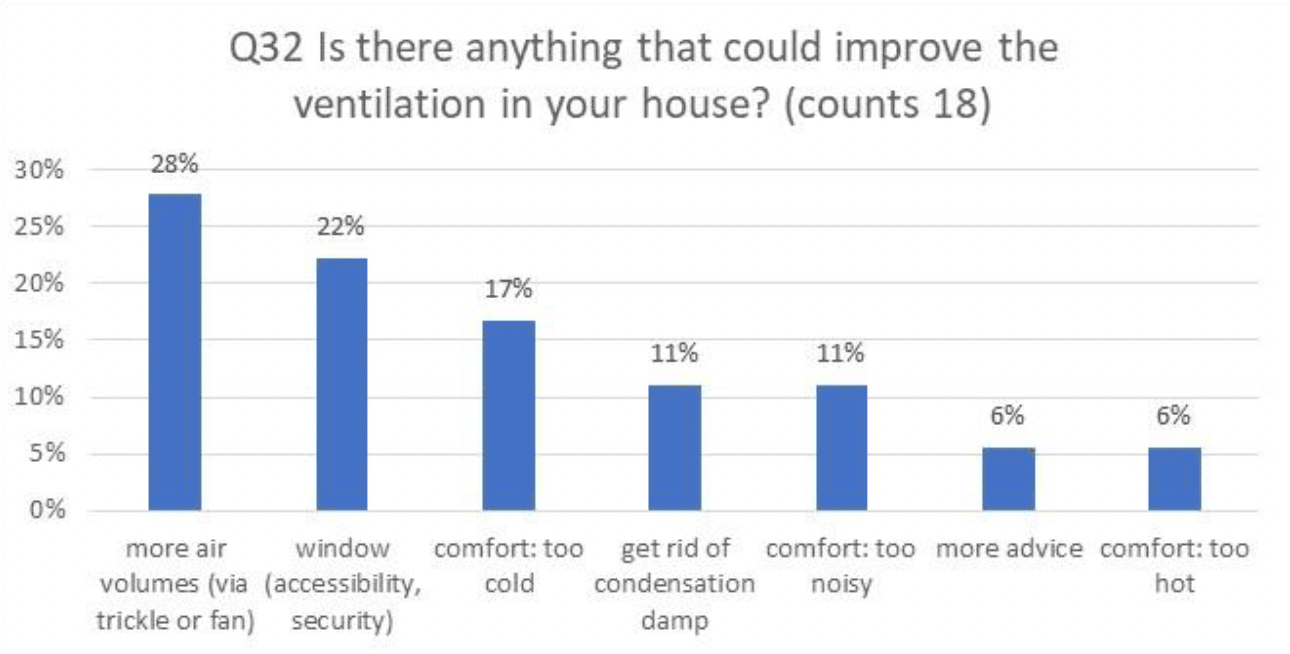
4.28. When asked "Is there anything that could improve the ventilation in your house?", only a few responses (18) were obtained. It is interesting to note that the majority of responses relate to a need for increased ventilation, whether that is via more air volume or accessible/secure windows (50% of responses). This can be linked with responses in paragraph 3.23 showing an increased need to provide "fresh air".
4.29. Some respondents stated 'too cold' in response to things that could improve the ventilation. This may be due to 'cold drafts' caused by the trickle vents. Depending on the type of construction, this could be further exacerbated by the fact that new homes with modern methods of construction cannot store heat (i.e. timber frame), so comfort in such cases relies on air temperature alone. Therefore, even though this survey shows an increased use of trickle vents (see paragraph 4.18), unless adjustments to provide comfort are made, there could be a portion of households that would avoid using trickle vents despite awareness.
Ventilation advice
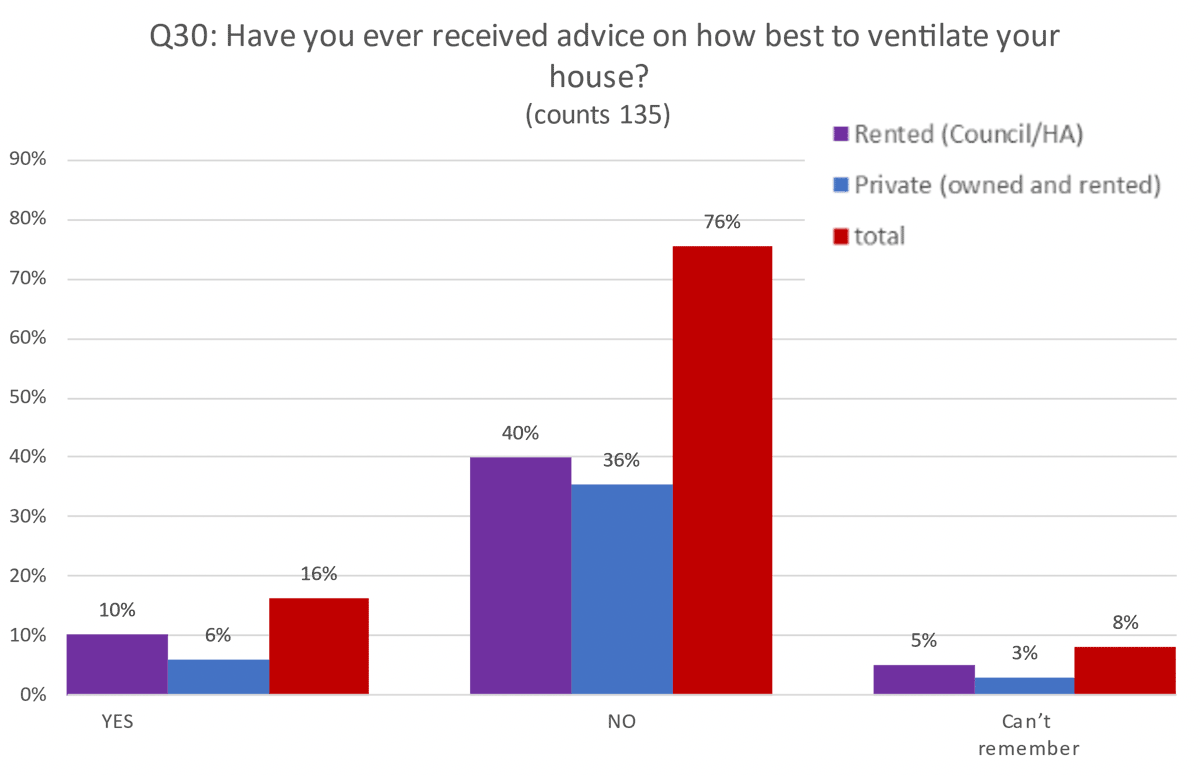
4.30. The increased awareness of trickle ventilation and increased window opening appears to be only marginally influenced by advice provision. In fact, while awareness of ventilation systems has evidently improved, respondents experience a general lack of advice.
4.31. Of the 16% of occupants who had received advice, 52% had received specific instruction on the use of the vents (about 8% of the total). Overall, results show a slight increase in advice on trickle vents compared to the 2014 results. Common to the two surveys is that, of those that had received advice, the information provided was generally relevant.
Carbon Dioxide Monitor
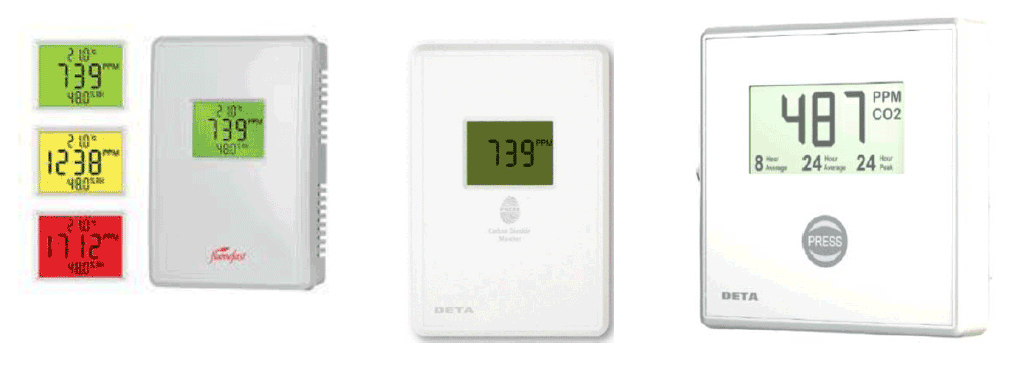
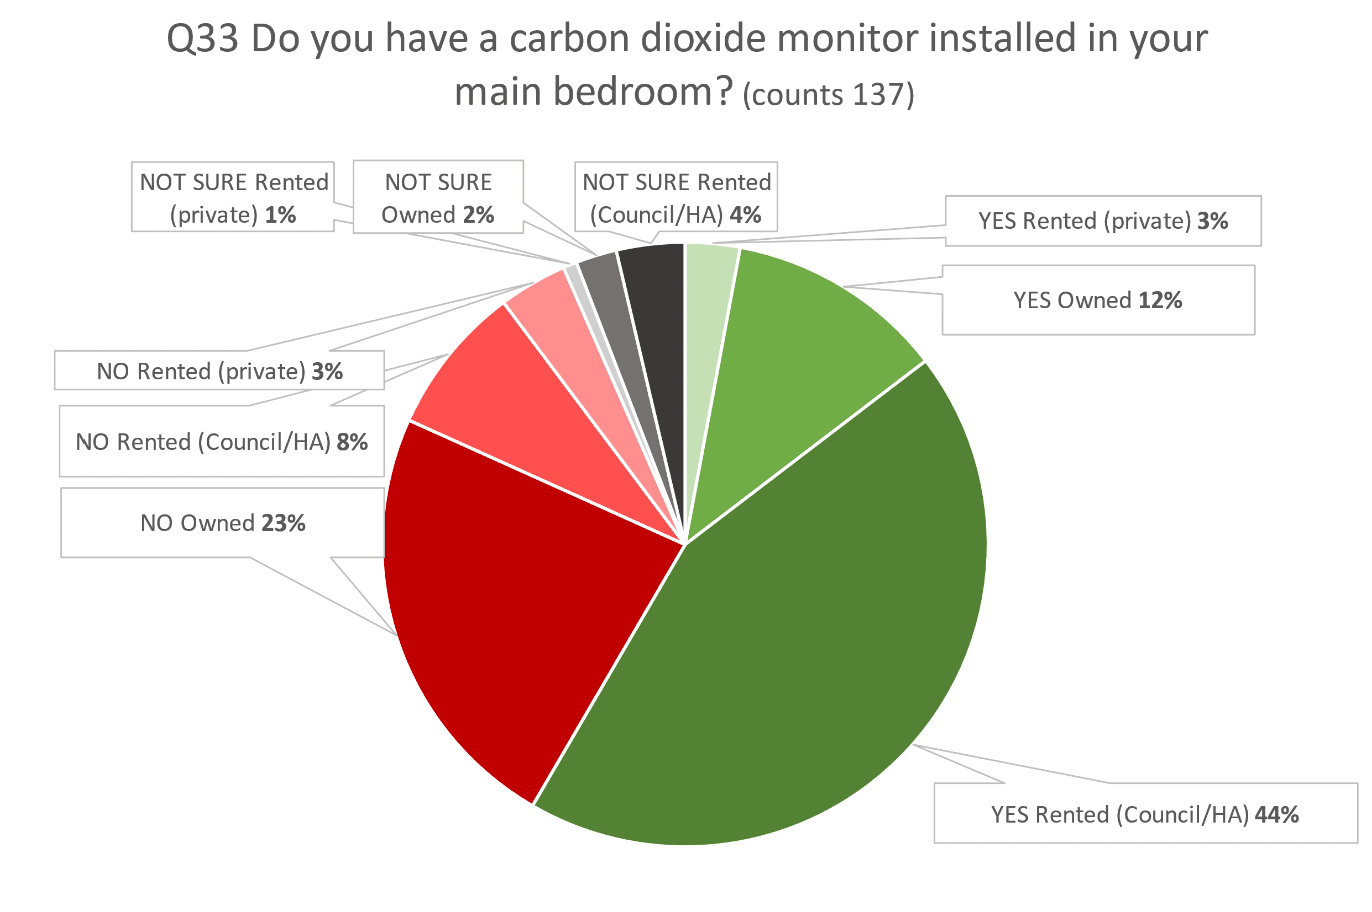
4.32. When shown images of a Carbon Dioxide monitor (figure 4.29) and asked whether respondents have one installed in their bedrooms, 59% said that they have one installed (the majority of these (44%) were in social housing).
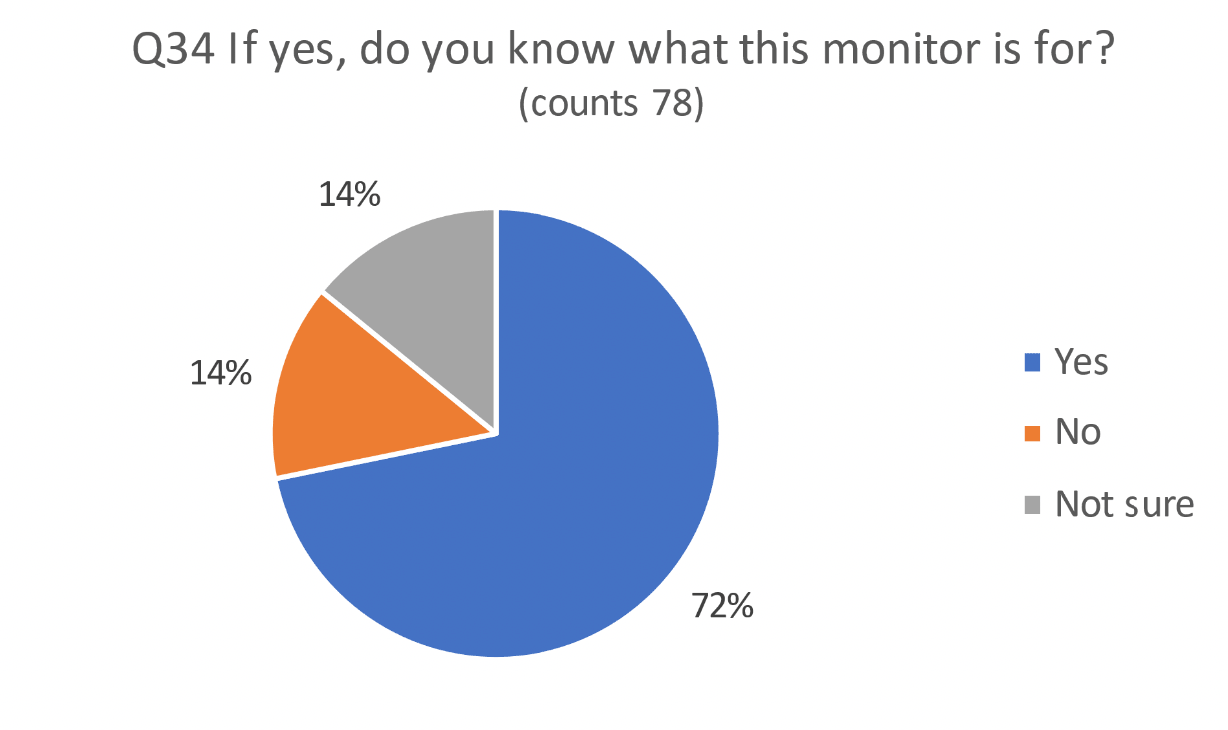
4.33. The majority of respondents of those that stated they had a CO2 monitor installed in their bedroom stated that they knew what a CO2 monitor is for (72%). However, looking at the responses provided when asked "what that advice was", it became clear that nearly half of them didn't know what a CO2 monitor is for. Some of the responses revealed that the CO2 monitor was being confused with detectors for other gasses such as carbon monoxide.
CO2 monitor advice
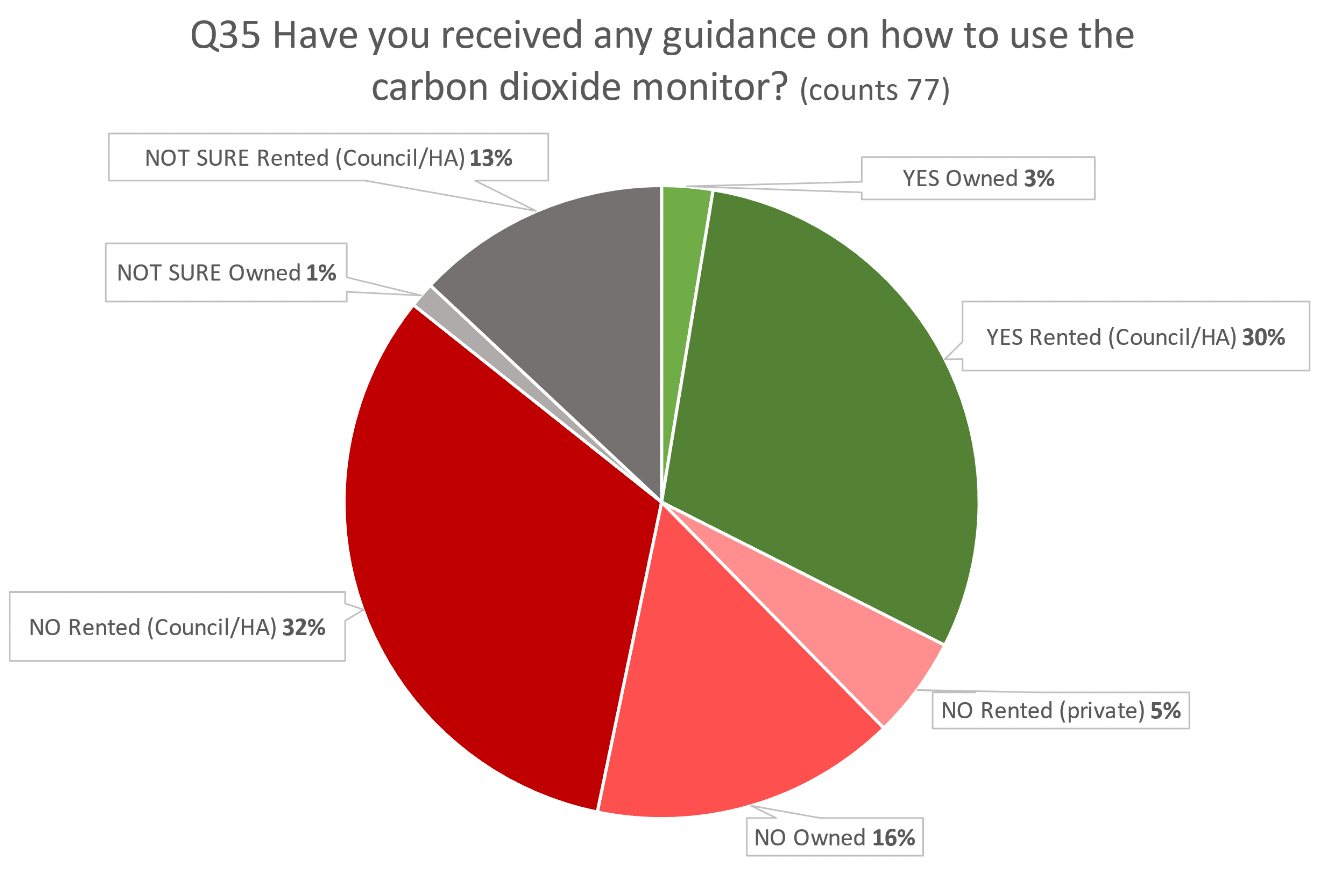
4.34. From the respondents that stated they had a CO2 monitor installed in their bedroom, 30% of respondents stated that they were given advice on how to use the CO2 monitor[6]. This effectively corresponds to 25 people in total. The majority are council or housing association rented properties (in figure 4.23 labeled as "Rented Council/HA).
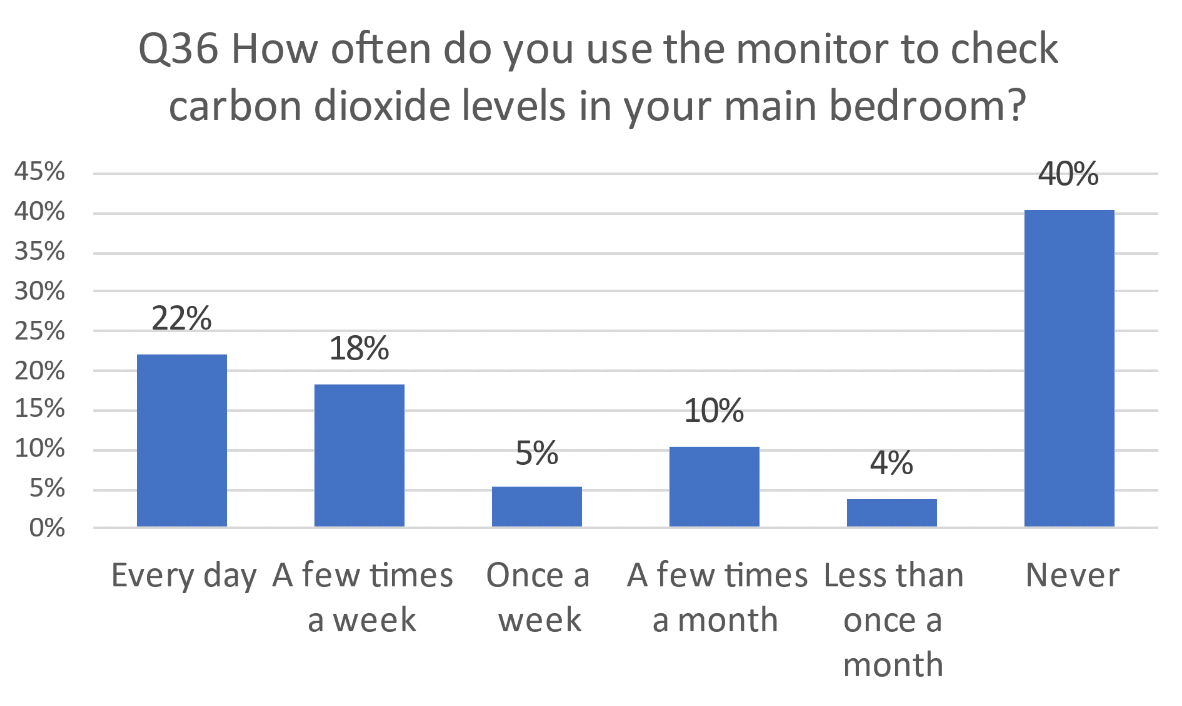
4.35. While 40% of people stated that they 'never' use the CO2 monitor to check carbon dioxide levels, the majority (60%) stated that they use the monitors.
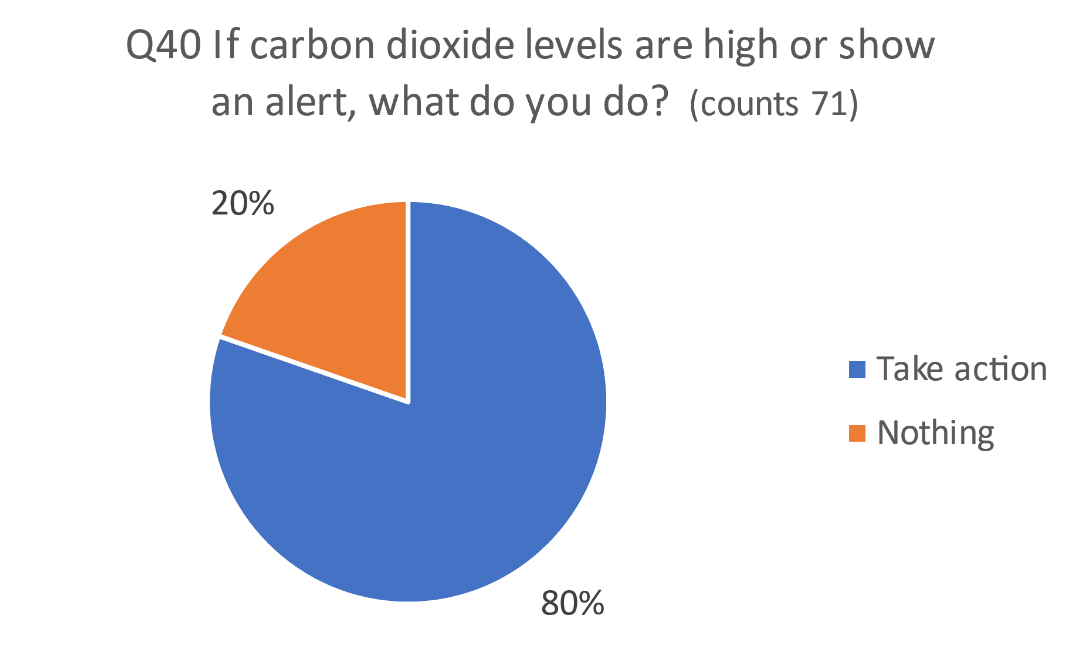
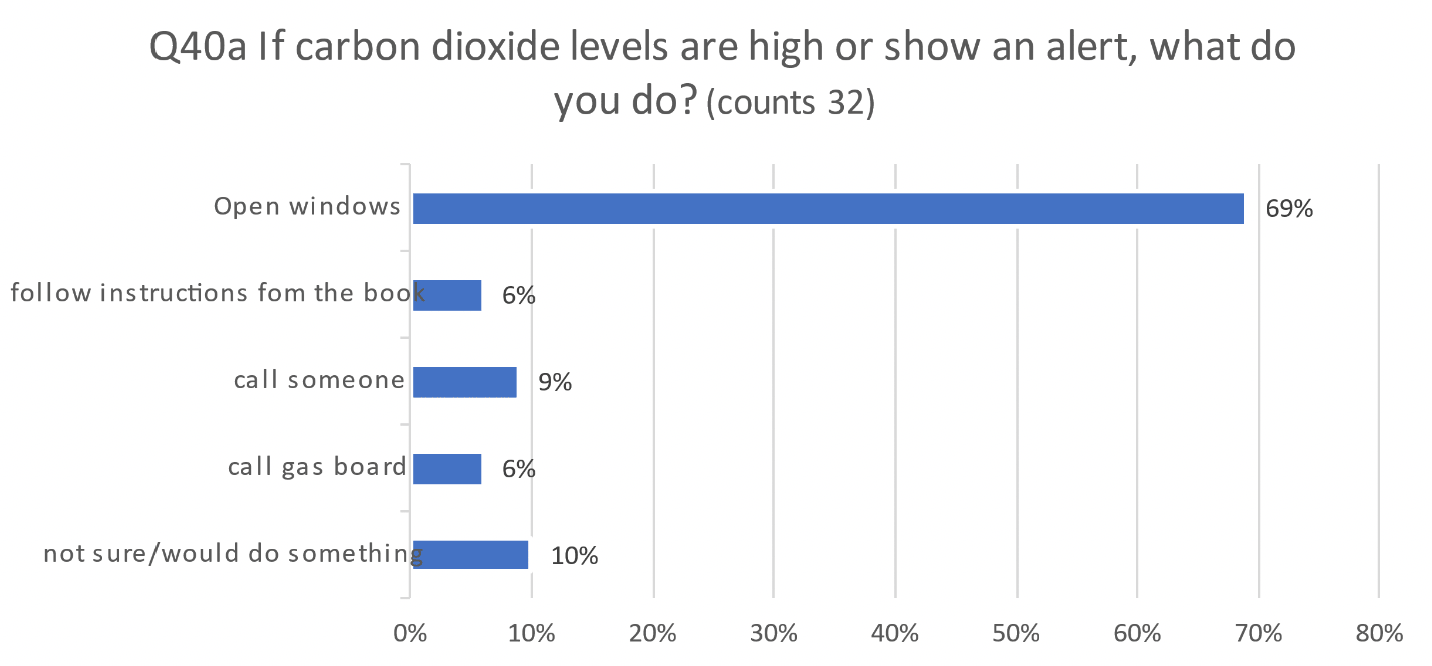
4.36. Of the households with a CO2 monitor, the majority (80%) claimed to take action when carbon dioxide levels are high. For action, the majority open the windows but still a minority misunderstood the purpose of a CO2 monitor. For instance, 6% stated they would call the gas board and 10% were not sure what to do.
4.37. While respondents tend to open the windows when action is required, it is apparent that many respondents were unsure of the effectiveness of such action. Nonetheless, it can be noticed that only one third of those with CO2 monitors find that CO2 monitors have improved indoor air quality or has influenced the way they ventilate their homes. This has been explored in detail in the following paragraphs.
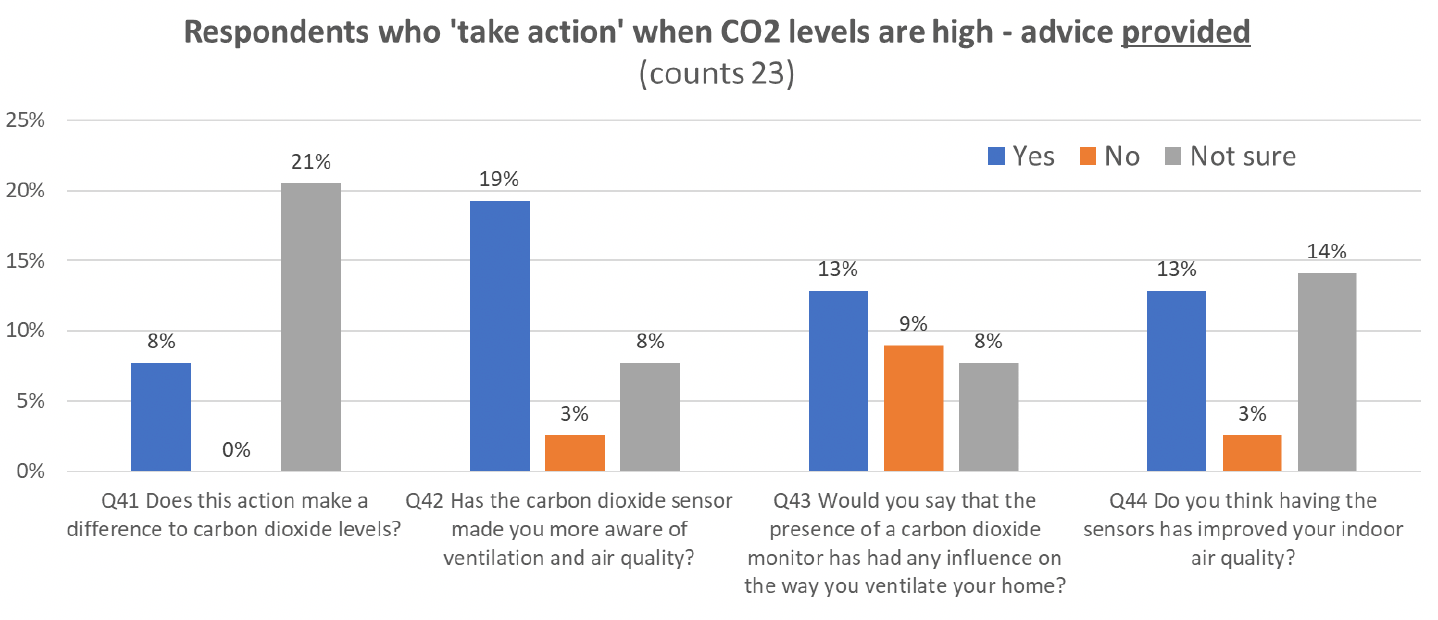
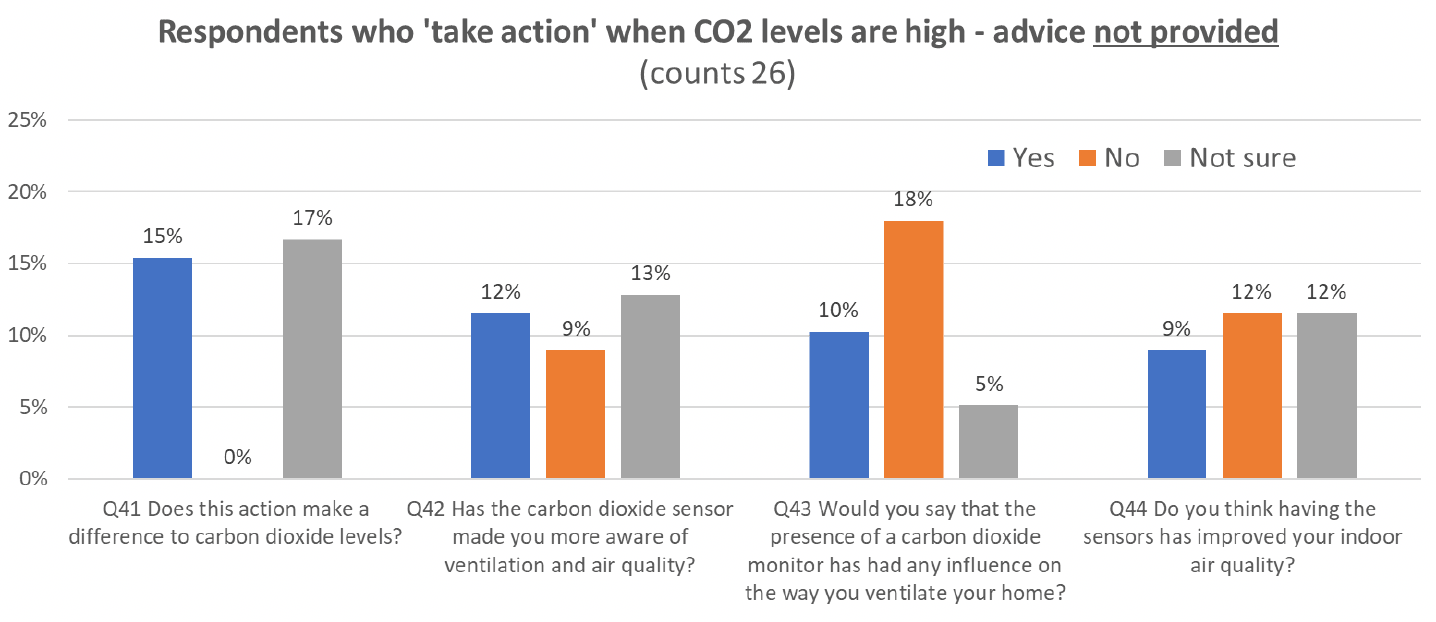
4.38. Of the subset of households who have taken action, figures 4.36 and 4.37 show people who have and who have not had advice respectively.
- Of households that have had advice, 8% reported that taking action make a difference in CO2 levels. In households who have not had advice 15% reported that taking action make a difference in CO2 levels. Interestingly, both groups for the majority claimed to be unsure if taking action makes a difference in CO2 levels.
- Of households that have had advice, 19% reported that the presence of the CO2 monitor made them aware of ventilation and indoor air quality. In households who have not had advice, 12% reported that the CO2 monitor made them aware of ventilation and indoor air quality, albeit 9% of households did not.
- Of households that have had advice, 13% reported that the presence of the CO2 monitor had an influence on the way they ventilate their homes. In households who have not had advice, 10% reported that the presence of the CO2 monitor had an influence on the way they ventilate their homes, albeit 18% have had no influence.
- Of households that have had advice, 13% think that having the CO2 monitor has improved their indoor air quality. In households who have not had advice, 9% reported that having the CO2 monitor has improved their indoor air quality, albeit 12% of households did not.
4.39. Results above demonstrate that CO2 monitors have had some benefit, albeit limited by advice.
Detailed monitoring
4.40. The final question reads "Would you like to be considered to participate in a detailed monitoring study?" Out of 138 responses, 57 expressed their willingness to participate in long term monitoring. Most households of this subgroup have been contacted to initiate long term monitoring, as detailed in the next chapter.
Summary
4.41. The survey provided a modified picture from the survey the 2014 study. Now, occupants are aware of the purpose of trickle vents, and the majority of trickle vents are open all the time. This show that there is a definite change in ventilation systems engagement also for windows. In fact, the trend for window opening has switched from "never opening windows" to "open all the time". This change in behaviour appear not to be driven by improved advice about ventilation which remains low, however the external context for Covid may have change awareness and behaviours of ventilation use.
4.42. Key findings are reported below in bullet points (most important ones first):
- Only 58% of respondents reported the presence of a CO2 monitor installed in bedrooms as requested by the building regulations.
- Of those who have CO2 monitors installed, very few (30%, 12 households) received advice on how to use the CO2 monitor.
- The survey found an increase in reported window opening (27% in living rooms and 36% in bedrooms), when compared to the results of the 2014 survey (around 19% in living rooms and around 12% in bedrooms)
- The survey found a significant increase in reported trickle vent opening (75% in living rooms and 69% in bedrooms), when compared to the results of the 2014 survey (around 25% in living rooms and around 28% in bedrooms)
- The main drivers for ventilation include thermal comfort (26% in both living rooms and bedrooms), indoor air quality or "fresh air" (33% in living rooms and 40% in bedrooms) and energy consumption (26%).
- Of those households who have CO2 monitors installed, 60% stated that they use the monitors and 80% claimed to take action when CO2 levels are high. For action, the majority open the windows but still a minority misunderstood the purpose of a CO2 monitor.
- Of those households who take action when CO2 levels are high, the majority claimed to be unsure if taking action makes a difference in CO2 levels which shows that CO2 monitor advise as well as ventilation provision is limited. There were some slight differences in CO2 monitor perception among groups who have had advise from those who have not.
Contact
Email: buildingstandards@gov.scot
There is a problem
Thanks for your feedback