Councillors' remuneration and expenses: recommendations
Scottish Local Authorities Remuneration Committee (SLARC) was reconvened in April 2023 to undertake an independent review of councillor remuneration, having last reported in 2011.
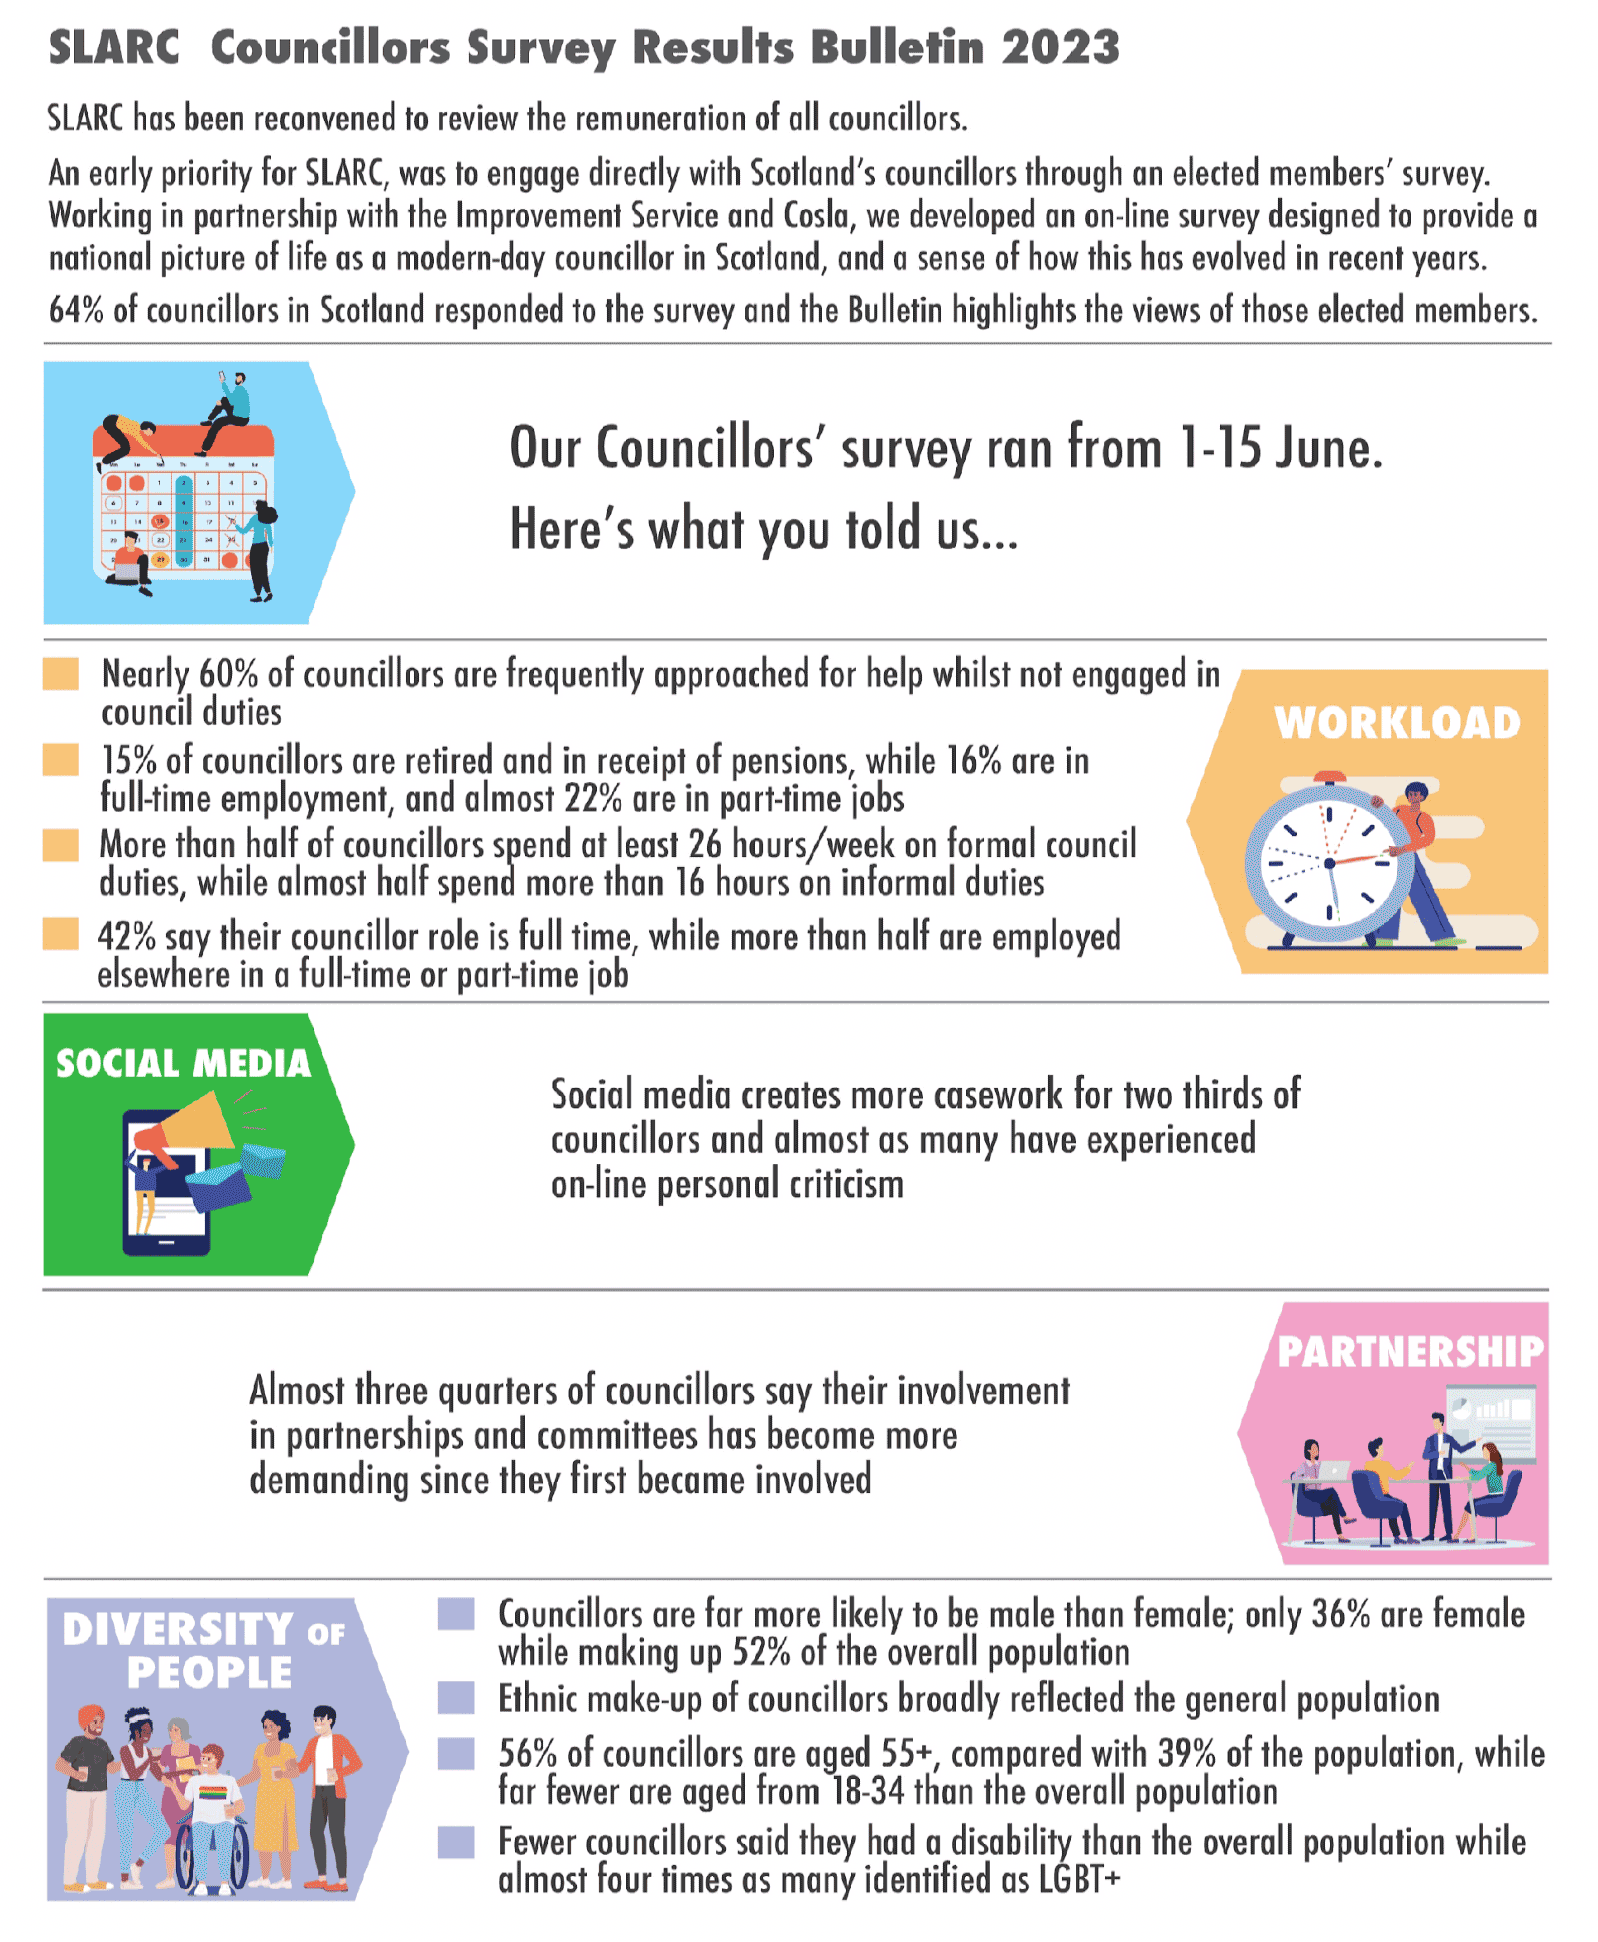
Appendix 2: SLARC Councillor Survey Results Bulletin 2023
Graphic text below:
SLARC Councillor Survey Results Bulletin 2023
SLARC has been reconvened to review the remuneration of all councillors.
An early priority for SLARC, was to engage directly with Scotland’s councillors through an elected members’ survey. Working in partnership with the Improvement Service and COSLA, we developed an online survey designed to provide a national picture of life as a modern-day councillor in Scotland and a sense of how this has evolved in recent years. 64% of councillors responded to the survey and Bulletin highlights the views of those elected members.
Our Councillor survey ran from 1-15 June and here is what you told us.
Workload
- Nearly 60% of councillors are frequently approached for help whilst not engaged in council duties.
- 15% of councillors are retired and in receipt of pensions, while 16% are in full time employment and almost 22% are in part time jobs.
- More than half of councillors spend at least 26 hours per week on formal council duties whilst almost half spend more than 16 hours per week on informal duties.
- 42% say their councillor role is full time, while more than half are employed elsewhere in a full time or part time job.
Social Media
- Social media creates more casework for more than two thirds of councillors and almost as many have experienced online personal criticism.
Partnership
- Almost three quarters of councillors say their involvement in partnerships and committees have become more demanding since they first became involved.
Diversity of people
- Councillors are far more likely to be male than female; only 36% are female while making up 52% of the population overall.
- Ethnic make up of councillors broadly reflected the general population.
- 56% of councillors are aged 55 or over, compared with 39% of the population, while far few are aged from 18-34 than the overall population.
- Fewer councillors said they had a disability than the overall population while almost four times as many identified as LGBT+.
Contact
There is a problem
Thanks for your feedback