Pesticide usage in Scotland: Grassland and Fodder Crops 2021
This publication presents information from a survey of pesticide use on grassland and fodder crops in Scotland during 2021.
This document is part of a collection
Appendix 6: Integrated pest management
It is a requirement of the retained EU law Directive 2009/128/EC of the European Parliament and of the Council(15) (equivalent to the EU Sustainable use of Pesticides Directive 2009/128/EC) that member states should promote low pesticide input pest management, in particular Integrated Pest Management (IPM). The Directive defines IPM as follows "'integrated pest management' means careful consideration of all available plant protection methods and subsequent integration of appropriate measures that discourage the development of populations of harmful organisms and keep the use of plant protection products and other forms of intervention to levels that are economically and ecologically justified and reduce or minimise risks to human health and the environment. 'Integrated pest management' emphasises the growth of a healthy crop with the least possible disruption to agro-ecosystems and encourages natural pest control mechanisms."
Information about the uptake of IPM measures by Scottish growers was collected alongside the 2021 grass and fodder crop pesticide usage survey. IPM data have previously been collected and published for all crop groups in our cycle of pesticide usage surveys (vegetable crops 2015 & 2019, protected edible crops 2015 & 2019, arable crops 2020 & 2016, soft fruit crops 2020 & 2016 and fodder crops 2017). Our intention is to monitor IPM uptake in each crop sector every four years. This 2021 IPM survey represents the second in the series of surveys of IPM measures on fodder crops, allowing the adoption of IPM techniques to be monitored. These datasets will be used as an indicator of the success of Scottish Government funded IPM research, knowledge transfer and promotion activities.
It should be noted that in the main pesticide usage survey two samples are drawn, one based on holdings cultivating fodder crops (from which data are collected by personal interview) and another of holdings cultivating grass (from which data are collected by postal form, Appendix 4). These dual samples ensure that both fodder crops and Scotland's large grass area are adequately represented in the sample. The IPM data presented here were collected only from the fodder proportion of the sample. This reflects that this data collection is more suited to personal interview than postal return and it ensures methodological consistency with previous IPM surveys. The fodder holdings surveyed also cultivated grass and the survey covers the IPM measures implemented on all grass and fodder production on those farms.
Unlike the other statistics in this report, the figures reported in this section are not raised to produce national estimates but represent only the responses of those surveyed. The IPM sample, whilst smaller than that sampled for the pesticide usage survey, provides a good representation of Scottish regions and farm size groups.
Pearson chi-square tests were used to assess statistical evidence for changes, with permutation tests used when expected values were five or less. When comparing between 2017 and 2021, any evidence of a statistical change in the proportion of growers reporting under a category is indicated by a p-value. Any other notable differences that might indicate a direction of travel are also recorded in the text. If no comparison is made, then the responses recorded are similar between 2017 and 2021.
In total IPM data was collected from 158 growers representing 163 holdings and collectively growing 39,380 ha of crops (2,189 ha of fodder, 22,279 ha of grass and 14,912 ha of rough grazing); a 33 per cent increase in grower response rate from the previous survey in 2017. This sample represented thirteen per cent of Scotland's 2021 census fodder crop area (16,736 ha), 1.7 per cent of the grass area (1,296,900 ha) and 0.5 per cent of the rough grazing area (3,072,535 ha). Of these growers, 24 per cent had an IPM plan (13 per cent completed their own IPM plan and 11 per cent had a plan completed by their agronomist), 72 per cent did not have an IPM plan and four per cent were unsure whether a plan had been completed (Figure 38). There was very strong evidence that the proportion of growers completing an IPM plan increased, from five per cent in the 2017 survey, to 26 per cent in 2021, excluding those who were unsure whether a plan had been completed (p-value ≤ 0.001). Although more plans were completed in 2021 compared to 2017, there was no evidence of change in the proportion of plans completed by growers or agronomists (p-value > 0.05).
Using an IPM plan helps growers make the best possible, and most sustainable, use of all available methods for pest control.
Since the 2017 survey, the requirement to complete an IPM plan has been added to the most widely used UK farm assurance schemes; for example, farmers certified with Red Tractor are required to complete the NFU/VI IPM plan. Scottish farm businesses certified by Scottish Quality Crops (SQC Ltd) must complete an annual IPM plan, a biodiversity plan and a soil testing plan(18).
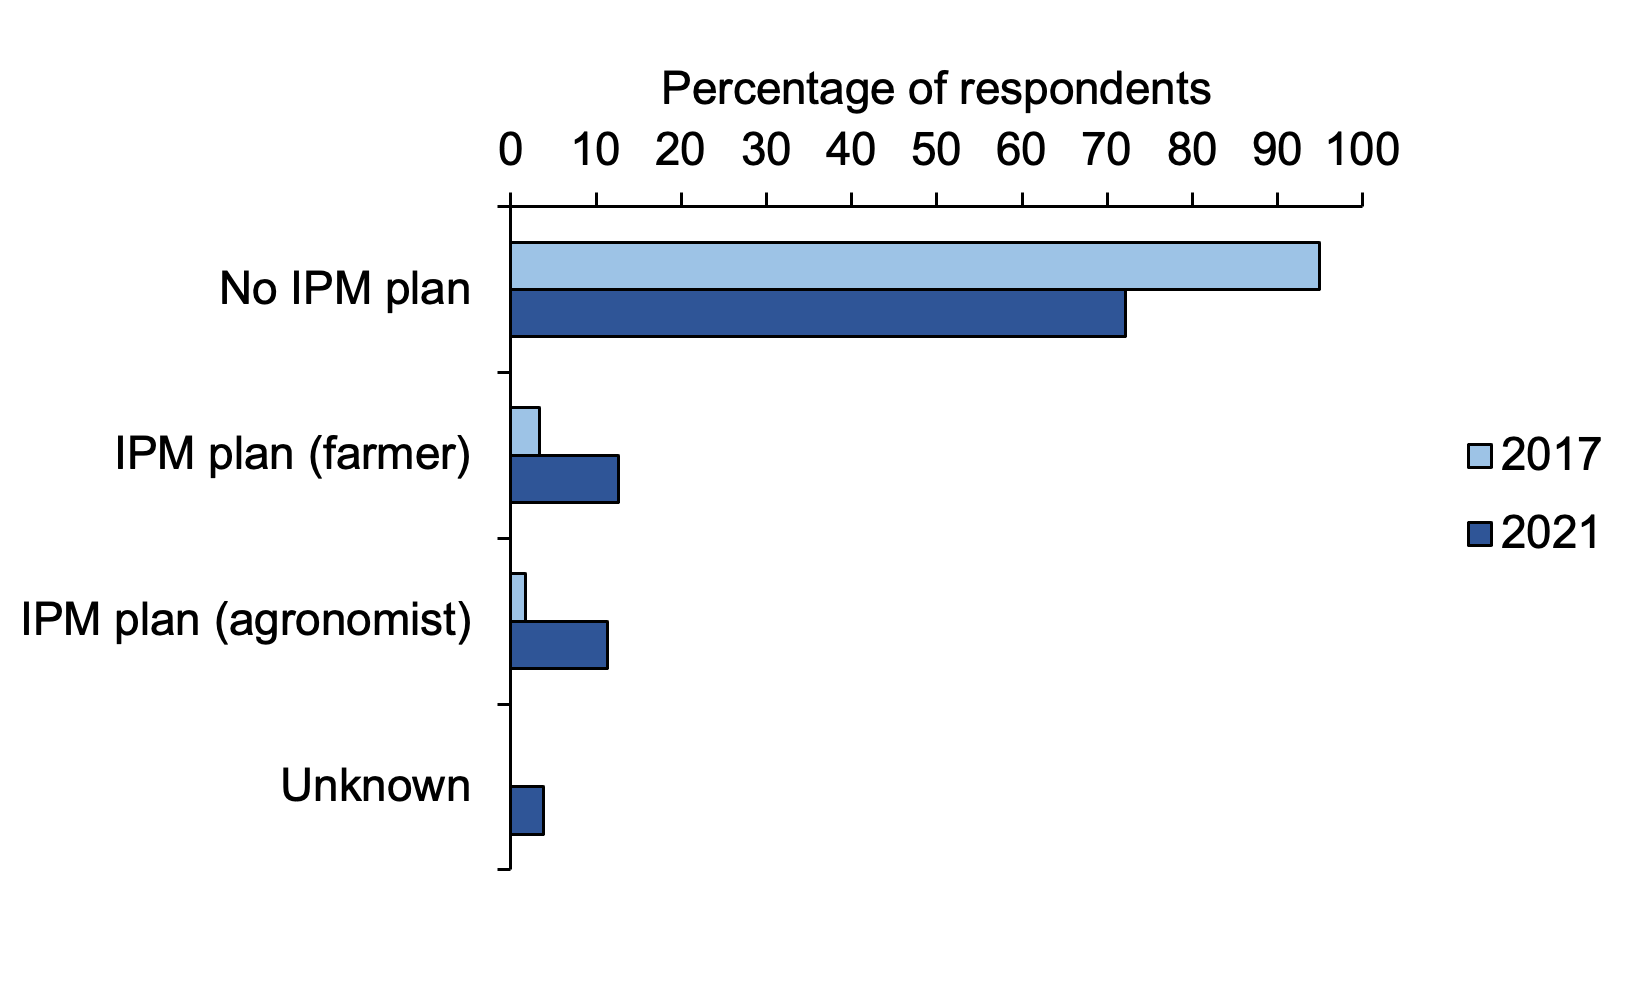
Note: there was very strong evidence for an increase in the proportion of growers completing an IPM plan (p-value ≤ 0.001). In 2021, four percent of growers sampled were unsure if a plan had been completed or not.
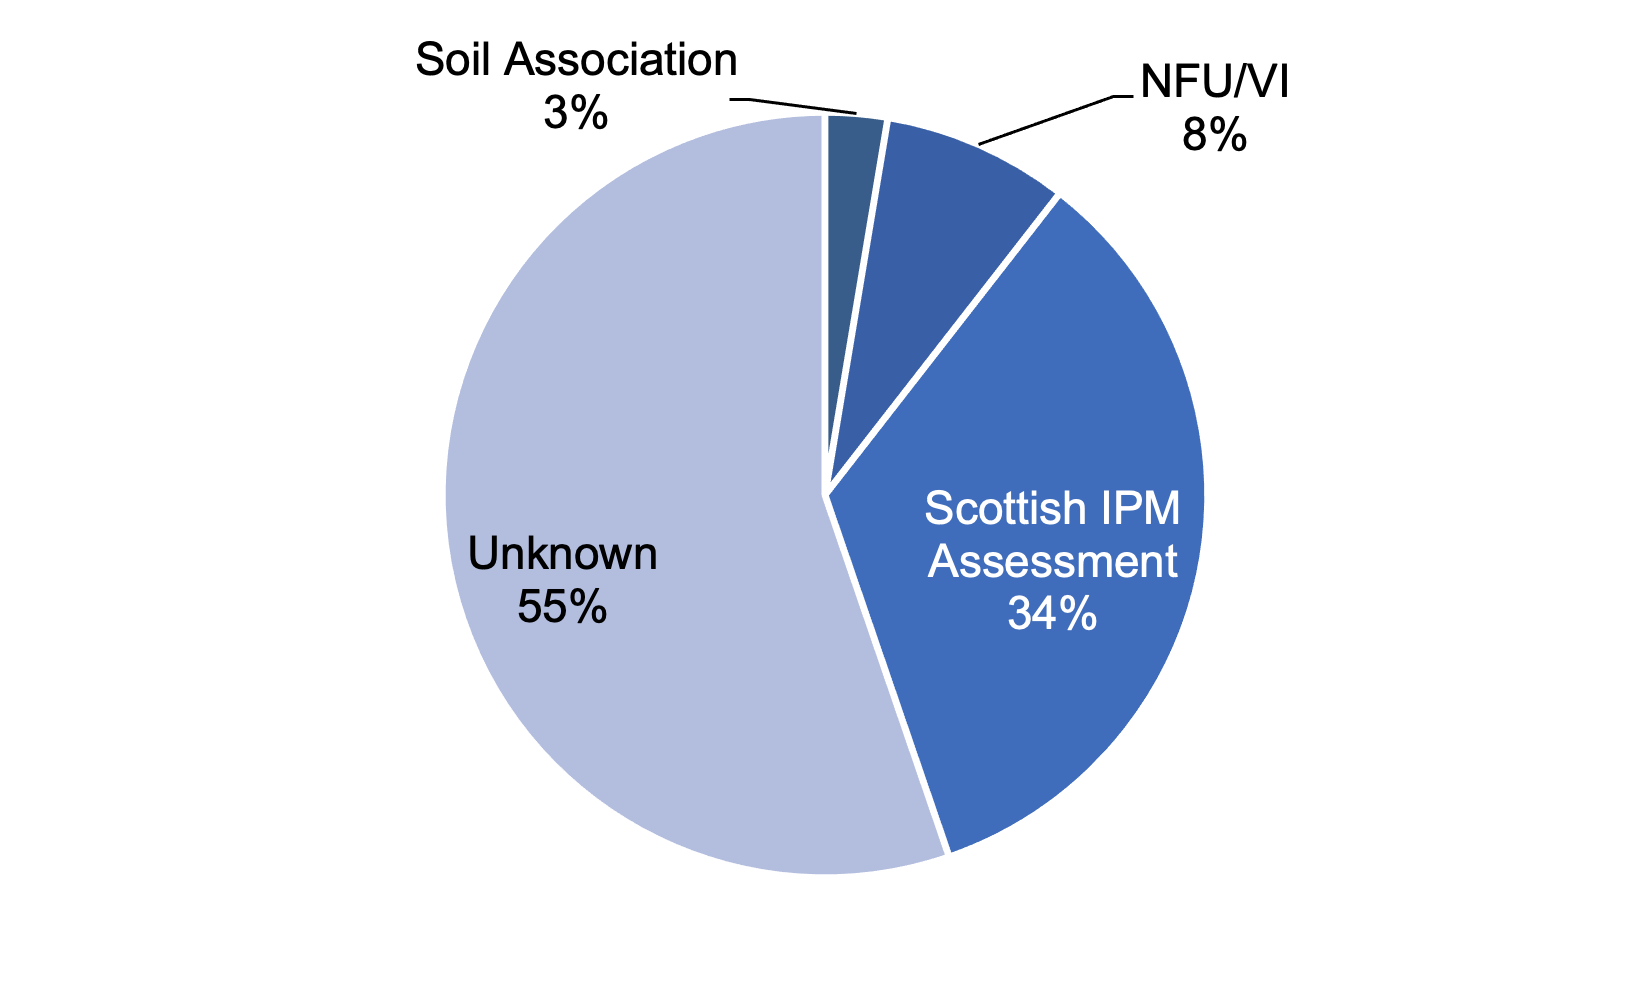
Of those growers who had an IPM plan in 2021, either completed by themselves or by their agronomist, 34 per cent used the Scottish IPM assessment plan, eight per cent used the NFU/VI plan, three per cent used the Soil Association plan and 55 per cent were unsure which plan was completed (Figure 42).
Farmers were asked about their IPM activities in relation to three categories; risk management, pest monitoring and pest control. Information was collected about all activities each grower conducted in relation to these categories and the responses are reported in the following sections. The term 'pest' is used throughout to denote diseases, weeds and invertebrate pests.
Risk management
IPM programmes aim to prevent or reduce the risk of pests becoming a threat by minimising the likelihood of damage occurring that will require subsequent control. Table 30 presents an overview of the risk management measures adopted by those growers surveyed and the statistical evidence for change between 2017 and 2021.
In 2021, all growers sampled reported that they implemented at least one IPM risk management activity compared with 97 per cent in 2017. There was strong, or very strong, evidence for an increase in the proportion of growers reporting the implementation of three risk management activities between 2017 and 2021.
There was very strong evidence for an increase in the proportion of growers reporting the use of catch and cover cropping (p-value ≤ 0.001), and strong evidence for an increase in the proportion of growers reporting the use of varietal or seed choice to reduce pest risk (p-value ≤ 0.01) and through protection or enhancement of beneficial organism populations (p-value ≤ 0.01) (Table 30).
| Risk management activity | % positive response | % change | p-value | Evidence | |
|---|---|---|---|---|---|
| 2021 | 2017 | ||||
| Crop rotation | 78 | 65 | 13 | ≤ 0.05 | Some |
| Soil testing | 87 | 84 | 3 | > 0.05 | None |
| Cultivation of seed bed to reduce pest risk | 89 | 82 | 7 | > 0.05 | None |
| Cultivation at sowing to reduce pest risk | 37 | 48 | -11 | > 0.05 | None |
| Varietal or seed choice to reduce pest risk | 69 | 51 | 18 | ≤ 0.01 | Strong |
| Catch and cover cropping | 27 | 9 | 17 | ≤ 0.001 | Very strong |
| Protection or enhancement of beneficial organism populations | 73 | 57 | 16 | ≤ 0.01 | Strong |
| Cleaning machinery between fields | 61 | [x] | [z] | [z] | [z] |
| Any risk management activity | 100 | 97 | 3 | > 0.05 | None |
Note: in 2017 growers were not directly asked about cleaning machinery between fields. % change is absolute change. Some shorthand is used in this table: [x] = not available, [z] = not applicable.
There was some evidence for an increase in the proportion of growers implementing crop rotation to reduce risk of pest damage (78 per cent in 2021 and 65 per cent in 2017) (p-value ≤ 0.05). Rotation breaks the link between pathogen and host, reducing pest population build-up. It can also improve soil fertility and structure, and consequently crop vigour.
Overall, there was no evidence of change in the proportion of growers performing any soil testing. Most testing encountered in 2021 was for pH or lime (85 per cent in 2021 compared with 19 per cent in 2017) (Figure 43). This was the largest change observed from 2017, however, growers were not directly asked about testing pH in 2017, therefore these responses are underestimated in 2017. The proportion of growers testing for soil nutrients decreased from 76 per cent in 2017 to 59 per cent in 2021. Conducting a pH/lime test and testing for nutrients can inform growers' decisions on the inputs required and crop choice for that field to ensure crops are healthy and less susceptible to pest pressure. There was also an increase in the proportion of growers testing for soil-borne disease (eight per cent in 2021 compared with one per cent in 2017). Other soil tests used can be seen in Figure 43.
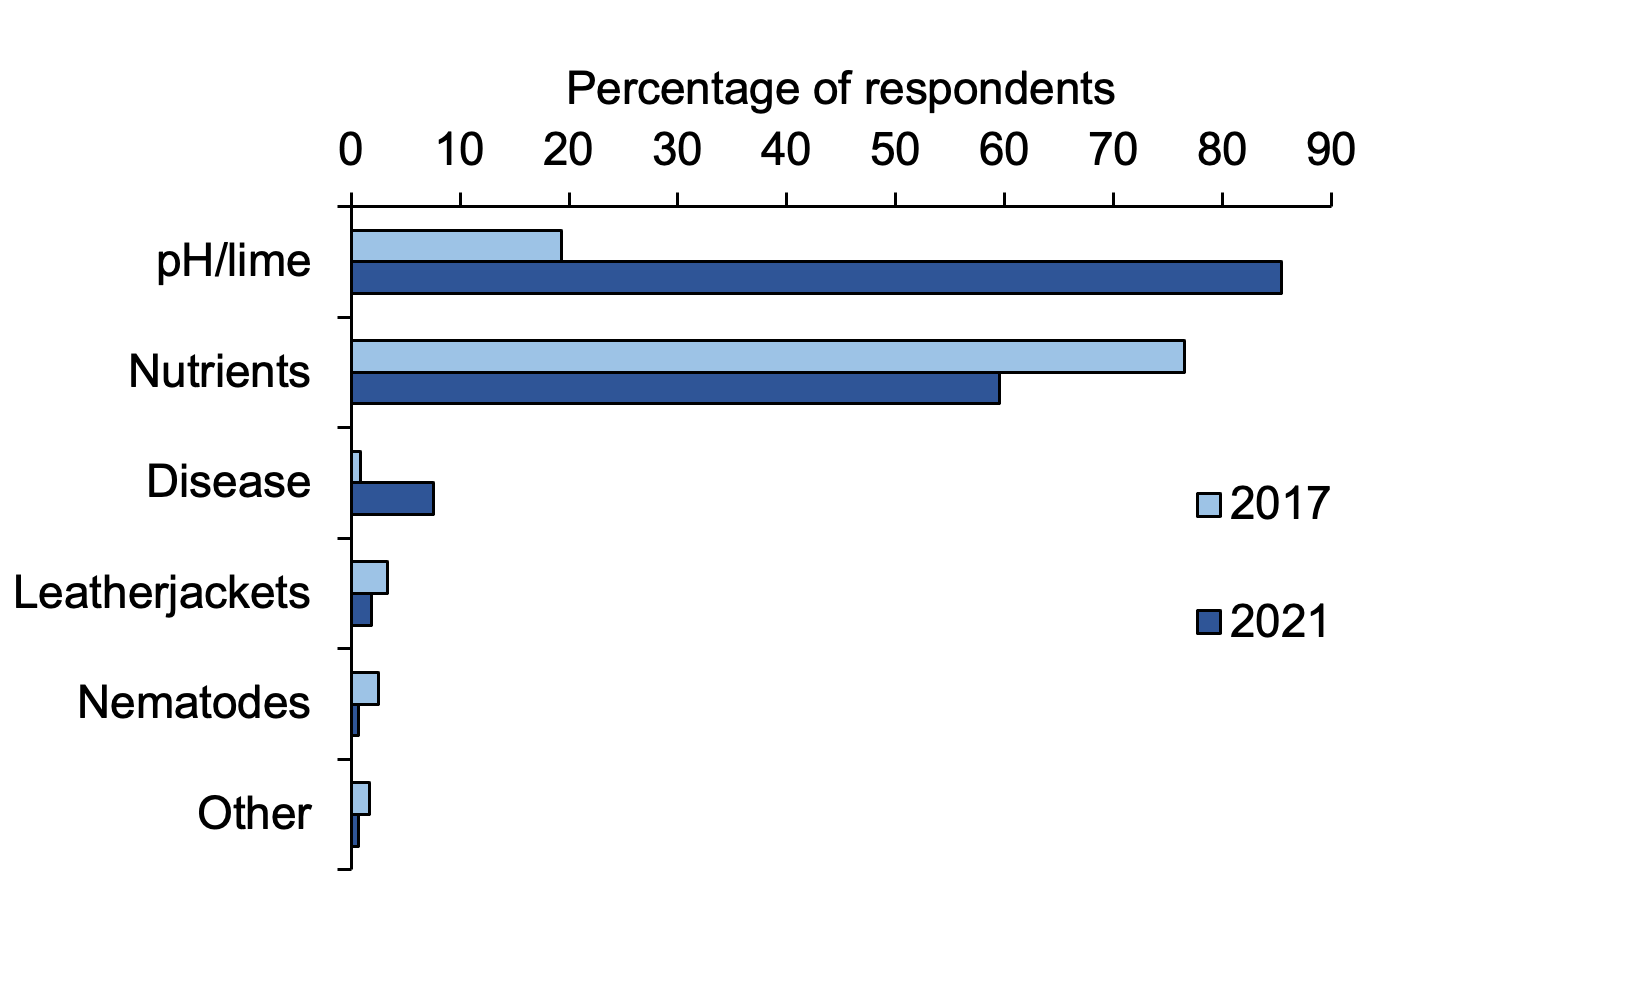
Note: in 2017 growers were not directly asked about testing for pH or lime, therefore the 2017 data may be underestimated.
Other in 2021 included a carbon test.
Other in 2017 included testing for wheat bulb fly, worm testing and soil mapping.
There was no evidence of change in the proportion of growers using cultivation of the seed bed prior to sowing to reduce pest risk in 2021 (p-value > 0.05). There was an increase in the percentage of respondents responding positively to all questions on the cultivation of seed bed in 2021 from 2017 (see Figure 44 for a list of all activities growers were asked about). The largest change was reported for the number of growers increasing soil organic matter (78 per cent in 2021 compared with 61 per cent in 2017). Similarly, the number of growers who consider pest management when planning crop nutrition and planning irrigation/drainage increased (15 and 13 per cent respectively in 2021 compared to none in 2017, however growers were only asked if they consider pest management when planning irrigation/drainage in 2017 and not crop nutrition). Considering pest management when planning crop nutrition can also improve the seed bed and ensure that soil fertility and pH is optimised for the crop. The use of non-inversion techniques increased in 2021 with 18 per cent using direct drilling compared to 10 per cent in 2017. Non-inversion techniques can preserve soil moisture and organic matter and reduce compaction and erosion. There is also evidence that it is beneficial for populations of earth worms and predatory ground beetles. Thirty-one per cent employed rotational ploughing between periods of non-inversion cultivation (19 per cent in 2017); rotational ploughing can reduce the weed burden and is also used to incorporate organic matter. Other seed bed cultivation methods can be seen in Figure 44.
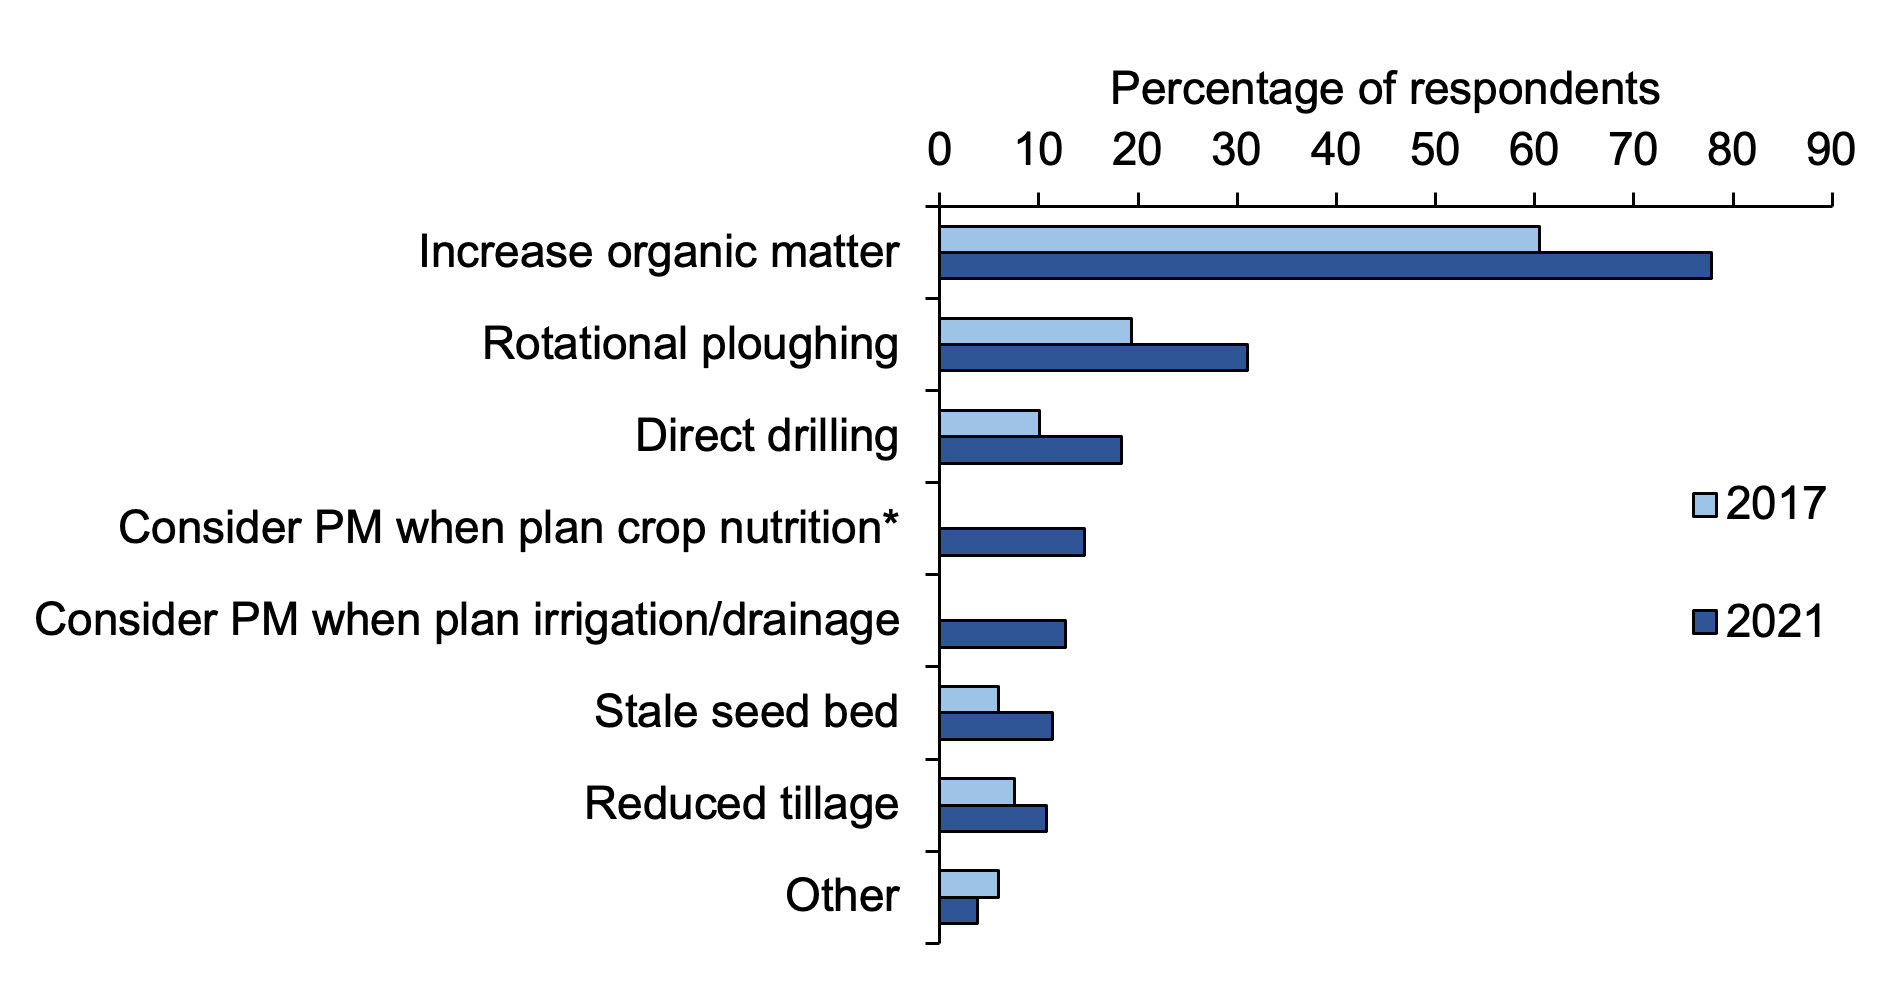
Note: in 2021, other included using mechanical methods for leatherjacket (rolling) control.
In 2017, other included using mechanical methods for slug (harrowing and rolling) and leatherjacket (rolling) control and liming soil.
*In 2017, consider pest management (PM) when planning crop nutrition was not asked.
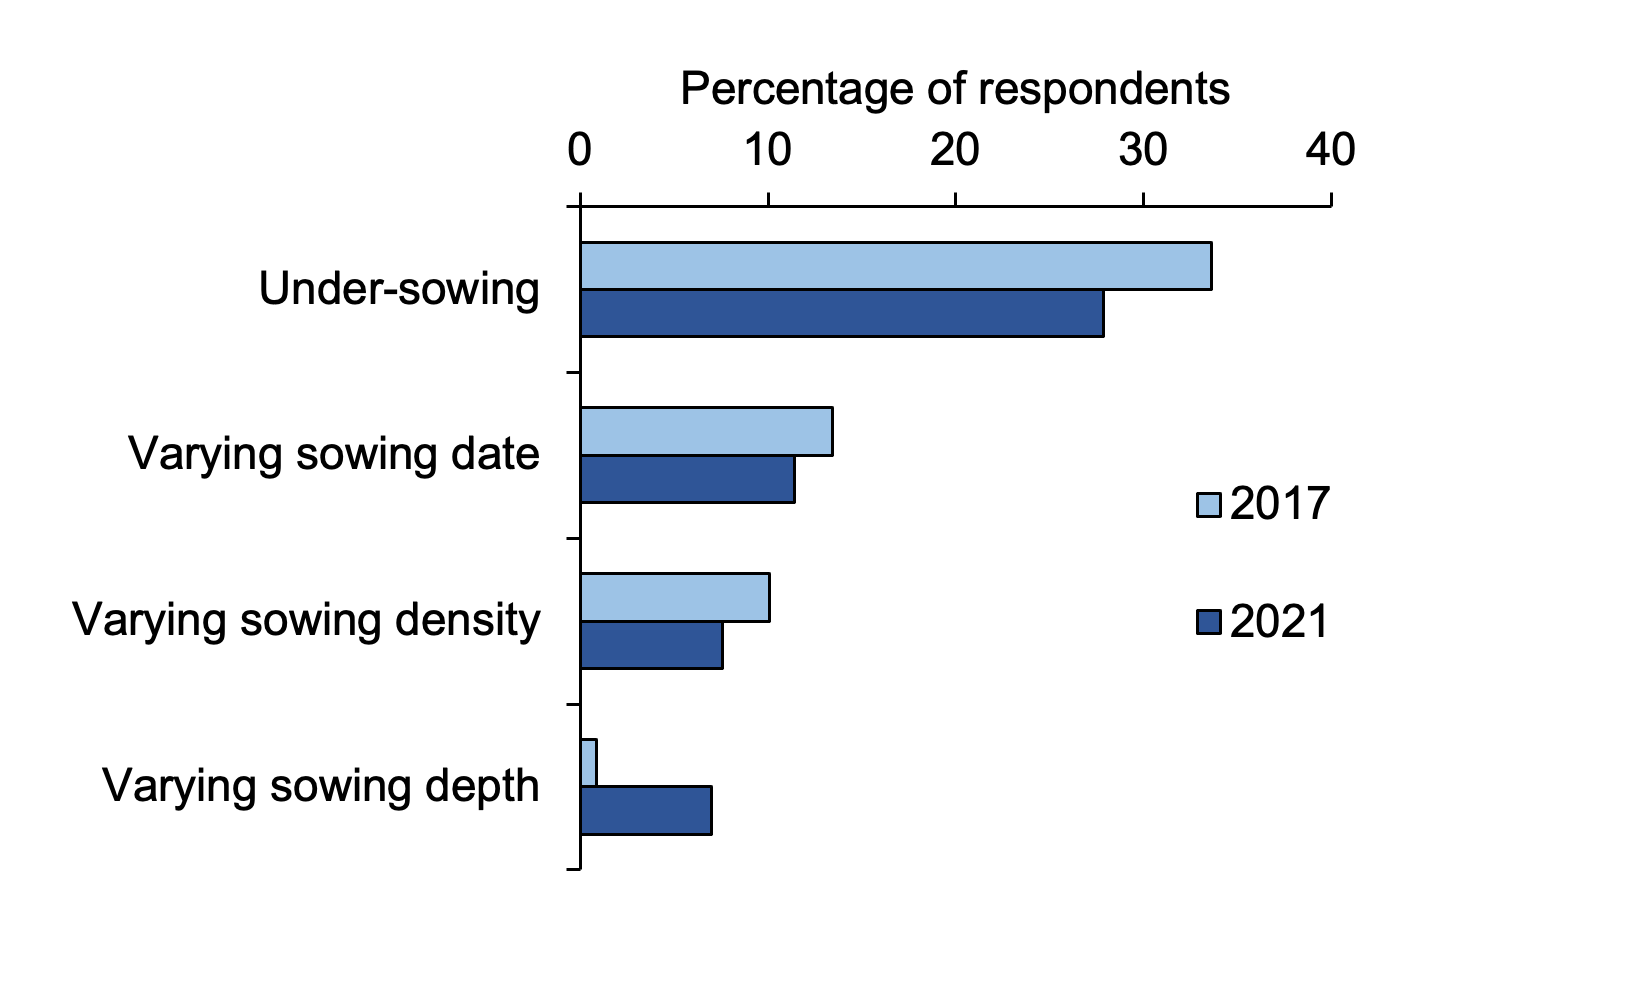
There was no evidence the proportion of growers using cultivations at sowing to reduce pest risk from 2017 (37 per cent in 2021 and 48 per cent in 2017) (p-value > 0.05). This was the only risk management activity that was reported lower than in 2017. Growers' ability to vary sowing date, which will also impact sowing density, is influenced by seasonal factors. The proportion of growers under-sowing crops decreased six per cent (28 per cent in 2021 compared with 34 per cent in 2017), while the number of growers who reported varying sowing depth increased six per cent (seven per cent in 2021 compared to one per cent in 2017) (Figure 45). Growers cited varying sowing depth to reduce seed loss to crows and geese.
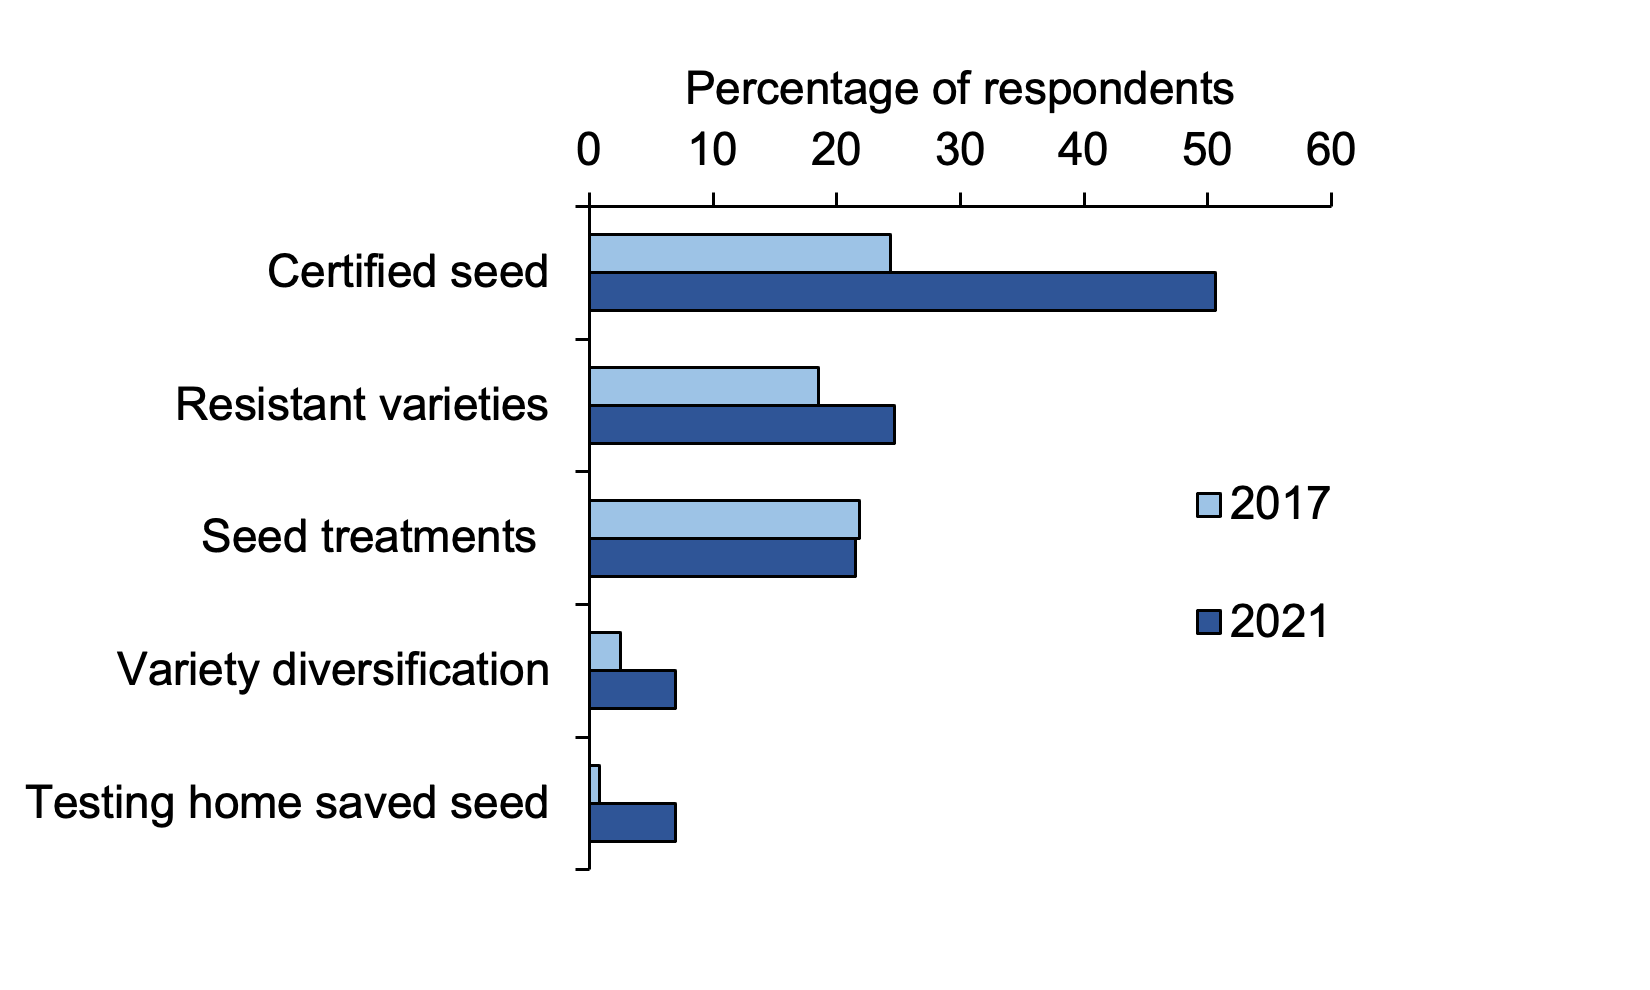
There was strong evidence the proportion of growers considering the varietal or seed choice to reduce pest risk increased from 2017 (69 per cent in 2021 compared with 51 per cent in 2017) (p-value ≤ 0.01). The largest change was reported for the number of growers choosing to use certified seed (51 per cent in 2021 compared with 24 per cent in 2017), and there was an increase in the number of growers testing home saved seed (seven per cent in 2021 compared with one per cent in 2017) (Figure 46). These actions ensure seed meets the required quality standards and is pathogen free. Although the same proportion of growers used seed treatments in 2021 as 2017 (22 per cent), the type of seed treatment applied was different. In 2017, all seed treatments were pesticides; in contrast, in 2021, 76 per cent of seed treatments used were pesticides, nine per cent were fertilisers (including nutrients and biostimulants) and for the remaining 15 per cent, growers were unsure what seed treatment was applied. Other variety and seed choice methods used can be seen in Figure 46.
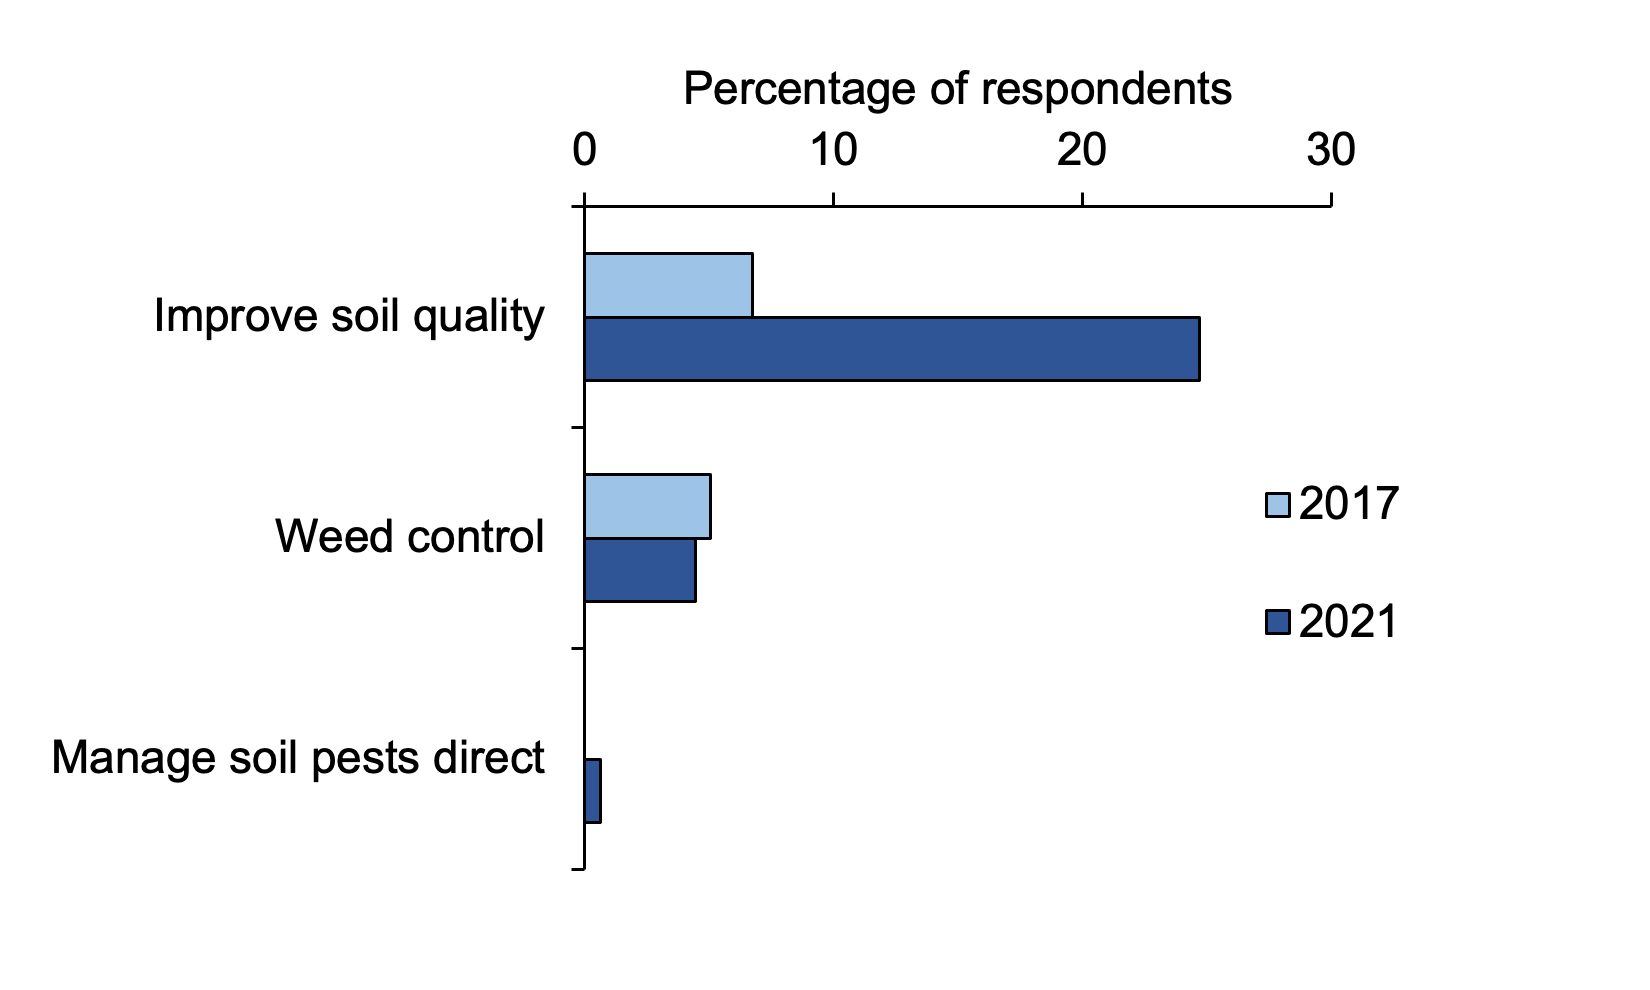
There was very strong evidence for an increase in the proportion of positive responses to using catch and cover crops (27 per cent in 2021 compared with nine per cent in 2017) (p-value ≤ 0.001). In 2021, 25 per cent of respondents reported that they used catch and cover crops to improve soil quality compared to seven per cent in 2017. Growers used a variety of catch and cover crops to improve soil quality, including mixes containing brassicas and cereals or nitrogen fixing crops including clover and peas. Catch and cover crops were often ploughed in as a green manure. Some cover crops were also reported to be used to control weeds or for managing soil pests directly (Figure 47).
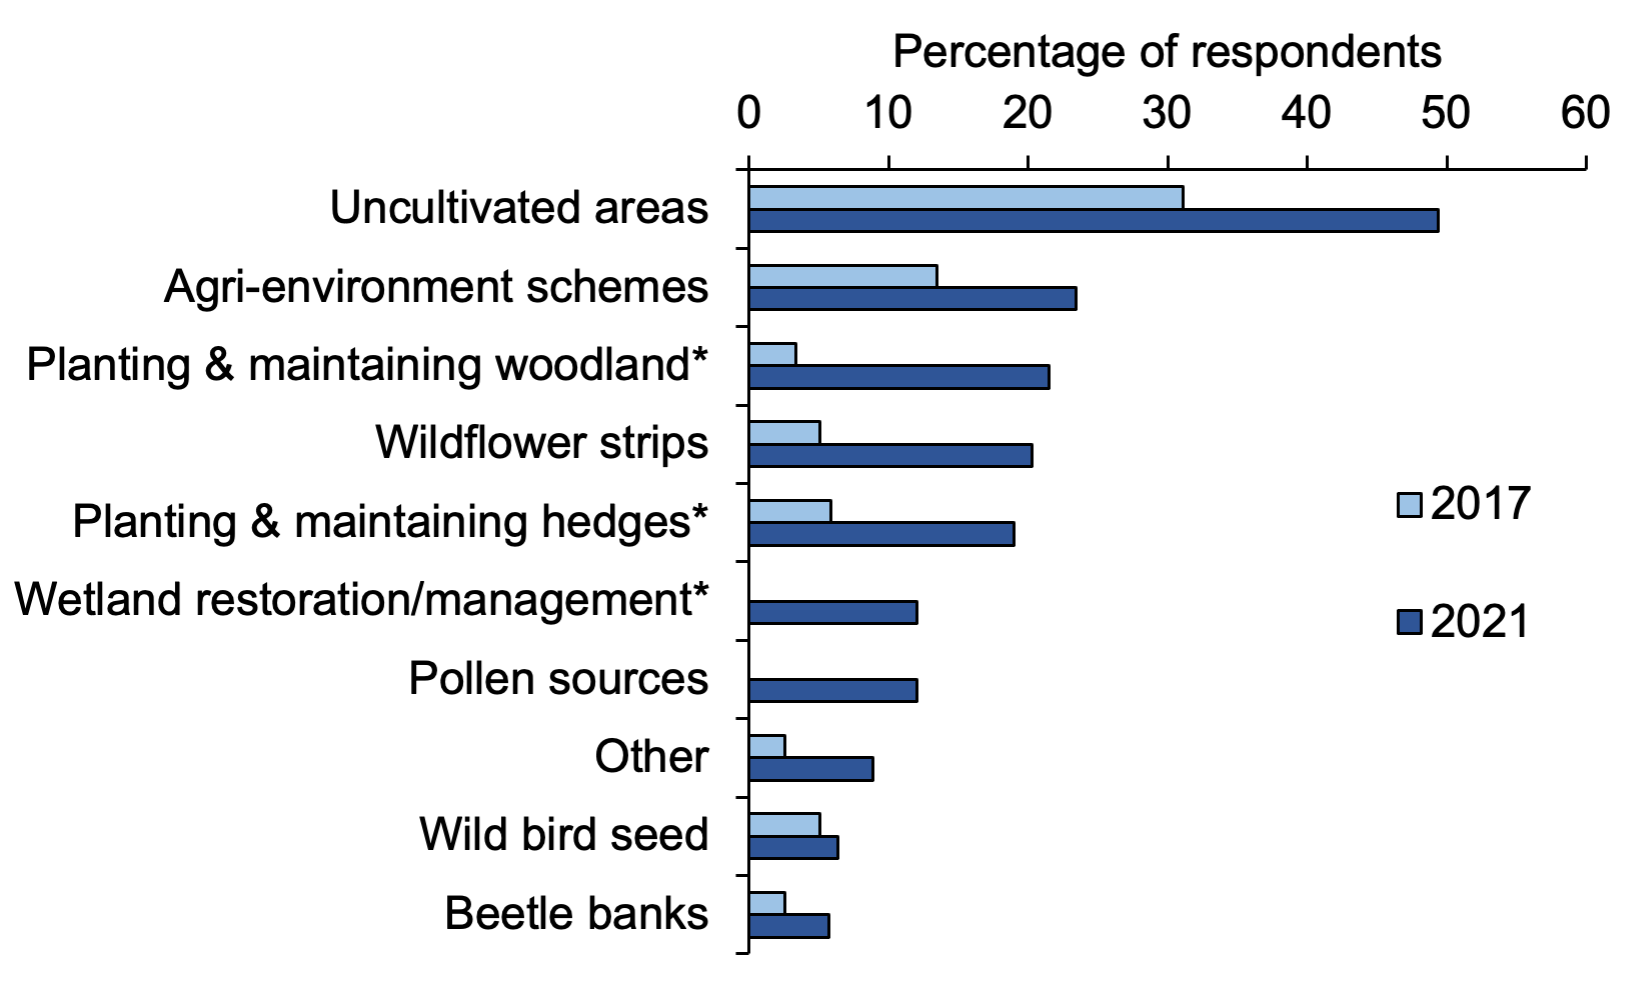
There was strong evidence the proportion of growers protecting or enhancing beneficial organism populations to reduce pest risk increased from 2017 (73 per cent in 2021 compared with 57 per cent in 2017) (p-value ≤ 0.01). There was an increase in the percentage of growers responding positively to all questions on protecting or enhancing beneficial organism populations from 2017 (Figure 48). Almost half of all growers had uncultivated areas (49 per cent in 2021 compared to 31 per cent in 2017), while planting and maintaining woodland, hedges and wildflower strips each received positive responses from ca. 20 per cent of all growers, an increase of 18, 13 and 15 per cent respectively compared with 2017 (however, growers were not directly asked about planting and maintaining woodland or hedges in 2017). Wetland restoration received positive responses from 12 per cent of growers, including the creation of wader scrapes (i.e. shallow depressions constructed in fields to hold water for only part of the year, providing feeding sites for wading birds such as lapwing and redshank).
Around one in four respondents were part of an agri-environment scheme (23 per cent in 2021 compared to 13 per cent in 2017), with 16 per cent participating in the Scottish Government agri-environment climate scheme (AECS). Several other actions to support beneficial organism populations were also reported in 2021. These additional measures included growers having Ecological Focus Areas (EFA) (seven per cent), sowing wild bird seed and game bird mixes (six per cent). Other activities growers adopted to protect and enhance beneficial organism populations are shown in Figure 48.
Note: in 2021, other included Ecological Focus Areas (EFA, seven per cent), keeps bees, retain winter stubbles, species rich grassland and wildlife corridor (all less than one per cent each). In 2017, other included conservation grazing, protecting ground nesting birds and maintenance of ponds.
*In 2017, growers were not specifically asked about planting & maintaining woodland, hedges or wetland restoration/management, therefore 2017 figures may be underestimated.
Finally, 61 per cent of respondents said they had good hygiene measures to reduce pest risk, with responses predominately being clean machinery between fields to reduce the risk of spreading pests, with some growers stating they do not use contractor machinery and only their own equipment.
Pest monitoring
In IPM, pests are monitored both to determine whether control is economically justified and to effectively target control options. IPM programmes aim to monitor and identify pests, so that appropriate control decisions can be made in conjunction with action thresholds. Table 31 presents an overview of the pest monitoring measures adopted by those growers surveyed and the statistical evidence for change between 2017 and 2021.
In 2021, there was strong evidence for an increase in the proportion of growers conducting pest monitoring activity (p-value ≤ 0.01), with all respondents reporting they implemented at least one measure associated with an IPM pest monitoring approach.
There was strong evidence for an increase in the proportion of growers reporting setting action thresholds for crops (p-value ≤ 0.01) (Table 31), while there was no evidence of change for any other pest monitoring activity.
| Pest monitoring activity | % positive response | % change | p-value | Evidence | |
|---|---|---|---|---|---|
| 2021 | 2017 | ||||
| Monitor and identify pests | 94 | 93 | 1 | > 0.05 | None |
| Regular monitoring of crop growth stage | 77 | 81 | -3 | > 0.05 | None |
| Setting action thresholds for crops | 34 | 18 | 16 | ≤ 0.01 | Strong |
| Use of specialist diagnostics | 22 | 17 | 5 | > 0.05 | None |
| Any pest monitoring activity | 100 | 94 | 6 | ≤ 0.01 | Strong |
Note: % change is absolute change.
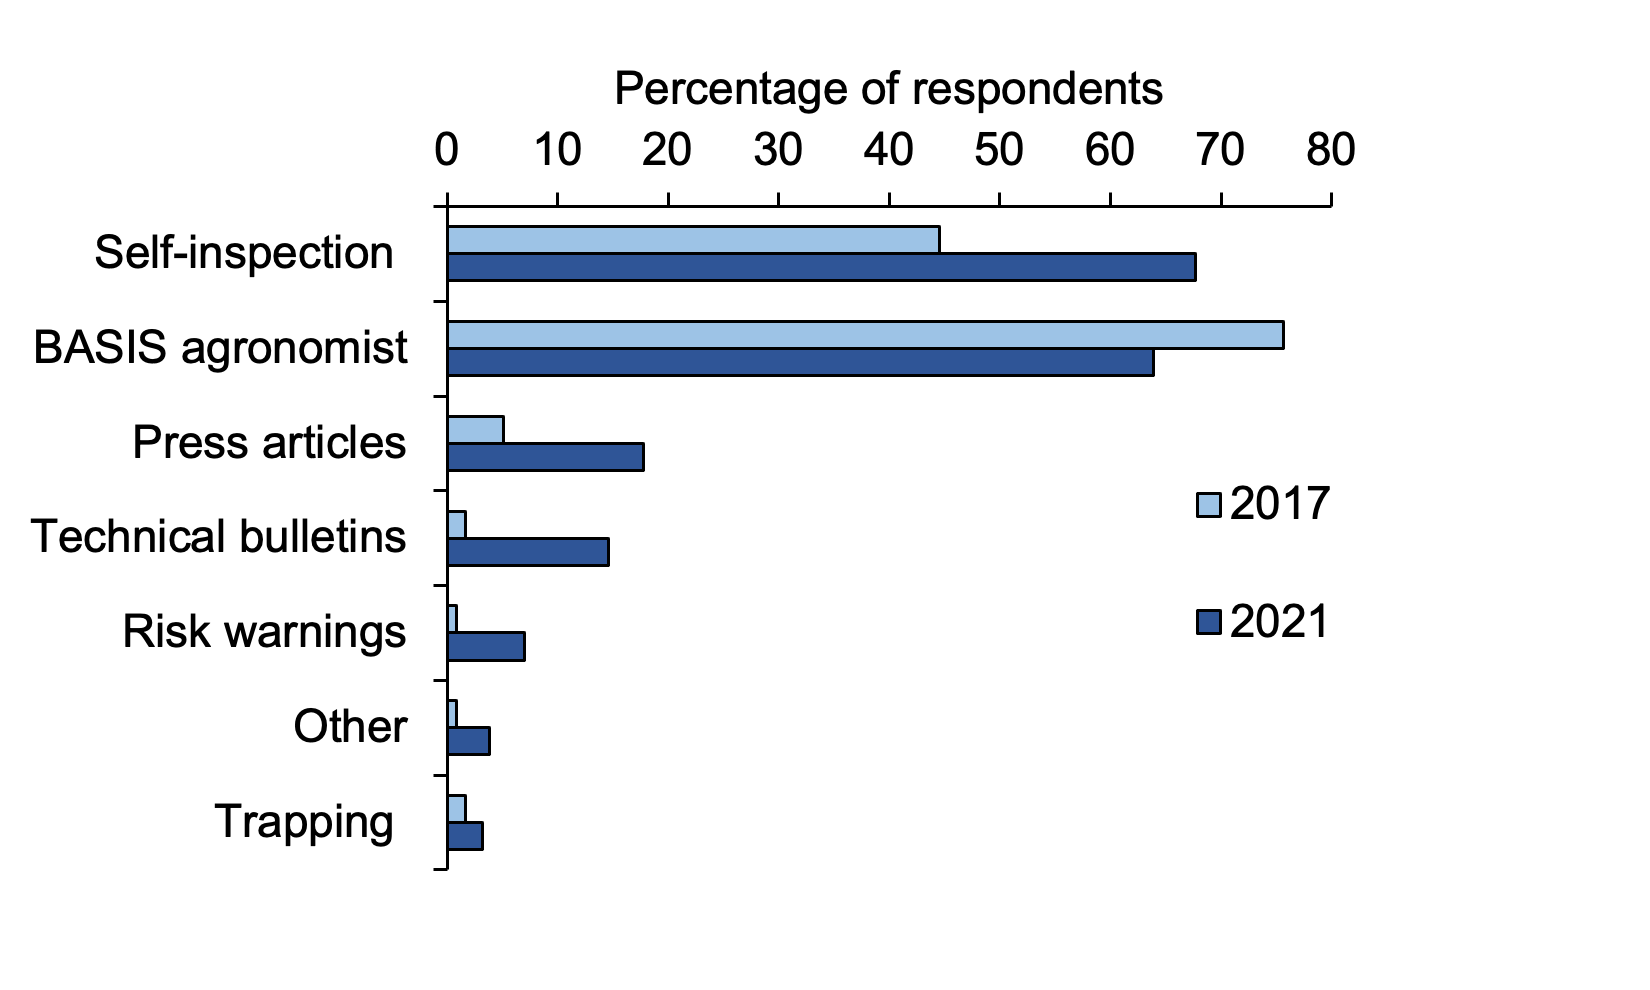
Although there was no evidence of change in the overall proportion of growers monitoring and identifying pests (p-value > 0.05), there was an increase in the proportion of respondents self-inspecting crops (68 per cent in 2021 compared with 45 per cent in 2017) (Figure 49) and a decrease in growers using a BASIS qualified agronomist to monitor crops for pests (64 per cent in 2021 compared to 76 per cent in 2017).
In addition, the proportion of growers that used press articles and technical bulletins to monitor and identify pests increased (18 and 15 per cent in 2021 compared with five and two per cent in 2017), primarily Scottish Agricultural College (SAC) bulletins. This may have been influenced by growers opting to inspect crops themselves and using alternative sources of pest monitoring information in addition to or instead of an agronomist. Other monitoring and identifying pest activities can be seen in Figure 49.
Note: in 2021, other included: information from other farmers and growers, social media and engage with experts.
In 2017, other included: attend SRUC advice scheme discussion group.
There was no evidence for change to the percentage of respondents regularly monitoring crop growth stage (77 per cent in 2021 compared with 81 per cent in 2017) (p-value > 0.05), nor for the use of specialist diagnostics (22 per cent in 2021 compared to 17 per cent in 2017) (p-value > 0.05).
However, there was strong evidence for an increase in positive responses for setting action thresholds for crops (34 per cent in 2021 compared to 18 per cent in 2017) (p-value ≤ 0.01). This is still lower than the uptake of setting action thresholds in other cropping systems, reflecting the lower pesticide input to grass and fodder crops. The threshold level at which pests become an economic threat (e.g. a certain density per plant or unit area at a pre-determined crop growth stage) is critical to guide pest control decisions.
Pest control
If monitoring, identification, and action thresholds indicate that pest control is required, and preventive methods are no longer effective or available, IPM programs evaluate the best control method in relation to effectiveness and risk. Control programmes incorporate non-chemical methods alongside, or instead of, chemical control. Use of chemical pest control should be as targeted as possible and the risk of resistance development should be minimised. The effectiveness of the control programme should be reviewed regularly to gauge success and improve their regime as necessary. Table 32 presents an overview of the pest control measures adopted by the growers surveyed and the statistical evidence for change between 2017 and 2021.
In 2021, all growers sampled reported that they implemented at least one IPM pest control activity.
There was very strong evidence for a decrease in the proportion of growers following anti-resistance strategies (p-value ≤ 0.001), and strong evidence for a decrease in the proportion of growers reporting targeted pesticide application (p-value ≤ 0.01) (Table 32). The reason for the decrease in these activities is unclear, however, the wide scale loss of active substances discussed earlier in this report may have influenced growers' ability to implement anti-resistance strategies.
There was no evidence of a change in the portion of growers using non-chemical control in partnership or instead of chemical control or monitoring success of crop protection measures. Of the holdings sampled in 2021, eight per cent were organic, an increase from four per cent reported in 2017.
| Pest control activity | % positive response | % change | p-value | Evidence | |
|---|---|---|---|---|---|
| 2021 | 2017 | ||||
| Non-chemical control used in partnership or instead of chemical control | 85 | 87 | -2 | > 0.05 | None |
| Targeted pesticide application | 35 | 51 | -16 | ≤ 0.01 | Strong |
| Follow anti-resistance strategies | 16 | 39 | -22 | ≤ 0.001 | Very strong |
| Monitor success of crop protection measures | 84 | 82 | 2 | > 0.05 | None |
| Any pest control activity | 100 | 97 | 3 | > 0.05 | None |
Note: % change is absolute change.
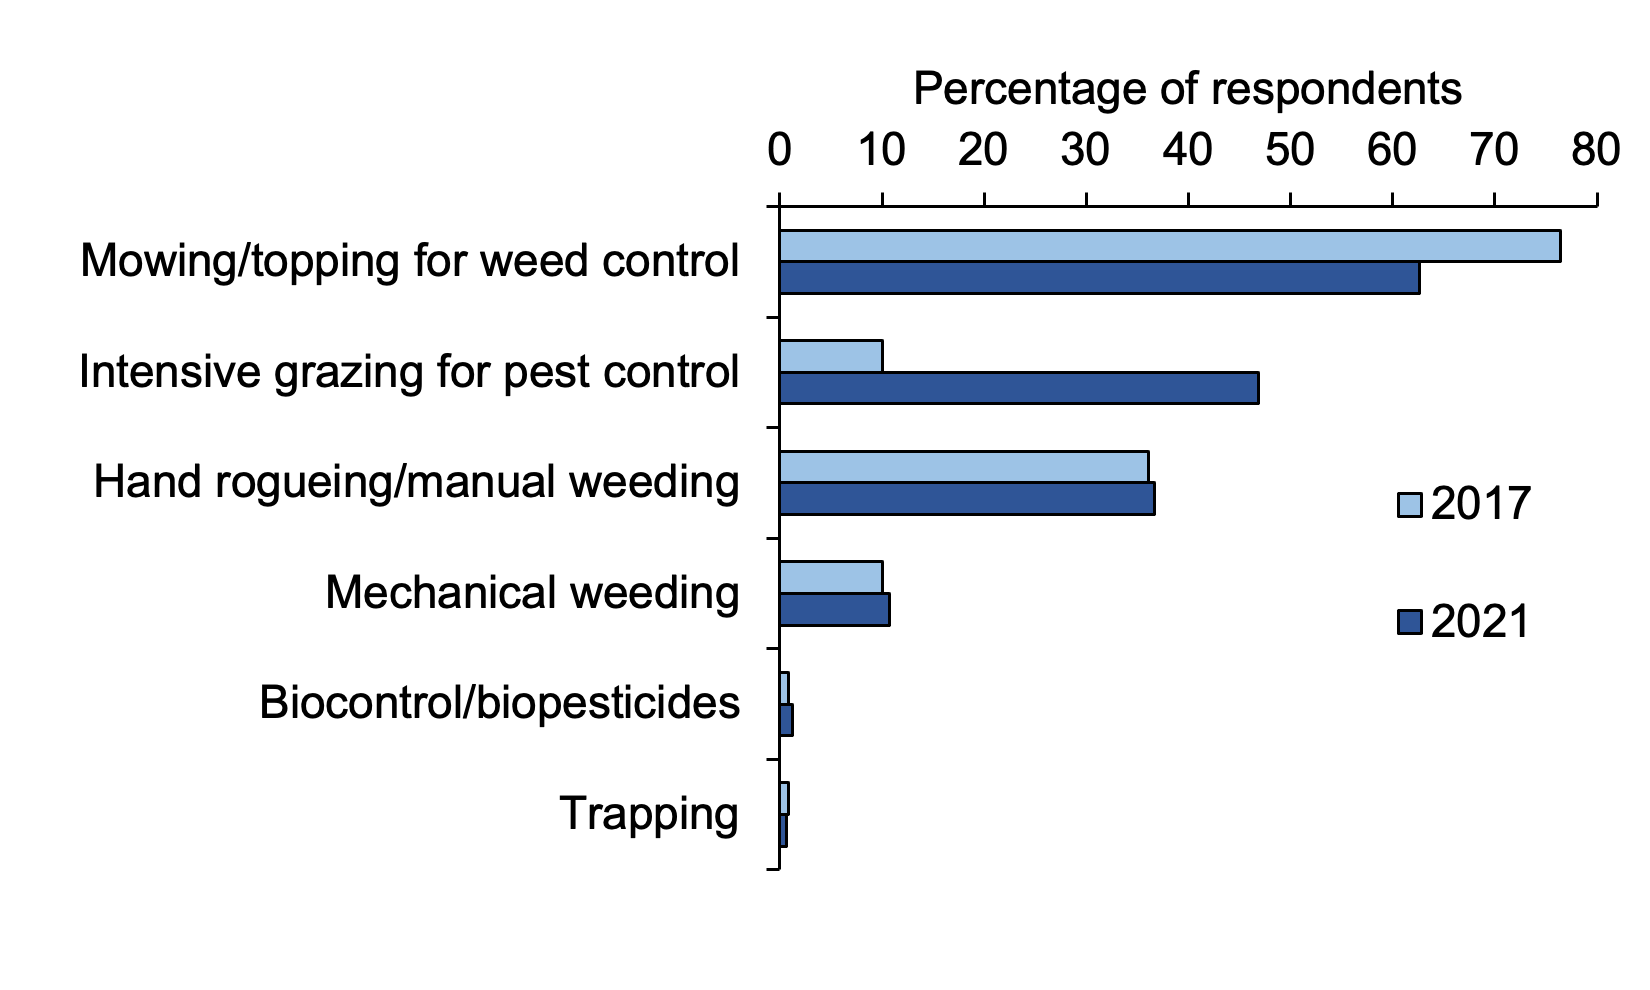
Although there was no evidence of change in the overall proportion of growers who reported they used non-chemical control in partnership or instead of chemical control (p-value > 0.05), there was an increase in the number of respondents using intensive grazing for pest control (47 per cent in 2021 compared with 10 per cent in 2017) (Figure 50), of which 92 per cent was for weed control, one per cent for disease control, and six per cent for both weed and disease control. The only other notable change reported was for a decrease in the percentage of respondents mowing/topping for weed control (63 per cent in 2021 compared with 76 per cent in 2017). Other non-chemical control methods used can be seen in Figure 50.
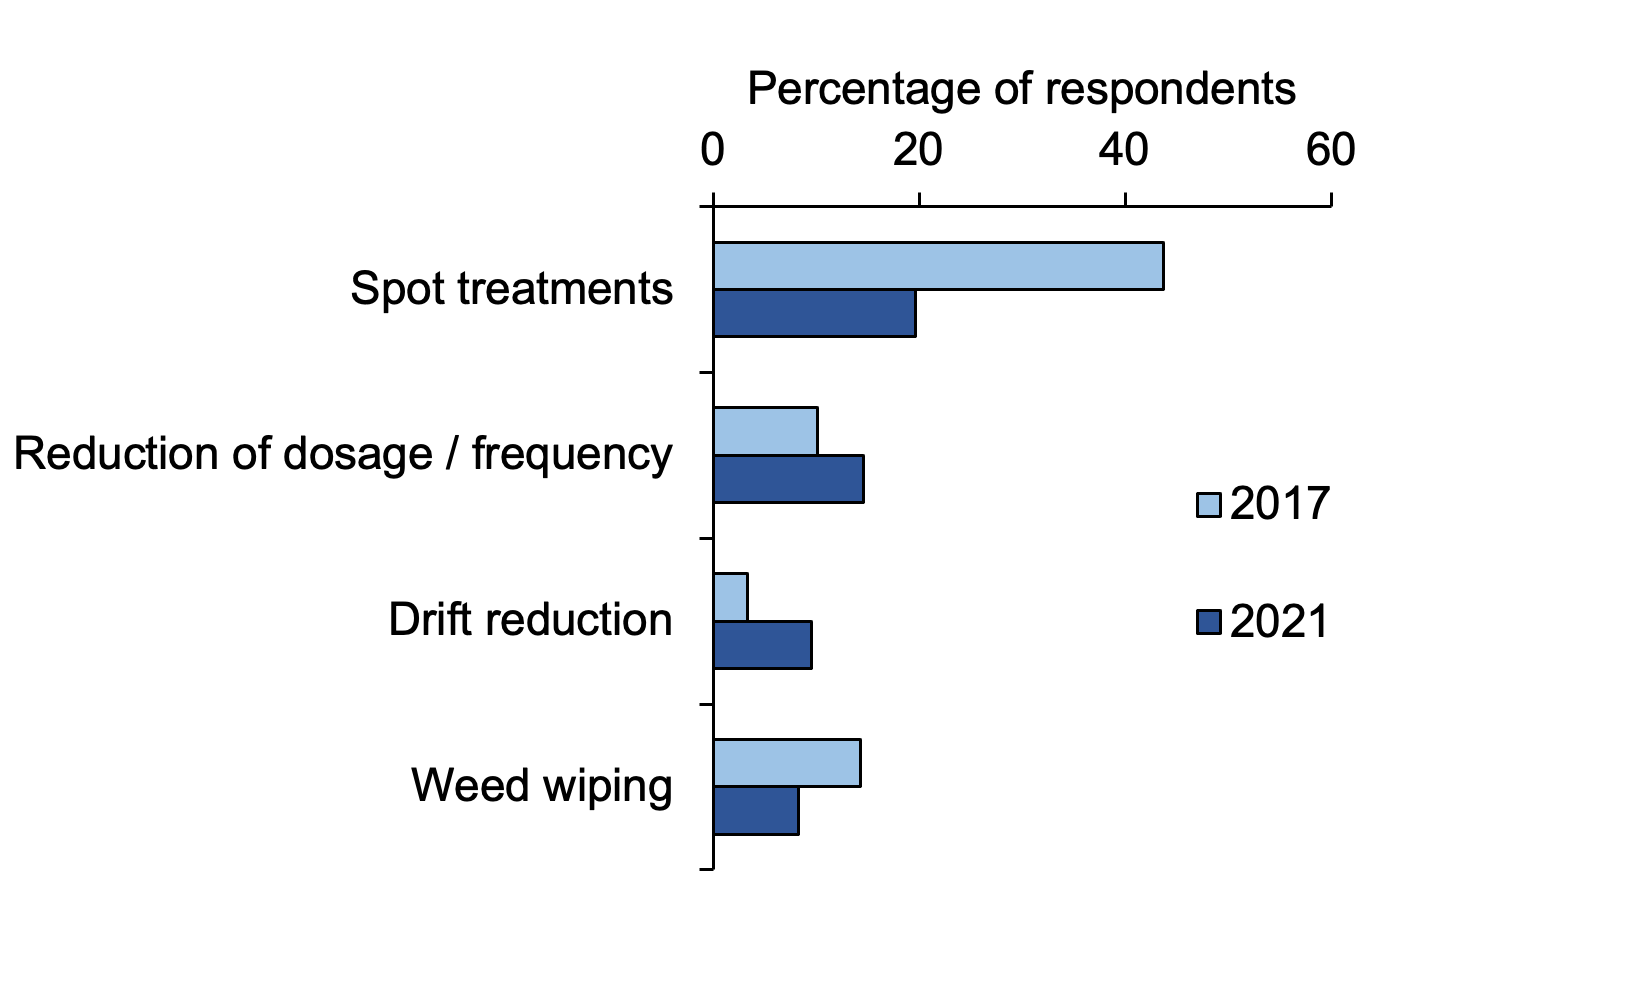
There was strong evidence the proportion of growers using targeted pesticide applications to control pests decreased from 2017 (35 per cent in 2021 compared with 51 per cent in 2017) (p-value ≤ 0.01). This was largely driven by a decrease in the number of growers who reported use of spot treatments and weed wiping (20 and eight per cent in 2021 compared with 44 and 14 per cent in 2017, respectively) (Figure 51). This was partially offset by an increase in percentage of growers reporting the use of drift reduction nozzles and reducing the dosage/frequency of applications (nine and 15 per cent in 2021 compared to three and 10 per cent in 2017, respectively).
There was very strong evidence for a decrease in the proportion of growers following anti-resistance strategies from 2017 (16 per cent in 2021 compared with 39 per cent in 2017) (p-value ≤ 0.001). This was driven by a decrease in the percentage of respondents who reported minimising number of applications (13 per cent in 2021 compared with 34 per cent in 2017). There was very little change in other anti-resistance strategies used (Figure 52).
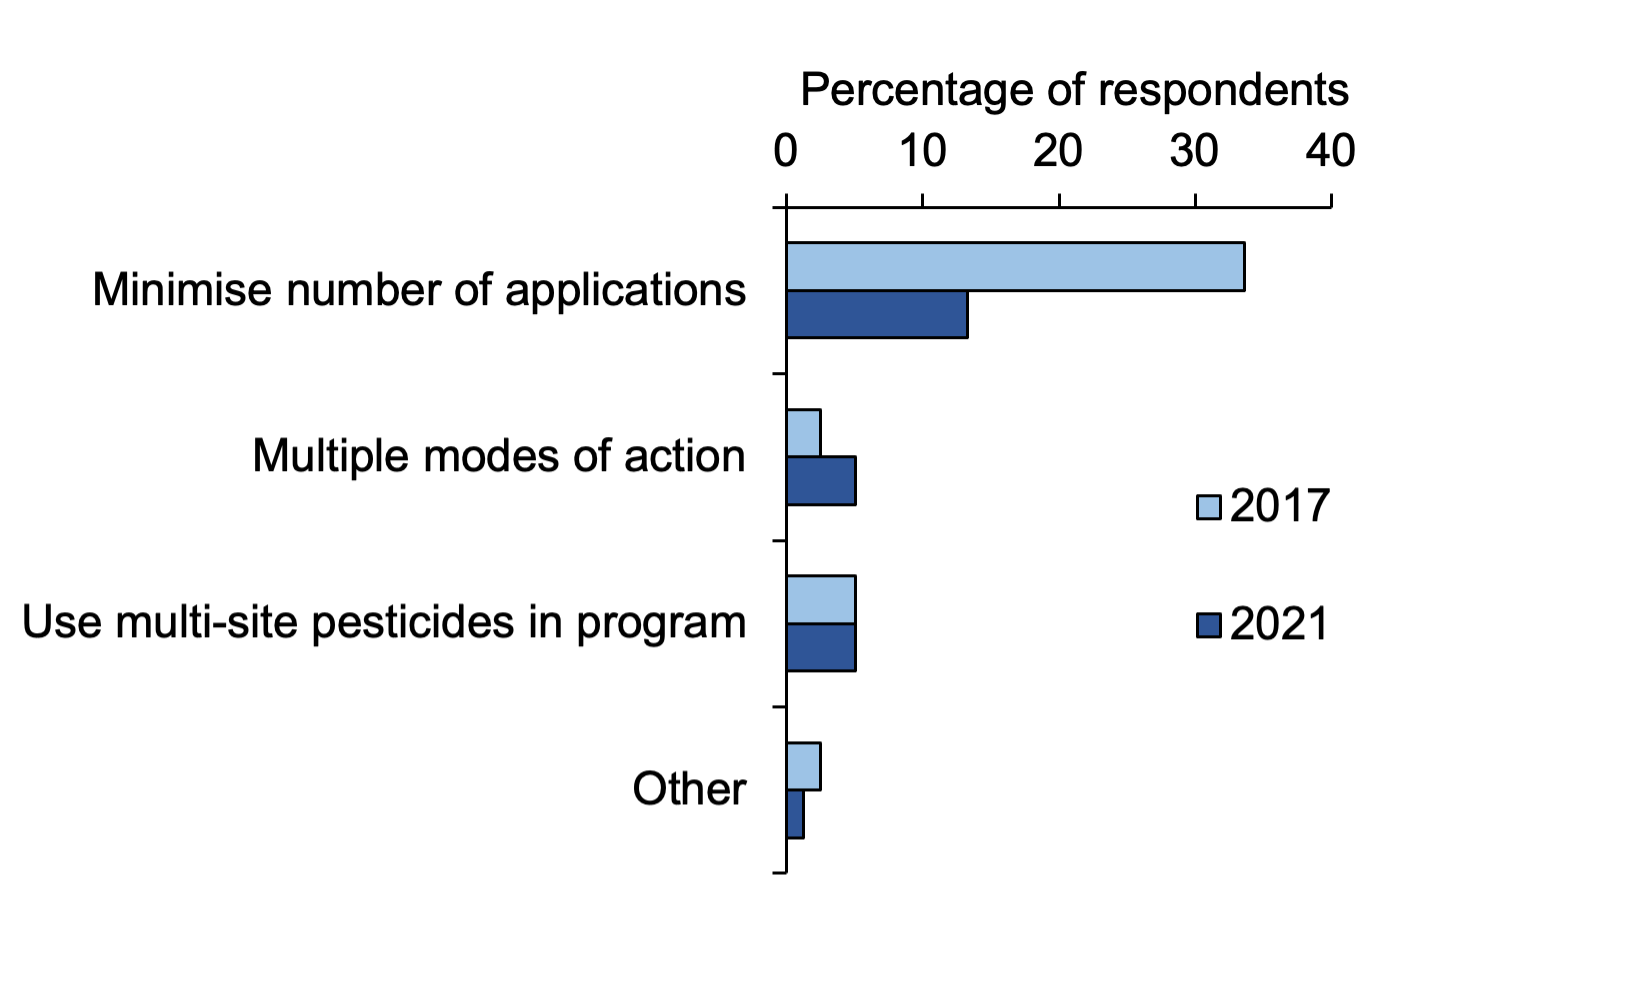
Note: in 2021, other included taking advice from agronomist.
In 2017, other included taking advice from agronomist and following advice from SRUC consulting.
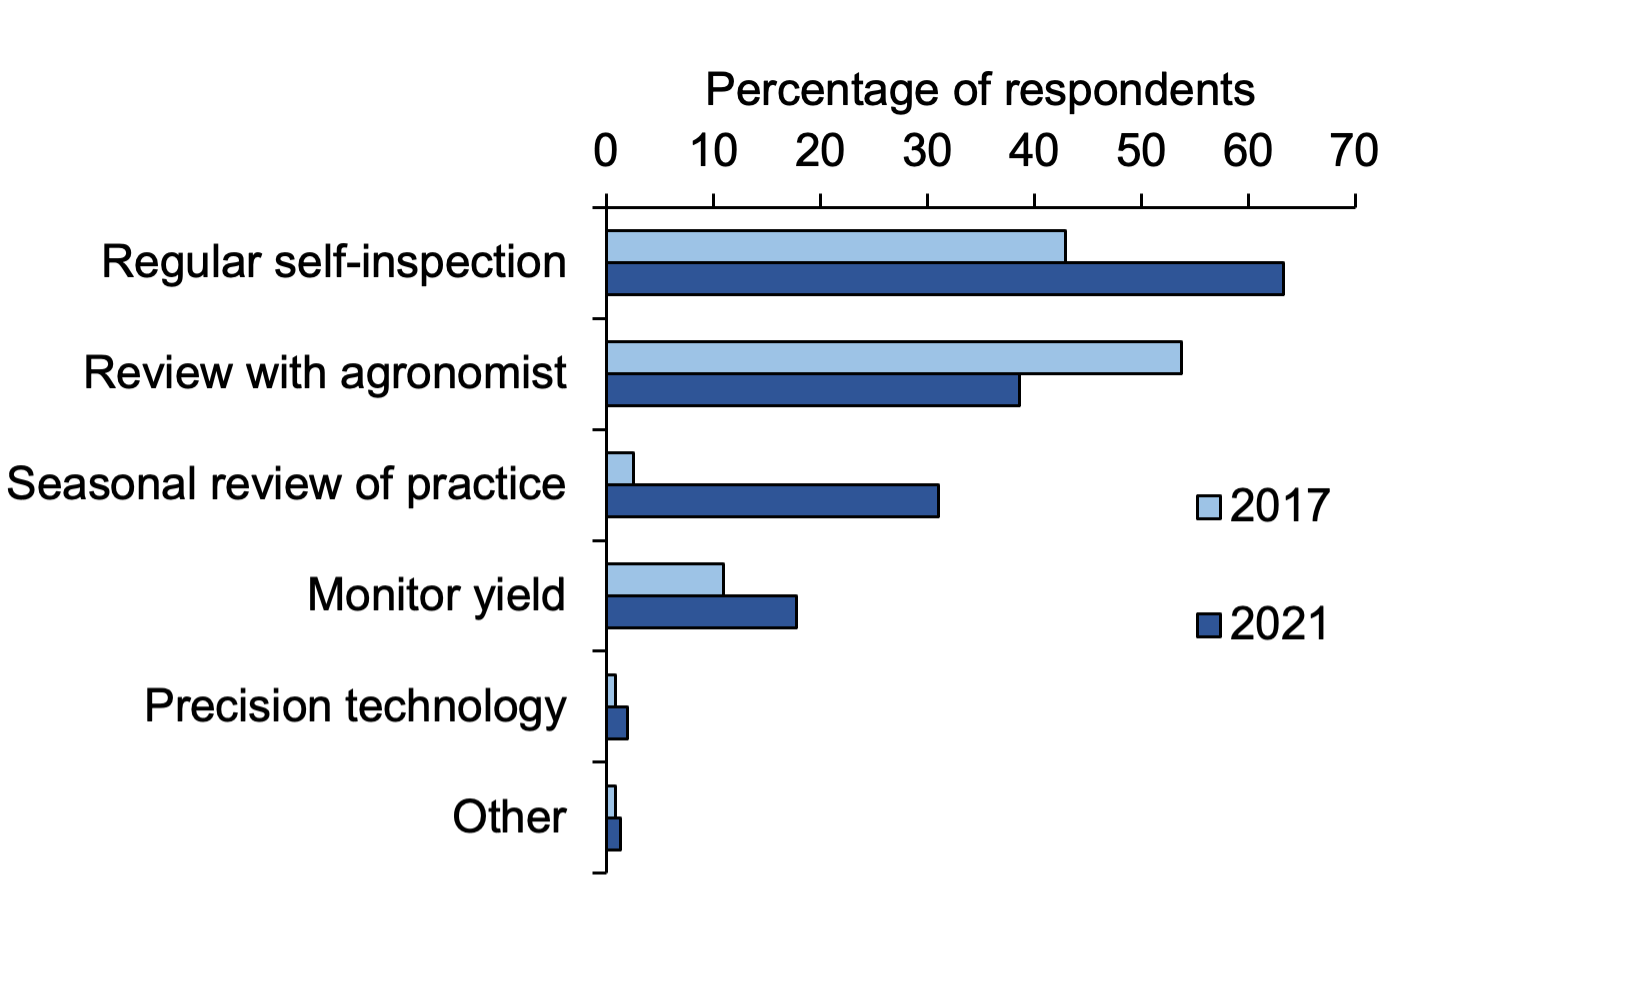
An important aspect of IPM is monitoring the success of risk management and crop protection practices to continually improve regimes. Although there was no evidence of change in the proportion of growers who reported they monitored the success of crop protection measures (p-value > 0.05), there was an increase in the number of growers conducting a seasonal review of practices (31 per cent in 2021 compared with three per cent in 2017) (Figure 53). There was a decrease in the percentage of respondents conducting a review with their agronomist (39 per cent in 2021 compared with 54 per cent in 2017). The other notable change was the increase in the percentage of growers who reported they conducted regular self-inspections of their crops (63 per cent in 2021 compared with 43 per cent in 2017). Other methods used to monitor success of crop protection measures can be seen in Figure 53.
Note: in 2021, other included use of GPS.
In 2017, other included monitoring crop input costs.
Contact
Email: psu@sasa.gov.scot
There is a problem
Thanks for your feedback