Building Standards verification performance framework - national customer satisfaction survey: survey findings 2021
Results from the National Customer Satisfaction Survey 2021 giving a summary of local authority performance of the National Performance Framework.
This document is part of 2 collections
4. Overall satisfaction
4.1. Overall satisfaction with the building standards service
1. Surveyed customers were asked to rate their overall satisfaction with the local authority verifier building standards service on a scale from 1 'not at all satisfied' to 10 'completely satisfied'.
2. The overall average rating is 7.1 out of 10. This is slightly lower than 7.5 in 2020 and 7.4 in 2019. The most common (modal) rating was the perfect mark of 10 out of 10 (Figure 4.1.a).
3. Direct applicants are slightly more satisfied than agents, although the gap between the two remains close. The average applicant rating stands at 7.2 (a decrease from 7.5 in 2020) while the average agent rating has decreased to 7.0 (from 7.5 in 2020 and a return to the 2019 level of 7.0).
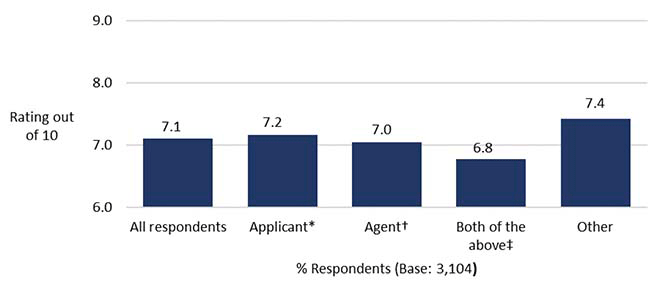
Notes * Applicant for a building warrant and/or submitter of a completion certificate
† Agent working on behalf of an applicant or submitter
‡ Both of the above (i.e. direct applicant/submitter AND agent)
Source Pye Tait Consulting, 2021
4. Average ratings differ very slightly by type of application, being 7.1 for domestic customers only and non-domestic customers only, and 6.9 for mixed (domestic and non-domestic) customers.
5. The overall satisfaction within each local authority verifier is displayed in Table 4.1.a. Average scores range between 5.5 and 8.7. Just under half of all local authorities (15) score 7.5 or above; six local authorities score below 6.5, and 11 score between 6.5 and 7.4 (inclusive). Most local authorities (23 of 32) have seen a fall in satisfaction levels, with six increasing their scores from 2020, and three retaining similar scores to last year.
Table 4.1.a Legend for table 4.1.b
| Key | Numerical rating questions | Percentage questions |
|---|---|---|
| Green (G) | 7.5 and higher | 75% and higher |
| Amber (A) | Between 6.5 and 7.4 | Between 65% and 74% |
| Red (R) | 6.4 and below | 64% and below |
Note that the colour-coding metrics used reflect The Scottish Government's updated performance measurement requirements
| Local authority verifier | Overall satisfaction score 2021 | Overall satisfaction score 2020 | Overall satisfaction score 2019 |
|---|---|---|---|
| Aberdeen City | 8.1 (G) | 8.3 (G) | 8.0 (G) |
| Aberdeenshire | 8.2 (G) | 8.3 (G) | 8.6 (G) |
| Angus | 8.0 (G) | 8.5 (G) | 8.9 (G) |
| Argyll and Bute | 8.0 (G) | 8.6 (G) | 8.5 (G) |
| City of Edinburgh | 5.5 (R) | 6.2 (R) | 5.4 (R) |
| Clackmannanshire | 8.0 (G) | 8.4 (G) | 8.9 (G) |
| Dumfries and Galloway | 8.2 (G) | 7.9 (G) | 7.1 (A) |
| Dundee City | 6.5 (A) | 7.4 (A) | 7.6 (G) |
| East Ayrshire | 7.9 (G) | 8.7 (G) | 8.2 (G) |
| East Dunbartonshire | 6.3 (R) | 6.9 (A) | 4.8 (R) |
| East Lothian | 7.4 (A) | 7.4 (A) | 6.9 (A) |
| East Renfrewshire | 7.6 (G) | 8.0 (G) | 8.1 (G) |
| Eilean Siar | 8.7 (G) | 8.6 (G) | 8.5 (G) |
| Falkirk | 7.4 (A) | 7.4 (A) | 7.9 (G) |
| Fife | 7.2 (A) | 7.6 (G) | 7.5 (G) |
| Glasgow City | 5.7 (R) | 6.2 (R) | 5.4 (R) |
| Highland | 7.3 (A) | 7.6 (G) | 7.7 (G) |
| Inverclyde | 6.9 (A) | 5.9 (R) | 6.3 (R) |
| Midlothian | 7.8 (G) | 7.8 (G) | 8.8 (G) |
| Moray | 8.0 (G) | 7.7 (G) | 8.0 (G) |
| North Ayrshire | 8.0 (G) | 7.8 (G) | 8.6 (G) |
| North Lanarkshire | 6.2 (R) | 7.4 (A) | 7.5 (G) |
| Orkney | 7.6 (G) | 8.2 (G) | 8.6 (G) |
| Perth and Kinross | 7.4 (A) | 8.1 (G) | 8.3 (G) |
| Renfrewshire | 5.9 (R) | 6.7 (A) | 7.2 (A) |
| Scottish Borders | 6.7 (A) | 7.5 (G) | 7.4 (A) |
| Shetland | 6.7 (A) | 8.2 (G) | 7.6 (G) |
| South Ayrshire | 6.5 (A) | 7.8 (G) | 7.7 (G) |
| South Lanarkshire | 8.0 (G) | 8.4 (G) | 8.0 (G) |
| Stirling | 6.9 (A) | 7.3 (A) | 7.4 (A) |
| West Dunbartonshire | 6.1 (R) | 6.2 (R) | 8.1 (G) |
| West Lothian | 8.2 (G) | 8.1 (G) | 8.7 (G) |
| Scotland* | 7.1 (A) | 7.5 (G) | 7.4 (A) |
Notes:
* National comparison for ease of reference.
Source: Pye Tait Consulting, 2021
Contact
Email: buildingstandards@gov.scot
There is a problem
Thanks for your feedback