National Care Service - adult social care workforce: evidence
This paper summarises the available evidence on the adult social care workforce in Scotland. It is part of a collection of contextual evidence papers, setting out key sources of information about social care and related areas in Scotland.
This document is part of a collection
2. Current structure of the adult social care workforce
This section provides an overview of the adult social care workforce in Scotland. It examines total headcount and composition, employer types, demographic characteristics of the social care workforce and the stability index of the sector (the stability index measures the proportion of staff who have been retained from the previous year).
The main data source is the SSSC report Scottish Social Service Sector: Report on 2020 Workforce Data[2] which is the latest published information available. Thus, the impact of the Covid-19 pandemic is not fully captured by this report.
Adult social services include care homes for adults, housing support/care at home, adult day care and adult placement services.
Some key characteristics of the adult social workforce in Scotland in 2020 are:
- 134,640 people were employed in adult social care, which is 5.7% higher than in 2011. This increase has been driven mainly by increases to the housing support/care at home sub-sector (16.5%).
- The stability index of the adult social care workforce was 81.7%. This means just over four fifths of the workforce remained in the same post since the previous year.
- The private sector was the largest employer in adult social care.
- The two largest sub-sectors in adult social care were housing support/care at home and care homes for adults.
- The median age of the adult social care workforce was highest in the public sector (51) and lowest in the private sector (42).
- 80% of adult social care staff were female and 17% were male, with no data reported for the remaining 3%.
- The adult social care workforce was mainly employed on permanent contracts (86%).
- On average adult social care staff in Scotland worked for 31 hours per week in 2020.
2.1 Headcount and composition
The headcount of the adult social care workforce in Scotland for 2020 was 134,640. The whole time equivalent, that is to say the number of hours considered as full-time, of the 2020 adult social care workforce was 100,060. The fluctuation over time has been relatively small in comparison to the overall size as is shown in Figure 1.
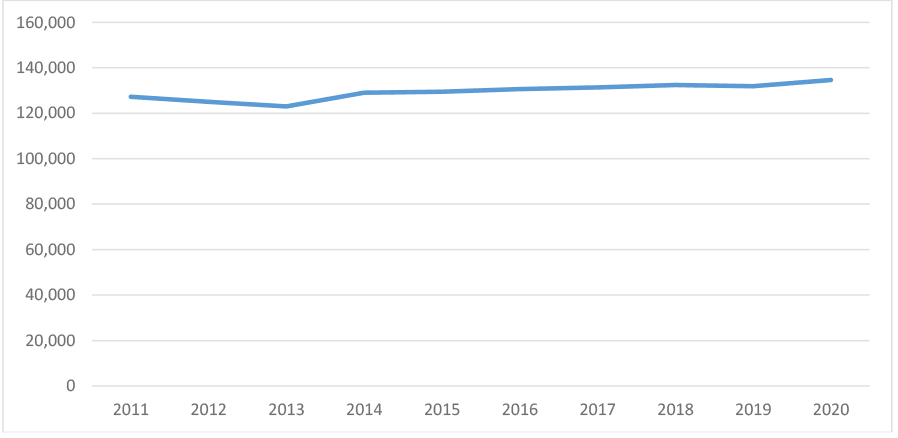
Source: Area at a glance (sssc.uk.com)
Table 1 presents an overview of the adult social care sector workforce by sub-sector for 2011, 2019 and 2020, as well as the percentage change over the 10 years since 2011.
Sub-sector |
2011 |
2019 |
2020 |
Change since 2011 |
|---|---|---|---|---|
Adult day care |
8,730 |
7,260 |
6,650 |
-23.8% |
Adult placement services |
160 |
290 |
200 |
22.8% |
Care home for adults |
54,150 |
53,080 |
52,920 |
-2.3% |
Housing support/care at home |
64,290 |
71,260 |
74,870 |
16.5% |
Total |
127,330 |
131,890 |
134,640 |
5.7% |
In 2020, there were 134,640 people employed in adult social care in Scotland, which is 5.7% higher than in 2011. The largest two sub-sectors are housing support/care at home and care homes for adults. Together they accounted for approximately 95% of the total headcount in adult social care in 2020.
Between 2019 and 2020, the estimated workforce increased by 2,750 (2%). This was driven by an 3,610 (5%) increase in the housing support/care at home sector. Three out of four sub-sectors in adult social care recorded a decrease in the estimated headcount, with the biggest absolute decrease in adult day care, with 610 fewer people (approximately -9%).
2.2 Employer type
Table 2 displays the employer type for the adult social care sub-sectors.
Sub-sector |
Public |
Private |
Voluntary |
Total |
|---|---|---|---|---|
Adult day care |
3,600 |
430 |
2,620 |
6,650 |
Adult placement services |
160 |
0 |
40 |
200 |
Care home for adults |
6,820 |
37,880 |
8,220 |
52,920 |
Housing support/care at home |
19,680 |
20,280 |
34,910 |
74,870 |
Total |
30,260 |
58,590 |
45,790 |
134,640 |
In 2020, approximately 22% of the adult social care workforce was employed in the public sector, 44% in the private sector and 34% in the voluntary sector. The public and voluntary sectors for adult social care are at their highest absolute numbers since 2011 while private sector increased only slightly.
In 2020 the private sector was the main employer in the care home for adults sub-sector (approximately 72%), whereas the voluntary sector was the main provider of workforce in the housing support/care at home subsector (approximately 47%).
2.3 Demographic profile of the adult social care workforce in Scotland
2.3.1 Age
Table 3 provides information about the average (median) age of the adult social care workforce in Scotland.
Employer type |
Median age of workforce |
|---|---|
Public sector |
51 |
Private sector |
42 |
Voluntary sector |
45 |
Total |
46 |
The public sector has the oldest workforce, with an average age of 51 years, while the private sector had the youngest workforce with an average age of 42 years. The voluntary sector has a workforce median age of 45, very close to the overall adult social care workforce average which is 46 years.

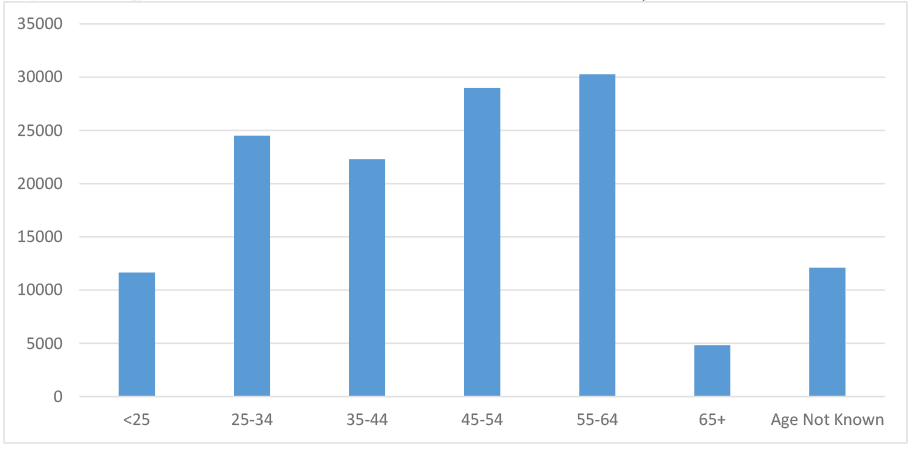
Most adult social care staff were in the 55-64 and 45-54 age brackets (see Figure 2), which accounted for approximately 22.5% and 21.5% of the total adult social care workforce respectively.
2.3.2 Sex
Figure 3 provides information on the proportion of staff working in adult social care by sex. In 2020, at least 80% of staff were reported to be female and only 17% were reported to be male, with no data reported for the remaining 3%. That means that approximately four out of five staff were female. For 3% of the workforce there was no information about their sex. In 2011 the ratio of males to females in the adult social care workforce was similar to that in 2020.
2.3.3 Ethnicity
There was a high proportion of unknown responses in the workforce ethnicity data (including those where ethnicity was not disclosed), so the data should be treated with caution. Table 5 shows the percentage of staff by ethnic classification for the adult social care sector.
Sub-sector |
White |
Mixed |
Asian |
Black |
Other |
Unknown |
|---|---|---|---|---|---|---|
Adult day care |
84 |
0 |
1 |
0 |
0 |
14 |
Adult placement services |
84 |
0 |
1 |
0 |
0 |
16 |
Care homes for adults |
73 |
0 |
3 |
2 |
1 |
22 |
Housing support/care at home |
65 |
0 |
1 |
1 |
0 |
32 |
Total |
69 |
0 |
2 |
1 |
0 |
27 |
The adult social care sector is mainly white (at least 69% of staff). There appears to be a higher proportion of ethnic minority staff in the private sector than the other sectors. Overall, 3% of the workforce reported as belonging to an ethnic minority, ranging from 2% in the public sector to 5% in the private sector.
2.3.4 Disability
As with ethnicity, the data on whether workers regarded themselves as having a disability is difficult to interpret due to the large number of unknown responses (including not disclosed). As Figure 4 indicates, 81% of adult social care staff stated that they do not have any disability. Only 2% reported having a disability, however, this is likely to be an undercount because disability information was unknown or not disclosed for a further 17% of the workforce.

2.4. Overview of post characteristics: job function, hours of work and contract type
2.4.1 Job function
Figure 5 shows the proportion of adult social care staff working in different job functions. The majority of staff (85%) were employed in frontline care roles with auxiliary roles[5] at 12% of the overall workforce. The remaining 3% were in managerial posts.

There was a small variation across the sub-sectors. Some sub-sectors require staff with specific qualifications, so they had higher proportion of managerial staff. For example, adult placement services had 24% of staff working in managerial roles.
Since 2011, frontline care roles have increased, as a percentage of the adult social care workforce, by three percentage points, while auxiliary and managerial staff saw a decrease of two percentage points and one percentage point respectively.
2.4.2 Hours of work/Contract type
On average adult social care staff in Scotland worked for 31 hours per week in 2020. Just over half (53%) of the total workforce was employed on a full time basis, while 47% was part time.
In terms of contract type, around five-sixths (83%) of the adult social care workforce in 2020 was employed on a permanent basis, a proportion which was consistent across the sub-sectors. Around 5.5% of employee contracts had no guaranteed hours (zero hour contracts), which rose to 9% in the housing support/care at home sector.
Contact
Email: SWStat@gov.scot
There is a problem
Thanks for your feedback