Minimum Unit Pricing (MUP) Continuation and future pricing: Business and Regulatory Impact Assessment
Scottish Government developed a Business and Regulatory Impact Assessment to analyse the costs and benefits of the continuation and uprating of Minimum Unit Price (MUP) on businesses.
4. OPTIONS
The minimum unit price is intended to be set at a level that delivers the desired public health benefit in a way that balances public health benefits with potential impacts on the alcoholic drinks industry and business.
Various factors overall impact on the different options were considered as part of the Interim BRIA[47] – including evidence on trends in alcohol affordability, the impact of different measures of inflation, and the impact of MUP on the alcohol drinks market to date on prices and price distribution. Some of these factors are set out, again, in turn in the first half of this section, in order to give the overall context for the consideration of future options, which are set out in the second half, and the reasons for Scottish Ministers agreement to continue MUP and increase the minimum price to 65ppu.
4.1 Background - Consideration of factors and evidence relevant to the MUP policy
PHS’s Evaluation of MUP
PHS conducted a comprehensive and robust evaluation of MUP,[48] adopting a theory-based approach to evaluation. The HM Treasury Magenta Book[49] (Central Government guidance on conducting evaluations) and Medical Research Council[50] guidance highlight theory-based approaches as particularly suited for the evaluation of complex interventions or simple interventions in complex environments. In this case, MUP is a simple intervention in a complex environment and a theory-based approach allowed consideration of the numerous potential impacts and the range of external factors which could interact with the policy and/or influence delivery and outcomes.
Other approaches, such as a more traditional experimental evaluation, would not have been feasible as there was no way of controlling exposure to the policy which would be required for this type of methodology. Theory-based evaluations use a range of methods, with the evaluation of MUP using quantitative methods to measure change and qualitative methods to provide more understanding and insight. The evaluation also used a natural experiment design, where it was able to compare Scotland to an area (usually England) where MUP was not in place.
The evaluation was commended in a public letter in the Lancet by a number of respected public health academics including Sir Michael Marmot, Professor Ian Gilmore and Sally Casswell ONZM, a member of the WHO Expert Advisory Panel on Drug and Alcohol Dependence.
Other countries are now looking to Scotland to consider how they might take forward and evaluate their own policies. For example, Public Health Association Australia described MUP in Scotland as one of the most thoroughly evaluated public health policies in decades.[51] They say: “Through strong governance, excellent leadership, and transparent communication, the Public Health Scotland team has provided an exemplar for others undertaking public policy evaluations. The use of multiple, robust data sources, counterfactuals, and sensitivity analyses provided confidence in the results from population-level quantitative studies.” They conclude that Scotland’s approach to evaluation was credible and should give confidence to Parliamentarians in Scotland.
The final evaluation report synthesised the evidence from 40 papers across a range of outcomes areas to answer the evaluation questions:
- To what extent has implementing MUP in Scotland contributed to reducing alcohol-related health and social harms?
- Are some people and businesses more affected (positively or negatively) than others?
PHS’s evaluation report concluded that:
- MUP was estimated to have significantly reduced deaths wholly attributable to alcohol consumption by 13.4% and was likely to have reduced deaths partially attributable to alcohol consumption by 8.4% up to the end of 2020, compared to what would have happened if MUP was not in place.
- MUP was estimated to be likely to have reduced hospital admissions wholly attributable to alcohol consumption by 4.1% and was likely to have reduced admissions partially attributable to alcohol consumption by 3.4% up to the end of 2020 compared to what would have happened if MUP was not in place
- MUP had contributed to reducing health inequalities, as the largest estimated reductions in deaths and hospital admissions wholly attributable to alcohol consumption were seen in those living in the 40% most deprived areas.
- There is evidence of reduced alcohol consumption - the evaluation found that the reduction in consumption was driven by the heaviest purchasing households, and the majority of households were not affected, leading to the conclusion that MUP was well targeted
- There was no consistent evidence that MUP impacted either positively or negatively on the alcoholic drinks industry as a whole.
- The evaluation identified no consistent evidence of impact, positive or negative, on wider social harm due to alcohol – noting this was not a core aim of the policy – however there is some qualitative evidence of negative consequences, particularly for those with alcohol dependence on low incomes.
- There was evidence of a high level of compliance, as sales of alcohol below 50ppu largely disappeared following the implementation of MUP.
These conclusions were used by the Scottish Government in coming to a decision around the continuation of MUP and raising the price to 65ppu. There were a number of factors about the evidence, some of which were raised by respondents in the consultation, which required additional consideration and assessment.
A key conclusion of the evaluation was that it was found to be effective in reducing health harms. Eight papers contributed evidence on health outcomes and were assessed in PHS’s final evaluation report. A study conducted by Wyper and colleagues[52] estimated a reduction in deaths and hospitalisations due to MUP. The other studies which considered health outcomes found no evidence of impacts in alcohol-related health outcomes, either positive or negative. The Scottish Government has considered, therefore, whether the conclusion reached by PHS is reasonable.
The studies considered by the evaluation in relation to health outcomes considered a range of different outcomes and specific populations to provide a complete picture of how MUP impacted on health. The study which found positive evidence of health outcomes (Wyper et al., 2023) provided population level evidence on the key indicators of alcohol-specific deaths and hospitalisations. The other health outcomes measured were alcohol-related ambulance callouts, prescriptions for treatment of alcohol dependence, emergency department attendance. Whilst it might have provided additional supporting evidence if positive outcomes were found for all of these, the important measures of health harms are deaths and hospitalisations.
Deaths are also the most objective measure and, along with hospitalisations, the most directly linked to alcohol consumption. The other measures could be influenced by other factors such as recording practices, demand on services and decision to present at services (this includes hospitalisations but to a slightly lesser degree due to well-established and standardised coding practices).
There was some qualitative evidence from the studies which looked at specific populations that MUP may have had some negative health consequences for some individuals with alcohol dependence. MUP alone was not intended as an intervention to help those with alcohol dependence – this group require care and treatment services – therefore this finding does not significantly detract from the overall conclusion of population level reductions in alcohol related harm.
As discussed above, this was a theory-based evaluation with broadly the plausible chain of events as the cost of (low-cost, high-strength) alcohol increases, consumption goes down and deaths and admissions go down. If the first two did not occur then the latter is unlikely to be due to MUP. However, the evaluation showed that the first two did occur. Therefore, the Scottish Government has confidence in this finding as it fits the theory of change, increasing confidence that the estimated decrease in deaths and hospitalisations was due to MUP.
Within the study by Wyper and colleagues, there were some findings which also required careful further consideration. In contrast to the reduction in deaths caused by chronic conditions, the study found a small increase in deaths from acute causes. Acute outcomes make up a small portion of alcohol-specific deaths in Scotland (e.g. ONS data published for 2021 showed 56 deaths from alcohol specific acute causes registered in Scotland that year) and the report authors note that these findings were not statistically significant and therefore less certain than the reductions in chronic deaths. The authors suggest that any potential increase in deaths due to acute conditions could be driven by a reduction in food intake due to displacement of spending from food to alcoholic drinks, or switching to products that have a higher ABV (e.g. spirits instead of ciders), as evidenced in other studies. Therefore, there is considerable uncertainty around this finding which does not change the overall conclusion but is worth monitoring in the future.
Another aspect that has been considered carefully is the fact that the findings in this study refer to the period to end 2020. This was due to the time it takes for the data to be collected, analysed, and reported on. Since 2020, alcohol-specific deaths have risen in both Scotland and England. The authors of the study conclude that as the increase in the mortality rate in Scotland from 2020 to 2021 (4%) was lower than in England (7%), it is unlikely that the inclusion of this more recent data would have altered the main findings. We cannot be certain of whether this would be the case beyond 2021, as although we have data on alcohol-specific deaths registered in Scotland in 2022, this data is not yet available for England. However, as the findings of this study are in line with the wide body of previous evidence that shows increasing the price of alcohol reduces harm, the Scottish Government considers it highly likely that MUP will have remained effective at reducing deaths for the remainder of the study period, albeit that the levels of effectiveness in improving health outcomes may have reduced as a result of the effects of inflation.
The modelling conducted by the Sheffield Alcohol Research Group provides evidence on the potential impact of inflation.[53] This estimated that the reduction in the real-terms value of the MUP level since 2018 means alcohol consumption in Scotland was higher in 2023 than it would have been if the MUP level had risen with inflation. There is a strong link between consumption and harm so it is logical to assume that the extent to which MUP reduced health harms across this period may have diminished compared to if the price had risen in line with inflation. Further modelling by Sheffield on the effect of different models of uprating provides additional support to this assumption. Their results suggest that although there are only small differences in effect between policies that increase the MUP threshold in line with inflation each year and where this adjustment is made every 5 years instead, the former approach (which is what happened between 2018 and 2023) leads to marginally lower levels of overall health harms. This is a key reason for increasing the price to ensure that the effects that were seen up to the end of 2020 when the MUP was set at 50ppu are preserved, if not improved upon.
Since PHS published their evaluation report, National Records Scotland have published data on alcohol-specific deaths for 2022.[54] This shows that alcohol-specific deaths have been rising in Scotland in recent years (there were 1,276 alcohol-specific deaths registered in Scotland in 2022, an increase of 2% on 2021). This could be considered inconsistent with the findings of the Wyper study which estimated reductions in alcohol-specific deaths up to the end of 2020 compared to if MUP had not been in place.
However, the Scottish Government does not consider this increase in alcohol-specific deaths as evidence that MUP has not reduced deaths caused by alcohol. Evidence from the evaluation suggests that these deaths would have been even higher in the absence of MUP. Increases in alcohol-specific mortality since 2019 are observed across many other countries including all 4 nations of the UK,[55] other European countries[56], the US[57] and Canada[58] . It is widely observed, including by The Office for National Statistics , that these rises are likely in part to be the result of increased alcohol consumption during the Covid-19 pandemic.[59]
The University of Sheffield analysis estimated that alcohol-related harms are likely to increase as a result of the pandemic, and this pattern may be sustained if increases in consumption among harmful and hazardous drinkers persist over time.[60] We are yet to fully understand the impacts of the pandemic but it is clear that these initial observations on increased consumption and harms further strengthen the case for policies such as MUP in tackling alcohol harm.
Affordability of Alcohol
Alcohol is a commodity, and like any other commodity, its affordability affects its consumption. Affordability is important in relation to pricing policies to tackle alcohol harms. There is much evidence over the years showing that making alcohol more expensive reduces consumption[61], [62], [63] and, hence, reductions in alcohol harms follow[64].
Illustrative inflationary indices for considering uprating price level of MUP
A minimum unit price of 50ppu was set in May 2018. Table s 1 and 2 illustrate the notional level of MUP each year which would keep the initial price constant in real terms using different indices and relative to a selection of illustrative base years, all else being equal. Forecasts are also shown for the next two years where possible (see footnotes for further explanation on the limitations).
The Consumer Prices Index including owner occupiers’ housing costs (CPIH) is the most comprehensive measure of consumer price inflation, while the Consumer Prices Index (CPI) is a measure that is internationally comparable.
The Retail Price Index is also a measure of price inflation, but is based on a different methodology for calculating the changing purchasing patterns of consumers. While it is still published for legacy uses, it is no longer a national statistic and the ONS does not encourage its use, pointing to evidence that it is likely to overstate inflation.
GDP deflators can be viewed as a measure of general inflation in the domestic economy, i.e. not limited to consumer purchases. The GDP deflator reflects movements of hundreds of separate deflators for the individual expenditure components of GDP. The series allows for the effects of changes in price (inflation) to be removed from a time series, i.e. it allows the change in the volume of goods and services to be measured.
Alcohol Affordability Index is calculated using the retail price index, the alcohol price index and household disposable income. It is therefore a measure of the relative affordability of alcohol compared to other goods and taking into account changes in income. The alcohol affordability index is produced using UK-wide data. The alcohol affordability index is therefore weighted towards England and may not fully reflect any difference in these data between the constituent UK countries.
| Year | CPIH | CPI | RPI | GDP Deflator | AAI |
|---|---|---|---|---|---|
| 2012 | 50.0 | 50.0 | 50.0 | 50.0 | 50.0 |
| 2013 | 51.3 | 51.5 | 51.6 | 51.1 | 50.6 |
| 2014 | 52.2 | 52.5 | 53.0 | 51.7 | 51.4 |
| 2015 | 52.4 | 52.5 | 53.5 | 52.1 | 54.5 |
| 2016 | 52.8 | 52.7 | 54.4 | 53.1 | 54.9 |
| 2017 | 54.1 | 54.1 | 56.3 | 54.0 | 55.5 |
| 2018 | 55.4 | 55.4 | 58.2 | 55.0 | 57.4 |
| 2019 | 56.4 | 56.5 | 59.9 | 56.1 | 58.3 |
| 2020 | 56.9 | 56.9 | 60.5 | 59.6 | 57.8 |
| 2021 | 58.3 | 58.3 | 62.9 | 59.5 | 59.7 |
| 2022 | 63.0 | 63.8 | 70.3 | 62.7 | |
| 2023 | 67.7 | 68.8 | 77.8 | 64.5 | |
| 2024 | 68.2 | 69.4 | 79.7 | 65.7 |
Note: CPI, CPIH, RPI All based on monthly figures from June of each year, GDP deflators and AAI annual figures. Forecasts for CPI and RPI from OBR inflation forecasts, Q22023 to Q22024. CPIH 2024 uses CPI forecast.
| Year | CPIH | CPI | RPI | GDP Deflator | AAI |
|---|---|---|---|---|---|
| 2018 | 50.0 | 50.0 | 50.0 | 50.0 | 50.0 |
| 2019 | 50.9 | 51.0 | 51.4 | 51.1 | 50.8 |
| 2020 | 51.4 | 51.3 | 52.0 | 54.2 | 50.3 |
| 2021 | 52.6 | 52.6 | 54.0 | 54.1 | 52.0 |
| 2022 | 56.9 | 57.6 | 60.4 | 57.0 | |
| 2023 | 61.1 | 62.1 | 66.9 | 58.7 | |
| 2024 | 61.6 | 62.6 | 67.9 | 59.8 |
Note: CPI, CPIH, RPI All based on monthly figures from June of each year, GDP deflators and AAI annual figures. Forecasts for CPI and RPI from OBR inflation forecasts, Q22023 to Q22024. CPIH 2024 uses CPI forecast.
All indices are calculated at a UK level, with insufficient data to estimate a separate Scottish series. While prices fluctuate across regions as well as time, these national series are representative for the UK, so are likely to be strongly influenced by price activity in England. There will be some mechanical impact of the MUP on these series, to the extent that alcohol prices form one component of the basket. However, the weighting of alcoholic beverages in the CPIH basket is 0.02, and the changes to MUP affect the distribution of prices in one smaller part of the UK market, Scotland so, overall, MUP itself will have had negligible impact on inflation measures.
Figure 3 shows the long-term trends in alcohol affordability in the UK by considering the various factors that influence the overall affordability of different alcohol products including the price of alcohol products themselves; the price of other goods and services; and levels of income at the disposal of consumers.
These various factors are used to form the basis of what is known as the Alcohol Affordability Index, which tracks long-term trends in alcohol affordability in the UK. Figure 3, below, depicts these trends over recent decades in the UK.
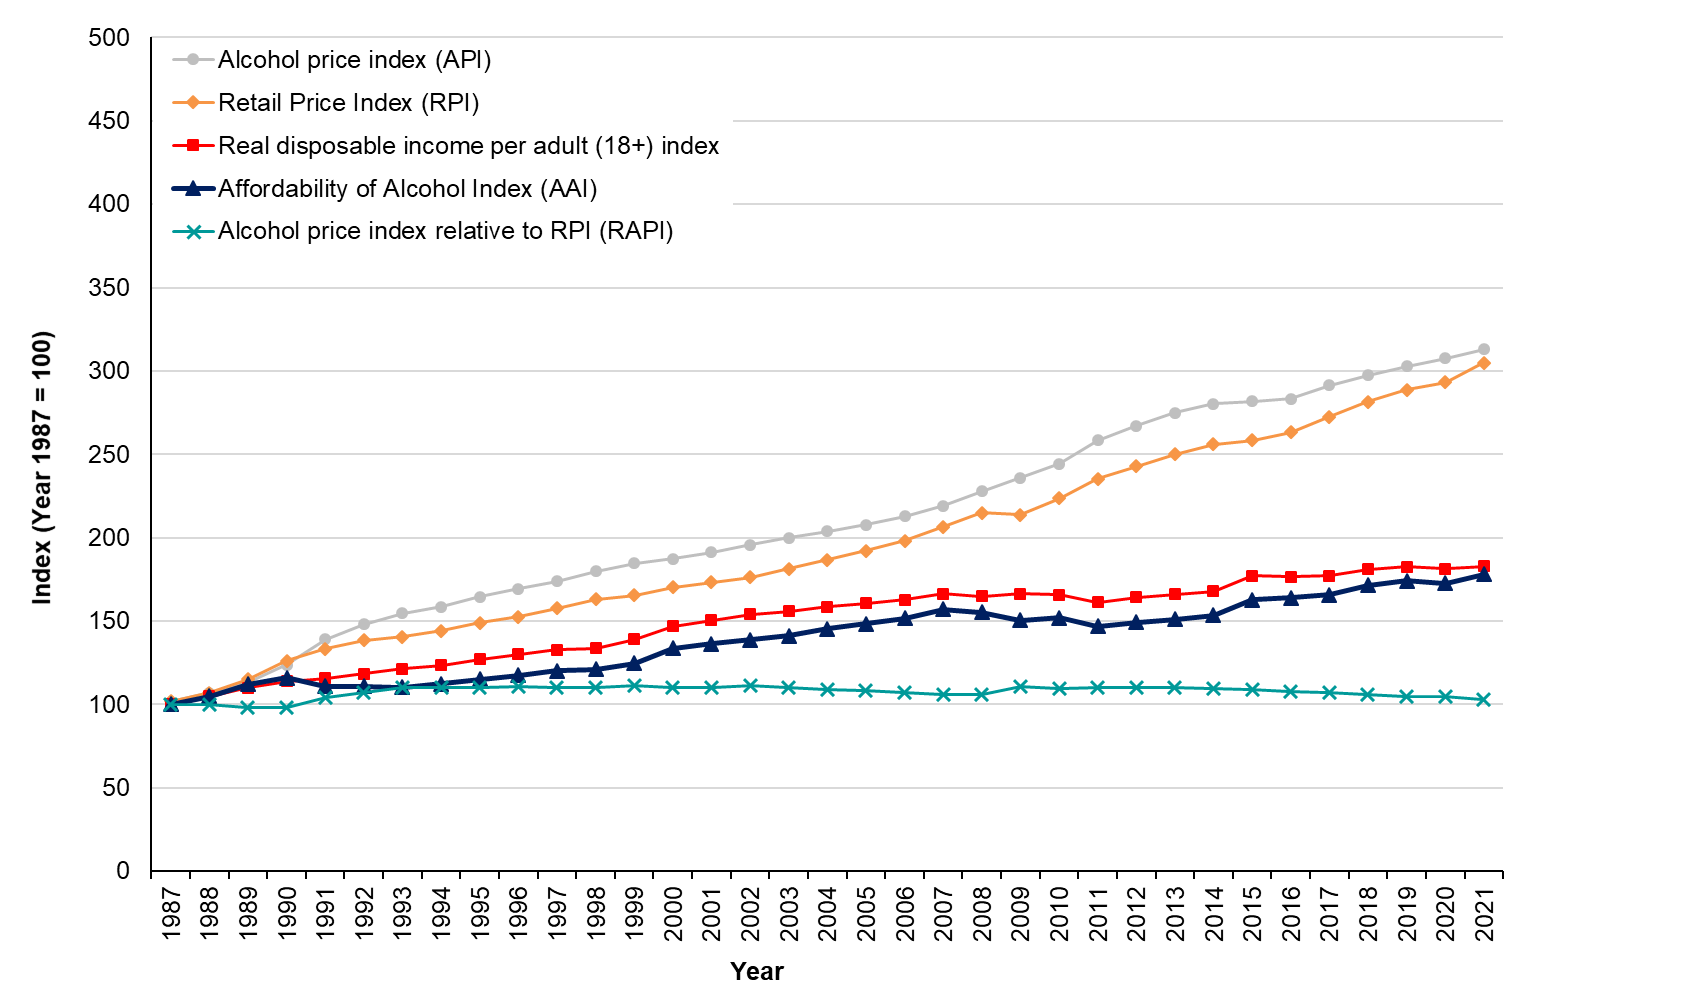
As Figure 3 illustrates, alcohol sold in the UK was 78% more affordable in 2021 than it was in 1987[65]. Alcohol affordability decreased slightly in 2020 due to a real-terms decrease in disposable income but increased again in 2021.
MUP is a price set in cash terms at a point in time and so will erode in real terms over time as inflation reduces the purchasing power of money. The inflationary indicators are relevant in considering a change to the level of MUP.
In terms of deciding the level at which to set the minimum unit price, Scottish Ministers have weighed up a number of factors. The decision to increase the price to 65ppu is based on a combination of the level of reduction of alcohol harms that would be achieved balanced against the level of interference in the market and the level of any unintended consequences.
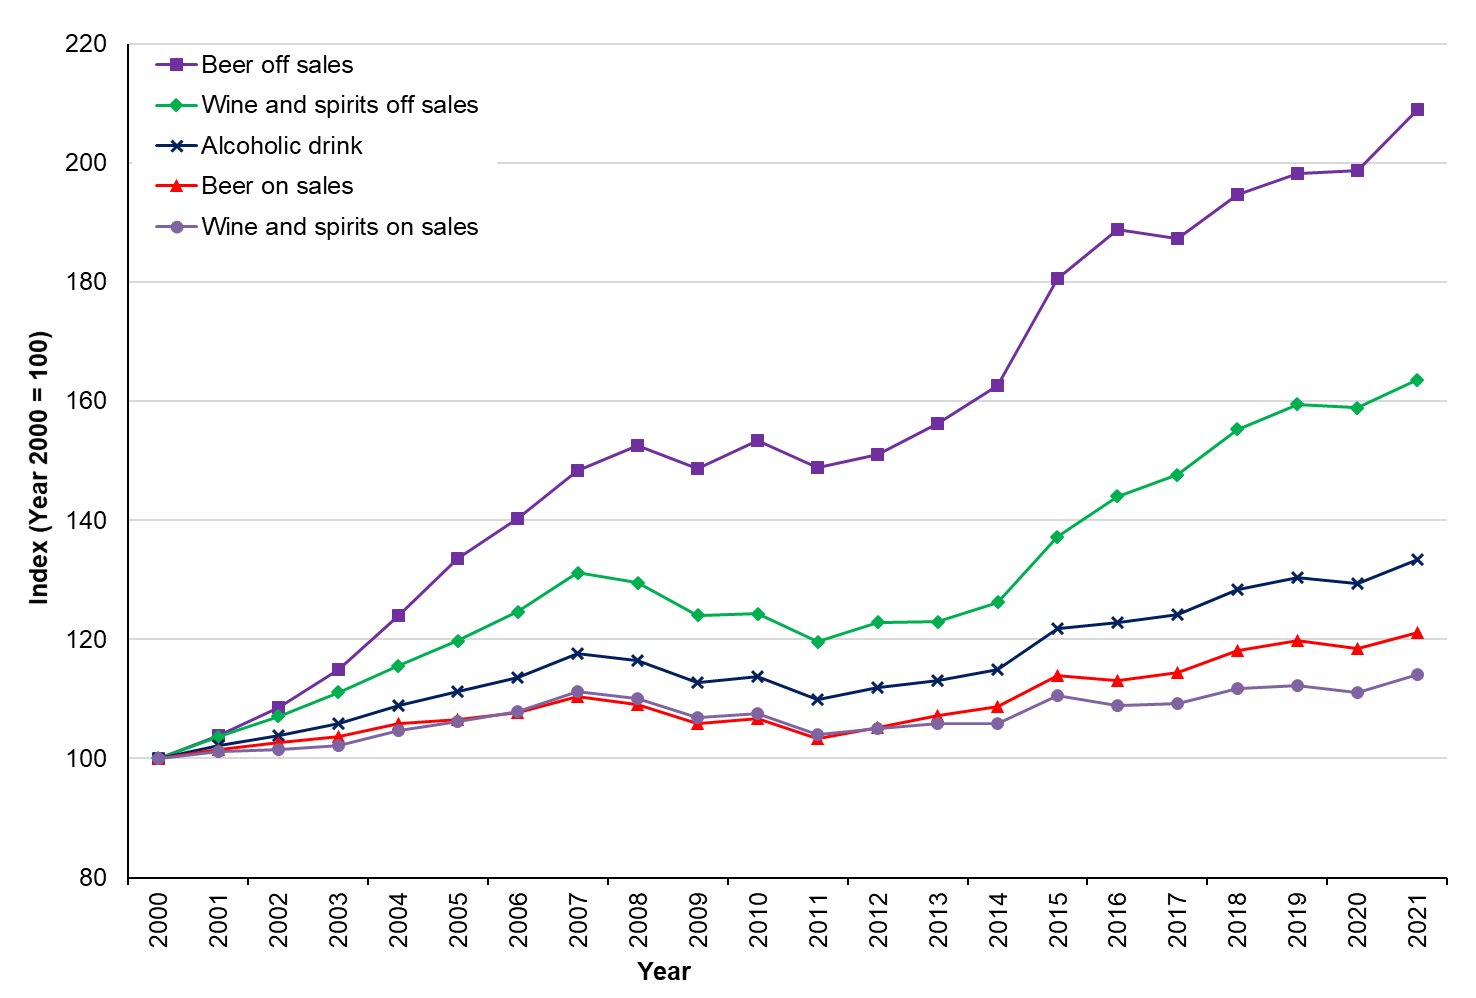
Within the alcohol market there has been a large variation in price changes across different product categories and purchasing channels (i.e. on-trade and off-trade). Figure 4 highlights overall change in alcoholic drink prices in both the on and off-trade, and drink specific price changes in the on and off-trade respectively, and shows that increases in affordability of alcoholic drinks is being driven by sales in the off-trade.
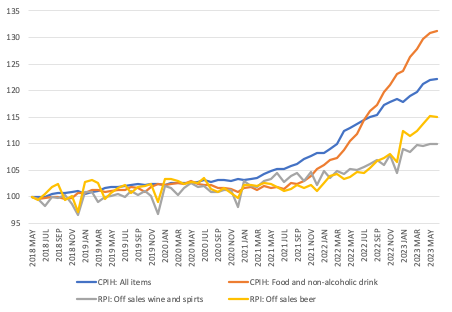
The cost crisis has also impacted on alcohol affordability with changes to both alcohol prices and to real incomes. As Figure 5 shows, in recent years alcohol prices have risen faster than in the past, but still at a lower rate than the general level of inflation, and food and non-alcohol in particular. Alcohol has therefore become cheaper relative to other goods and services.
Between 2018/19 and 2021/22, real disposable incomes for the lowest income households in Scotland fell (with the exception of the third decile), while it increased in all the higher income deciles. As everyone buys different things, inflation in reality is felt differently by different individuals and different groups of the population. The Office for National Statistics (ONS) estimate that CPIH annual inflation was 10.5% for low-income households in the UK compared to 9.1% for high-income households, in the year to October 2022. This is down to rising energy and food costs having more bearing on the inflation rate experienced by lower income households who spend a greater share of their expenditure on these[66].
However, any increase in alcohol prices needs to be seen in the context of those that drink. Non-drinkers in the most deprived groups will not be impacted as they do not purchase alcohol. The most recent Scottish Health Survey data (2022) found 25% in most deprived quintile were non-drinkers compared to 12% in least deprived quintile[67]. Prevalence of hazardous or harmful drinking levels was significantly higher among those living in the least deprived areas (28% in SIMD quintile 5) than among those living elsewhere (19-24%)[68].
Public Health Scotland conducted a rapid health impact assessment in December 2022 to explore the impact of the rising cost of living on health.[69] They reviewed evidence and reported that reduced affordability can be an effective mechanism to reduce alcohol consumption at a population level,[70] which has been seen in past recessions when overall levels of alcohol use have declined. However, they also point out that studies have found that harmful drinking has increased within specific sub-groups in times of recession. Risk factors include job loss and long term unemployment, and pre-existing vulnerabilities.[71]
After considering the different inflation indices, CPIH is used in this BRIA to uprate the levels of MUP analysed in the Sheffield model. This allows us to consider the modelled impacts (in 2019 prices) in the context of current prices. CPIH is an ONS National Statistic, and is also the index used in the Sheffield analysis to compare the impact of different potential MUP thresholds.
Impact on the alcoholic drinks market to date
There are four primary sources of data used throughout this document when considering alcohol prices:
Public Health Scotland (Monitoring and Evaluating Scotland’s Alcohol Strategy)
Public Health Scotland’s MESAS reports include the most comprehensive price information, for both the on and off-trade, covering years prior to MUP’s introduction up until 2021. This source includes the average unit price and price distribution data for Scotland and for England and Wales as a comparison. The price distribution data does not include sales from the discounters (Aldi, Lidl).
This data is used throughout the report to highlight trends in affordability and price distribution over time, and comparisons with prices in England and Wales.[72]
Scottish Government analysis of Circana Ltd data
The Scottish Government purchased Electronic Point of Sales off-trade sales data from Circana Ltd, a consumer behaviours market intelligence firm.
This data covers a more recent period and allows us to provide price distribution estimates for the full calendar year 2022. It also allows us to undertake a more detailed analysis of the top selling brands in Scotland rather than focus on drink categories. Data is presented as the average unit price over the year. Similar to the PHS data, this does not include sales from the discounters (Aldi, Lidl).
This data is used, primarily, in the costs and benefits section and competition assessment to provide the most recent high level price distribution and also brand level analysis of prices across different drink categories.
Tesco
A snapshot of prices from Tesco.com is also used. This provides product specific prices on a certain day in both Scotland and England for comparison. A similar analysis had been undertaken ahead of the introduction of MUP, and the price comparison between the years has been included if the product is still retailed (in the same size and strength).
Public Health Scotland MUP Evaluation: Products and Prices Study[73]
The study provides average sales value and volume for the Top 50 selling products in the convenience and supermarket sectors in 2017-18 ahead of MUP’s introduction. Scottish Government analysis of this data provides a weighted average price (i.e. across both convenience and supermarket channels) at brand level to allow a comparison with brand level average price level in 2022.
Alcohol prices
In 2021, the latest year for which comparable data is available from PHS, the average price per unit of alcohol in Scotland was 64p in the off-trade (an increase from 63p in 2020) and £2.04 in the on-trade. In England & Wales it increased from 59p in 2020 to 60p in 2021 in the off-trade. The average price paid per unit of alcohol (on- and off-trade sales combined) decreased sharply from 99p in 2019 to 77p in 2020 in Scotland; this was due to the dominance of off-trade sales during the COVID-19 pandemic. In 2021, this increased to 85p per unit, driven by the increase in on-trade sales compared to 2020. The trend in average combined price has been similar in England & Wales.
The latest alcohol sales data[74] (Table 3) shows how the average price of alcohol in the off-trade has changed since 2010. The highlighted figures show when the MUP Act was passed and when MUP was implemented. Prices of all types of alcohol increased except the ‘other’ category which represents less than 0.2% of the off-trade sales in both 2012 and 2018.
| £ per unit of alcohol | 2010 | 2011 | 2012 | 2013 | 2014 | 2015 | 2016 | 2017 | 2018 | 2019 | 2020 | 2021 |
|---|---|---|---|---|---|---|---|---|---|---|---|---|
| Total | 0.45 | 0.48 | 0.50 | 0.52 | 0.52 | 0.52 | 0.53 | 0.55 | 0.60 | 0.62 | 0.63 | 0.64 |
| Spirits | 0.43 | 0.46 | 0.48 | 0.51 | 0.52 | 0.52 | 0.51 | 0.53 | 0.57 | 0.59 | 0.60 | 0.60 |
| RTDs | 0.85 | 0.89 | 0.93 | 0.99 | 1.03 | 1.04 | 1.04 | 1.08 | 1.11 | 1.18 | 1.18 | 1.23 |
| Fortified Wines | 0.46 | 0.48 | 0.51 | 0.53 | 0.53 | 0.54 | 0.55 | 0.57 | 0.58 | 0.60 | 0.64 | 0.64 |
| Wine | 0.50 | 0.53 | 0.55 | 0.57 | 0.58 | 0.58 | 0.59 | 0.61 | 0.65 | 0.67 | 0.68 | 0.70 |
| Other | - | 0.63 | 0.70 | 0.82 | 0.85 | 0.81 | 0.63 | 0.73 | 0.66 | 0.75 | 0.74 | 0.59 |
| Cider | 0.36 | 0.38 | 0.39 | 0.41 | 0.40 | 0.41 | 0.42 | 0.44 | 0.52 | 0.57 | 0.57 | 0.57 |
| Perry | 0.26 | 0.28 | 0.28 | 0.29 | 0.29 | 0.29 | 0.28 | 0.29 | 0.39 | 0.45 | 0.44 | 0.44 |
| Beer | 0.41 | 0.45 | 0.47 | 0.48 | 0.47 | 0.47 | 0.48 | 0.51 | 0.55 | 0.58 | 0.59 | 0.59 |
Note: Off-trade retail sales estimates in 2011-2021 have been adjusted to account for lack of data from discount retailers. Copyright Nielsen/CGA 2022
In terms of specific products, Table 4 shows how the prices of a selection of popular alcoholic drinks have changed from immediately prior to MUP being implemented to June 2023. Some products that were selling below 50ppu before MUP was implemented, increased to 50ppu when MUP was implemented and are still retailing at 50ppu five years later, for example, Glen’s vodka (4th in top 5 selling off-trade brands in Scotland in 2021), own label (Tesco) vodka, whisky, gin and cider).
| Scotland | Scotland | Scotland | ||||
|---|---|---|---|---|---|---|
| 16-Feb-18 | 1-Feb-22 | 02-Jun-23 | ||||
| Price | per unit | Price | per unit | Price | per unit | |
| Cider | ||||||
| Tesco Crofter’s dry cider, 2l | 2.05 | 0.21 | 5.00 | 0.50 | 5.00 | 0.50 |
| Strongbow, 4x440ml | 4.00 | 0.45 | 3.96 | 0.50 | 4.55 | 0.58 |
| Strongbow dark fruits 4x440ml | 4.50 | 0.64 | 4.75 | 0.68 | 5.60 | 0.80 |
| Magners, 4x440ml | 3.75 | 0.47 | 3.96 | 0.50 | n/a | |
| Vodka and Gin (all 70cl) | ||||||
| Tesco Imperial vodka | 10.00 | 0.38 | 13.13 | 0.50 | 13.13 | 0.50 |
| Glen’s vodka | 12.50 | 0.48 | 13.13 | 0.50 | 13.13 | 0.50 |
| Smirnoff Red Label | 14.50 | 0.55 | 15.50 | 0.59 | 16.50 | 0.63 |
| Russian standard vodka | 14.50 | 0.52 | 14.50 | 0.55 | n/a | |
| Tesco London dry Gin | 11.00 | 0.42 | 13.13 | 0.50 | 13.13 | 0.50 |
| Gordon’s gin | 14.50 | 0.55 | 15.50 | 0.55 | 16.50 | 0.63 |
| Bombay Sapphire | 21.00 | 0.75 | 21.00 | 0.75 | 22.00 | 0.79 |
| Whisky (all 70cl) | ||||||
| Tesco Special Reserve | 12.50 | 0.45 | 14.00 | 0.50 | 14.00 | 0.50 |
| Bell’s | 15.00 | 0.54 | 15.50 | 0.55 | 16.50 | 0.59 |
| Whyte and MacKay | 15.00 | 0.54 | 14.00 | 0.50 | 15.50 | 0.56 |
| Famous Grouse | 15.00 | 0.54 | 15.00 | 0.54 | 16.50 | 0.59 |
| Glenfiddich single malt 12 yrs | 35.00 | 1.25 | 38.00 | 1.36 | 38.00 | 1.36 |
| Jack Daniels | 26.00 | 0.86 | 26.00 | 0.93 | 26.00 | 0.93 |
| Beer and lager | ||||||
| Tennents lager 4X440ml | 3.60 | 0.50 | 3.75 | 0.54 | 3.99 | 0.57 |
| Budweiser, 4x440ml | 4.10 | 0.47 | 4.19 | 0.52 | 4.75 | 0.60 |
| Stella Artois, 4x568ml | 5.10 | 0.45 | 5.46 | 0.53 | 5.75 | 0.56 |
| Carling, 4x440ml | 3.60 | 0.55 | 3.60 | 0.50 | 3.85 | 0.55 |
| Wine (75cl bottles) | ||||||
| Tesco Spanish white wine | 3.65 | 0.44 | 4.21 | 0.51 | n/a | |
| Brancott Estate Sauvignon | 9.50 | 0.96 | 9.50 | 0.97 | 9.50 | 1.02 |
| Blossom Hill Californian Rose | 5.25 | 0.63 | 5.00 | 0.61 | 5.00 | 0.61 |
| Tesco Rioja | 5.00 | 0.51 | 5.00 | 0.51 | n/a | |
| Hardy's Crest Cabernet Shiraz | 7.00 | 0.67 | 7.00 | 0.67 | 7.00 | 0.67 |
| Tesco Cote du Rhone | 4.30 | 0.42 | 5.25 | 0.52 | 8.00 | 1.02 |
| Isla Negra Seashore merlot | 5.00 | 0.53 | 5.00 | 0.56 | n/a | |
Brands in red text are the top 5 selling brands for take-home sales in Scotland from Kantar for the 52 weeks ending 4 September 2022. For some products, a matching price was either not available or not in stock at the time of accessing the website (2 June 2023).
Price distribution
Following the introduction of MUP at 50ppu, there has been a large increase in products priced in the 50ppu to 65ppu range to the extent that off-trade sales in this range for 2021 accounted for 62% of all off-trade sales[75] compared to 35% in England and Wales. Increases in price bands above 65ppu were much smaller and were in line with increases between previous years. England & Wales were used as a comparator and had a similar price distribution to Scotland prior to MUP being implemented. However, the price distribution in Scotland post-implementation was markedly different to that in England & Wales over the same time period (Figure 6)[76]
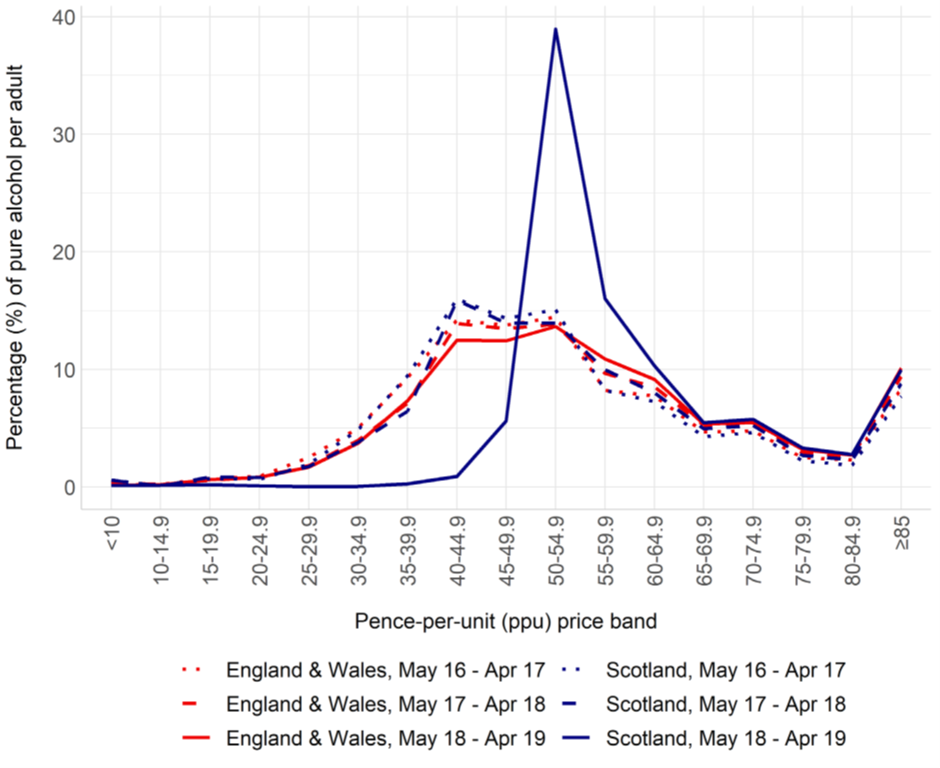
Figures 7 and 8 show the latest price distributions for the off-trade in Scotland, and for England and Wales for comparison purposes[77] since MUP was first introduced.
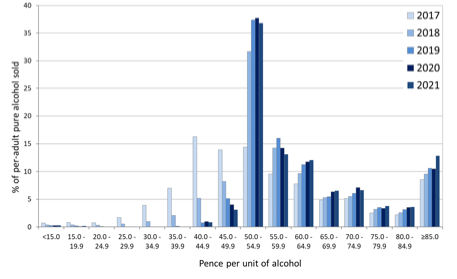
Figure 8 shows the price distribution in England and Wales. Wales introduced a 50ppu minimum price in March 2020 however, given the scale of sales in Wales compared to England, this will have had minimal impact on the combined figures.
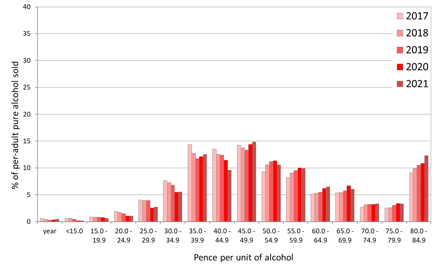
Table 5 shows how prices of drink types in the off-trade in Scotland were distributed in 5 pence steps.
| Pence per unit | sub 30 | <35 | <40 | <45 | <50 | <55 | <60 | <65 | <70 | <75 | <80 | <85 | Over 85 |
|---|---|---|---|---|---|---|---|---|---|---|---|---|---|
| Spirits | 0 | 0 | 0 | 1 | 1 | 58 | 70 | 77 | 80 | 85 | 88 | 91 | 100 |
| RTDs | 0 | 0 | 0 | 0 | 0 | 0 | 1 | 2 | 3 | 5 | 7 | 12 | 100 |
| Fortified Wines | 0 | 0 | 0 | 5 | 7 | 25 | 37 | 59 | 69 | 83 | 91 | 95 | 100 |
| Wine | 0 | 0 | 0 | 2 | 7 | 26 | 36 | 51 | 60 | 71 | 75 | 80 | 100 |
| Perry | 0 | 0 | 0 | 0 | 3 | 74 | 84 | 89 | 95 | 96 | 97 | 98 | 100 |
| Beers | 1 | 1 | 1 | 1 | 4 | 44 | 63 | 77 | 84 | 88 | 92 | 94 | 100 |
| Cider | 3 | 3 | 3 | 5 | 12 | 50 | 67 | 73 | 81 | 84 | 89 | 93 | 100 |
| Total | 1 | 1 | 1 | 2 | 5[78] | 41 | 55 | 67 | 73 | 80 | 84 | 87 | 100 |
For comparison, Table 6 shows the price distribution for England and Wales for 2021 which is the latest year comparable data is available from PHS/Nielsen.
| Pence per unit | sub 30 | <35 | <40 | <45 | <50 | <55 | <60 | <65 | <70 | <75 | <80 | <85 | Over 85 |
|---|---|---|---|---|---|---|---|---|---|---|---|---|---|
| Spirits | 0 | 0 | 5 | 28 | 42 | 57 | 68 | 75 | 80 | 84 | 88 | 90 | 100 |
| RTDs | 0 | 0 | 0 | 0 | 1 | 1 | 1 | 2 | 4 | 6 | 8 | 12 | 100 |
| Fortified Wines | 4 | 20 | 23 | 36 | 39 | 47 | 58 | 68 | 71 | 78 | 83 | 85 | 100 |
| Wine | 0 | 1 | 2 | 8 | 16 | 30 | 38 | 52 | 60 | 70 | 74 | 80 | 100 |
| Perry | 12 | 39 | 47 | 69 | 78 | 94 | 96 | 97 | 98 | 99 | 99 | 99 | 100 |
| Beers | 1 | 6 | 18 | 30 | 39 | 56 | 70 | 81 | 88 | 91 | 94 | 95 | 100 |
| Cider | 25 | 35 | 40 | 49 | 57 | 67 | 76 | 80 | 85 | 89 | 92 | 95 | 100 |
| Total | 2 | 5 | 11 | 23 | 33 | 48 | 58 | 68 | 75 | 81 | 84 | 88 | 100 |
The 2022 off-sales price distribution data based on Scottish Government analysis of Circana Ltd data[79] estimates that 37% of off-sales by volume were below 55ppu in 2022. The corresponding figures for 60ppu and 65ppu are 52% and 64% respectively.
For comparison, in Scotland, in 2017, prior to MUP being implemented, 45% of alcohol sold in the off-trade was below 50ppu[80].
As MUP is a price, the benefits of it will erode over time as inflation increases. However, alcohol prices have not, in general, risen in line with other food and drink prices so inflation for alcohol is lower which means it is more affordable relative to other goods.
4.2 Option Development (including sectors and groups affected)
Consideration of level of MUP going forward
In considering the level at which to set the minimum unit price, prices were banded at 5p intervals with options including:
- Do nothing and let the 2012 Act requirements sunset i.e. cease
- Continue MUP at 50ppu
- Continue MUP at a level lower than 50ppu
- Continue MUP at levels above 50ppu – this has been split into the ranges 55ppu to 65ppu and 70ppu to 80ppu.
In choosing a price, there are multiple factors that need to be considered and carefully balanced for each option, including:
- Level of health benefits we would like to achieve going forward
- Impact on business
- Level of unintended consequences.
The results from the evaluation inform an assessment of the level of health benefits achieved, the impacts on the alcoholic drinks market and alcohol businesses, and any unintended consequences of the policy. In choosing a price, there are various sources of evidence (both quantitative and qualitative) and factors to take account of, which are explored further in this section.
University of Sheffield modelling
The University of Sheffield Alcohol Research Group (SARG) were commissioned to undertake new modelling work to inform a review of the current 50ppu unit threshold[81]. SARG is a world-leading centre for research on alcohol harms. Their work is widely used by policymakers, practitioners, and the general public.
Their work has been published in leading academic journals, and it has been used to inform international policies on alcohol. SARG’s research and modelling was used to inform the development of MUP in Scotland, and has since been used for the development of the policy in Wales and the Republic of Ireland. Their research also supported the development of the UK government’s alcohol strategy, and they were the lead authors in the 2022 World Health Organization report on the potential value of Minimum Pricing[82].
It is important to note that SARG have used a new model ‘TAX-sim’, which builds on the previous model used for the 2016 MUP model ‘SAPM’ but is more sophisticated in certain key areas. The TAX-sim model is dynamic, meaning over time drinkers change category depending on their consumption (i.e. harmful drinkers will move to the moderate drinker category if the modelled change shows their consumption is reduced to less than 14 units a week).
The 2016 SAPM model was static, meaning this change in category wasn’t observed and therefore the results from the two sets of models should not be directly compared as there are important distinctions in how the results should be interpreted.
The modelling uses 2019 as the baseline year. It takes account of the initial impacts of MUP at 50ppu and is prior to any impact COVID-19 has had on consumption and harms. The ‘control arm’ of the model is that this 50ppu remains in place, with the 50p threshold being uprated each year in line with inflation using the CPIH. As the model assumes that the MUP level increases in line with inflation annually the analysis set out below focuses, where possible, on the year one results given that, at this point in time, consideration is only being given to a single change in the price level.
When modelling changes to the MUP threshold, it is assumed these changes are introduced at the start of 2019 and that any new threshold is also uprated in line with CPIH to keep ‘prices constant in real terms’. This should be taken into account when impacts beyond the initial year are presented.
What the model does not do:
- it does not directly provide a comparison of the current situation (e.g. MUP currently at 50ppu in cash terms) and proposed prices, but rather a comparison against 50ppu in 2019
- it does not include costs and does not estimate revenues/ profits to the industry or how these are spread across the supply chain
- it does not report on the ‘distortion to the industry’ in terms of how different product types or producer businesses are impacted to varying degrees by different MUP levels.
- it does not assume any long-term underlying trends in alcohol consumption due to volatility in recent trends making it harder to identify what will happen to underlying behaviours in the absence of policy changes. However, the dynamic nature of the model means that it does capture a change in per capita consumption over time as the age profile of the population shifts (e.g. 40 year olds in 10 years’ time will drink the same amount as current 40 year olds, but there will be a change in the number of 40 year olds). But if there are more or fewer 40 year olds compared to other age groups that drink more or less, then the overall population mean consumption will shift. In practice, the net effect of this shift in the population structure is a gradual drift downwards in mean consumption, all else being equal.
With regard to inflation, the model uprates the MUP levels using CPIH inflation from their 2019 prices in order to keep prices constant in real terms. In practice it is not possible to have a single inflating mechanism that would in reality keep all the impacts equal due to the number of variables impacting affordability, often changing in different directions. As is common, a single index has been used for model purposes and to keep interpretation and findings understandable.
The modellers used different inflation indices to uprate the minimum unit price to see what difference it might make. The results showed that as the real terms value of the minimum unit price falls, mean alcohol consumption increases; and when the MUP level is closely aligned to inflation (e.g. CPIH), consumption remains at similar levels to 2019.[83]
The dynamic nature of this model means that drinkers move drink categories depending on how much they reduce or increase their consumption. At prices below 50ppu at 2019 prices (the control arm), the numbers of hazardous and harmful drinkers increases and at prices above 50ppu, the number of moderate drinkers increases as hazardous and harmful drinkers move down categories (Table 7).
| MUP level (ppu) | Moderate drinkers | Hazardous drinkers | Harmful drinkers |
|---|---|---|---|
| 2019 Number of baseline drinkers | 2,546,719 | 878,934 | 143,426 |
| 40 | -24,311 | +8,067 | +16,244 |
| 45 | -15,045 | +5,233 | +9,812 |
| 50 | 0 | 0 | 0 |
| 55 | +27,146 | −15,742 | −11,403 |
| 60 | +68,050 | −41,406 | −26,644 |
| 65 | +112,159 | −70,012 | −42,147 |
| 70 | +163,246 | −108,235 | −55,011 |
| 75 | +218,868 | −148,943 | −69,925 |
| 80 | +279,570 | −196,540 | −83,051 |
Note: Due to these changes in the number of individuals in each drinker group there are complexities in interpreting the modelling results by drinker group, which is particularly acute in the resulting impact on the moderate category (Figure 9)
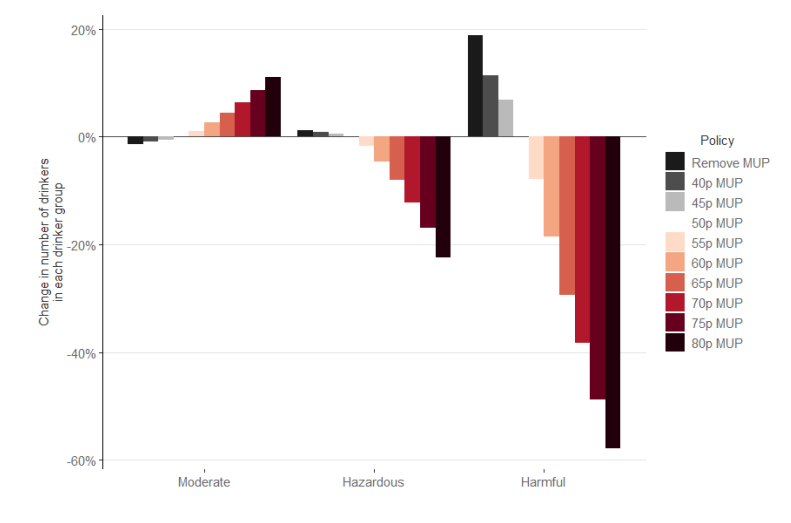
Table 8 summarises the estimated results for the price options modelled relative to 50ppu i.e. the current level of MUP: removal of MUP (row 1), MUP at 40ppu through to 80ppu in 5p steps, all in 2019 prices (column 2).
So, for example, for a 55ppu (in 2019 prices) the model estimates a further reduction of consumption by 2.7% than what was estimated at 50ppu. CPIH is then used to uprate the 2019 prices to 2023 prices (column 3).
Using this same calculation 50ppu in 2019 prices is equivalent to 60ppu in 2023 using CPIH.
| Row # | MUP Level (ppu) | Consumption | Deaths | Hospital Admissions | Years of Life Lost (YLLs) | NHS costs – 5 years cumulative | Hazardous drinkers | Harmful drinkers | Spending | Tax and duties | Retail Revenue | Share of off-sales impacted* | |
|---|---|---|---|---|---|---|---|---|---|---|---|---|---|
| 2019 Prices | 2023 Prices (CPIH) | ||||||||||||
| 1 | 0 | 0 | 5.4% | 131 | 1,751 | 4,123 | £10.0m | 10,684 | 26,841 | 0.6% | 2.4% | -0.4% | n/a |
| 2 | 40 | 48 | 3.4% | 82 | 1,125 | 2,654 | £6.5m | 8,067 | 16,244 | 0.4% | 1.6% | -0.2% | n/a |
| 3 | 45 | 54 | 2.2% | 49 | 654 | 1,512 | £3.8m | 5,233 | 9,812 | 0.2% | 1.0% | -0.2% | 37% |
| 4 | 50 | 60 | 0% | 0 | 0 | 0 | £0m | 0 | 0 | 0% | 0% | 0% | 52% |
| 5 | 55 | 66 | -2.7% | -60 | -774 | -1,828 | -£5.0m | −15,742 | −11,403 | -0.4% | -1.4% | 0.1% | 64% |
| 6 | 60 | 72 | -6.7% | -130 | -1,732 | -4,008 | -£10.9m | −41,406 | −26,644 | -1.1% | -3.6% | 0.2% | 73% |
| 7 | 65 | 78 | -10.7% | -197 | -2,696 | -6,197 | -£17.4m | −70,012 | −42,147 | -2.0% | -5.9% | 0.0% | 80% |
| 8 | 70 | 84 | -15.3% | -278 | -3,779 | -8,651 | -£24.2m | −108,235 | −55,011 | -3.2% | -8.6% | -0.4% | 87% |
| 9 | 75 | 90 | -19.9% | -347 | -4,844 | -11,064 | -£31.3m | −148,943 | −69,925 | -4.6% | -11.4% | -1.0% | >87% |
| 10 | 80 | 96 | -24.6% | -435 | --6,015 | -13,644 | -£38.7m | −196,540 | −83,051 | -6.3% | -14.5% | -2.0% | >87% |
Notes: Scottish off-sales compiled by Public Health Scotland, based on volume of pure alcohol sold under 5p price steps (2023 MUP level rounded to nearest 5p price step). For 55ppu, 60ppu, 65ppu estimates are based on Scottish Government analysis of Cricana Ltd data for average off-trade prices in 2022. 45% of off-sales below 50ppu in 2017 prior to introduction of MUP.[84]
| 2023 Price | 2019 Price | 2019 Price (Rounded to 5p) |
|---|---|---|
| 40 | 33 (below 40ppu modelling) | -n/a |
| 45 | 38 (below 40ppu modelling) | -n/a |
| 50 | 42 | 40 |
| 55 | 46 | 45 |
| 60 | 50 | 50 |
| 65 | 54 | 55 |
| 70 | 59 | 60 |
| 75 | 63 | 65 |
| 80 | 67 | 65 |
Option 1: Do nothing and let the MUP requirements cease
The ‘do-nothing’ option would see the sunset clause take effect and there would no longer be a minimum unit price for alcohol in Scotland from 1 May 2024.
Retailers in Scotland would remain subject to any other relevant duties, regulations and licensing conditions. However there would no longer be any requirement to sell alcoholic beverages at or above a minimum price level based on the alcohol content.
Businesses were asked to consider the impact of changes to MUP on different products and any potential positive or negative impacts this would have on revenue, profits, and additional costs. In relation to this option, respondents were generally neutral regarding the removal of MUP and generally agreed that treatment services were seen as a more targeted measure for helping those with alcohol dependence and MUP alone was too blunt a tool.
The Sheffield Model estimates that, relative to the impacts of 50ppu in 2019 shortly after it was first introduced, removing MUP would lead to an increase in average alcohol consumption across drinkers, increasing by 5.4%. This increased consumption shifts individuals up drinking categories, with an increase of 10,684 hazardous drinkers and 26,841 harmful drinkers estimated.
Increased alcohol consumption from the removal of MUP would be expected to result in increased health harms and costs to the NHS. The removal of MUP is estimated to lead to an increase of 131 deaths in the first year after it had expired . The increased mortality is estimated to be concentrated in the most deprived SIMD quintiles.
Hospital admissions would also be expected to increase if MUP was removed. At the population level, it is estimated there would be an additional 1,751 admissions in the first year after it had expired.
The removal of MUP is estimated to increase alcohol consumption and hence alcohol harms, which is not consistent with our policy aim of reducing alcohol-related harm. This option is, therefore, not being taken forward.
Option 2: Continue MUP at 50ppu
Continuing MUP with a 50ppu price floor would mean that retailers would be required to continue to retail alcohol at or above the current MUP level in Scotland.
The PHS evaluation reported that on the whole the industry adapted to the requirements of MUP swiftly, with the necessary processes put in place in a ‘step change’ which became business as usual[85]. Maintaining the price at its current level of 50ppu would mean retailers would not be required to make any changes to prices.
While the minimum unit price would remain at 50ppu in cash terms, its impact on the affordability of alcohol has already decreased since its introduction in 2018 - i.e. over the period that the PHS evaluation has been conducted. The evaluation has shown that 50ppu has been effective in reducing alcohol-related harms however, as time passes, its effectiveness is likely to decrease as the cash price level is eroded by inflation in real terms. The PHS evaluation final report flagged this as a particular consideration for policy-makers: the evaluation of MUP was conducted at 50ppu and, if MUP continues, it is likely benefits realised will only continue if the value of MUP compared to other prices and income is maintained. The report also mentions that increasing the level of MUP would potentially increase the positive impact on consumption and harms, but that any negative or harmful impacts might also increase.[86]
MUP is still having an impact on the market but this is likely to diminish as time goes on. Using England and Wales as a comparator, in 2021, 33% of alcohol products in the off-trade were sold at less than 50ppu; in 2020, the equivalent proportion was 34%; and in 2019, it was 38%[87]. This shows that as alcohol prices increase over time, the proportion of products impacted by MUP at 50ppu reduces.
Businesses were asked to consider the impact of changes to MUP on different products and any potential positive or negative impacts this would have on revenue, profits, and additional costs. In relation to this option, feedback included the impact of the current level of 50ppu which seems to have had minimal impact on businesses, excluding cider. Respondents in general were not in favour of an increase for MUP.
The University of Sheffield report illustrates how the real terms value of 50ppu MUP decreases over time when it is not uprated for inflation[88]. Figure 10 shows scenarios that Sheffield have modelled for impacts of different uprating methods. This highlights how the real value of the MUP level would fall over time if not uprated (Scenario 1) compared to uprating it for inflation to return it to its original level and then maintaining it at that going forwards (either continually (Scenario 2) or in period steps (Scenario 3).
Scenario 4 illustrates that if the MUP level was uprated from its current price going forward, rather than first uprating it to reflect the price changes since 2018, there would be a permanent drop in the real value of MUP going forward.
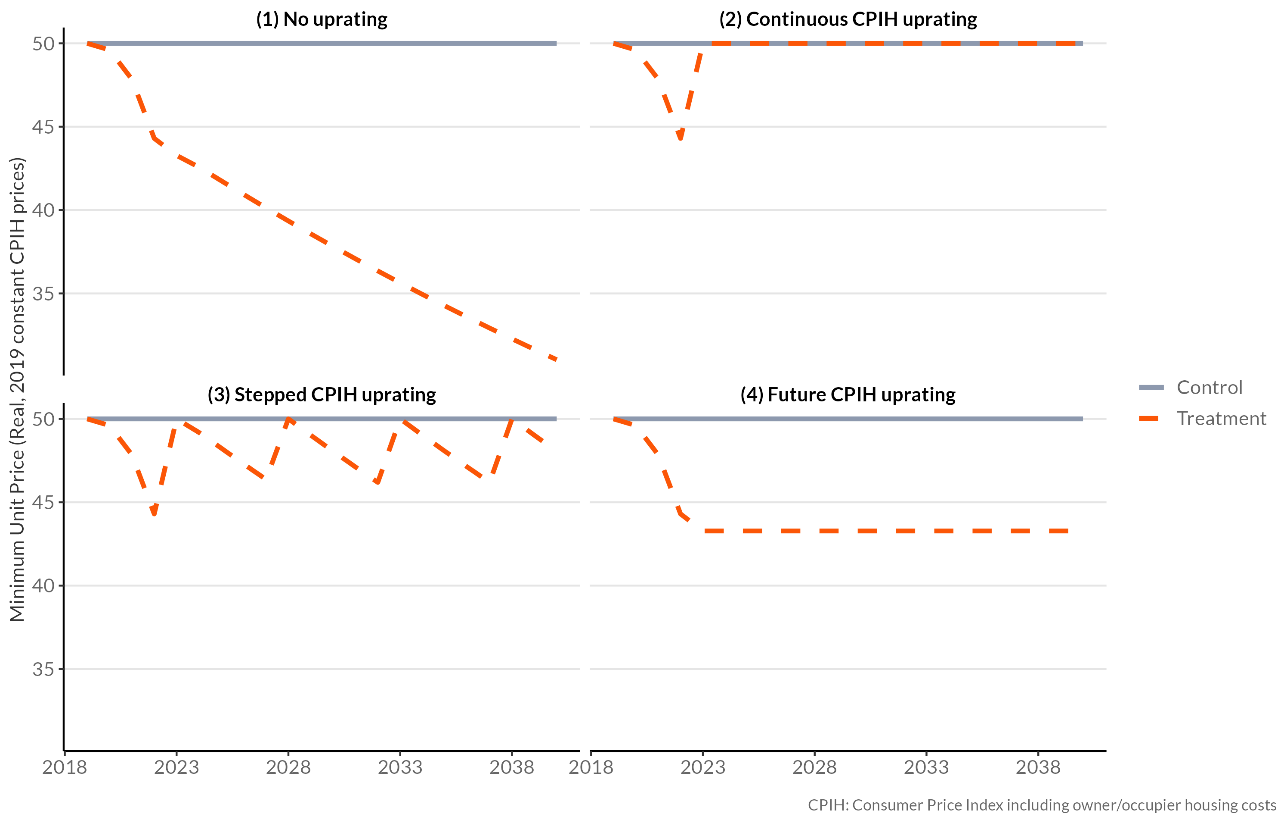
Note: The grey solid line represents the control case of 50ppu MUP increasing in line with CPIH inflation annually after 2019, the red dashed line illustrates MUP remaining at 50ppu in cash terms from 2019 onwards).
Maintaining MUP at its current level of 50ppu in cash terms is estimated to increase alcohol consumption and hence alcohol harms, because alcohol would become more affordable relative to other products due to inflation. This is not consistent with the policy aim of increased reduction in alcohol-related harm. In order to maintain, and to enhance, the effectiveness of MUP going forward, Scottish Ministers are agreed that the current level should be increased.
This option is, therefore, not considered to meet the aim of the policy going forward.
Option 3: Continue MUP at a level lower than 50ppu
Retailers would be required to continue to retail alcohol according to a MUP level in Scotland, but that level would be lower than the current 50ppu.
This MUP level would represent a decrease in both cash and real terms compared to its introduction in 2018. As MUP sets a minimum level for prices, in theory, prices at or just above 50ppu would not need to change. It is likely, however, that some of those products which are currently constrained by the current 50ppu MUP level would decrease to the new lower level. Products, including different package sizes, which are not sold in Scotland currently due to the MUP might be reintroduced at a price lower than 50ppu.
The share of products potentially being retailed for a lower price would depend on the level of the lower MUP selected, however, the share would be lower than that impacted by a 50ppu and would decrease the lower the level of MUP becomes. Using England and Wales as a comparator, currently (2021) 33% of off-trade alcohol sales are less than 50ppu. If MUP were 45ppu, 23% of off-trade alcohol sales would be impacted in 2021; and at 40ppu, the equivalent proportion would be 11%[89]. This would result in increased alcohol consumption and hence increased alcohol harms.
Businesses were asked to consider the impact of changes to MUP on different products and any potential positive or negative impacts this would have on revenue, profits, and additional costs. In relation to this option, respondents were generally neutral regarding a decrease or removal of MUP.
A lowering of the level of MUP in cash terms is estimated to increase alcohol consumption and hence alcohol harms, which is not consistent with the policy aim of reducing alcohol-related harm.
Option 4: Continue MUP at levels above 50ppu
Setting a new price provides the opportunity to take account of the significant changes which have taken place since MUP was first introduced, including the high levels of inflation and the ongoing cost crisis. It is also an opportunity for the Scottish Ministers to consider an appropriate new price that will meet the ambition of reducing alcohol-related harm.
Using the latest available evidence, data and modelling allows for consideration of the most appropriate price level to be selected based on the balance of the aims of the policy and the potential negative impacts on consumers, the industry, including across different product types and businesses, and potential wider unintended consequences.
A price level above 50ppu would allow the real terms value of MUP to return towards or above its original level.
Based on the equivalent 2019 prices in the Sheffield Model inflated into current cash terms using CPIH, the following tables estimate the potential impacts on consumption, spending and health harms.
Prices above 50ppu have been split into two categories: 55ppu to 65ppu; and 70ppu to 80ppu.
Option 4a: Continue MUP, increasing to 55ppu, 60ppu or 65ppu
PHS MUP evaluation results
Overall, the evaluation of MUP at 50ppu, introduced in 2018, supports that MUP has had a positive impact on health outcomes, namely a reduction in alcohol-attributable deaths and hospital admissions, particularly in men and those living in the most deprived areas, and therefore contributes to addressing alcohol-related health inequalities. There was no clear evidence of substantial negative impacts on the alcoholic drinks industry, or of social harms at the population level
There are potential unintended consequences from increasing the price level of MUP from 50ppu, including potential for shifts to illicit alcohol or drugs consumption, cross border purchasing, and increased crime. Generally, the potential for these to materialise is likely to increase as MUP levels increase as greater incentives are created to obtain ‘cheaper’ alcohol or substitutes. However, the Scottish Ministers are balancing these potential impacts with seeking to further reduce alcohol-related harm.
Sheffield Alcohol Research Group (SARG) modelling results
Table 10 estimates how a 55ppu, 60ppu and 65ppu (in 2023 prices) would likely affect consumption and alcohol deaths and alcohol hospital admissions relative to the 2019 baseline of 50ppu. With 60ppu in 2023 being the equivalent of 50ppu in 2019 in real terms, the interpretation of the modelling results is that this is the price level which would most closely represent the impacts of the introduction of MUP at 50ppu in 2018. A price above 60ppu would likely lead to a greater reduction in consumption and a greater reduction in alcohol deaths and alcohol hospital admissions compared to the original impacts. For a price below 60ppu, it would be the opposite, with likely increased consumption and health harms relative to when MUP was introduced.
It is important to note for results past year one that the modelling assumes that the MUP price be kept constant in real terms through increasing with inflation each year.
| MUP level (2023 price) | 55ppu | 60ppu | 65ppu |
|---|---|---|---|
| Consumption (Y1) | +2.2% | 0% | -2.7% |
| All cause deaths (Y1) | +49 | 0 | -60 |
| All cause deaths (Y20) | +3 | 0 | -22 |
| Alcohol specific deaths (Y1) | +28 | 0 | -34 |
| Alcohol specific deaths (Y20) | +15 | 0 | -35 |
| Admissions (Y1) | +654 | 0 | -774 |
| Admissions (Y20) | +221 | 0 | -517 |
Tables 11 to 14 summarise the impact MUP at 55ppu to 65ppu would have on different drinker groups and by SIMD. This is relevant for the more targeted element of the aim of MUP which is to reduce consumption, and hence harms, among hazardous and harmful drinkers.
The absolute changes in the number of drinkers in each group highlight the impact of the policy in reducing the number of hazardous and harmful drinkers as the level of MUP increases.
| MUP level (ppu, 2023 prices) | Moderate drinkers | Hazardous drinkers | Harmful drinkers |
|---|---|---|---|
| 2019 Number of baseline drinkers | 2,546,719 | 878,934 | 143,426 |
| 55 | -15,045 | +5,223 | +9,812 |
| 60 | 0 | 0 | 0 |
| 65 | +27,146 | −15,742 | −11,403 |
It should be noted that the increase in drinkers in the moderate category when the MUP is increased in real terms is a result of drinkers who were previously drinking at hazardous and harmful levels decreasing consumption and therefore moving into the moderate group from a higher drinking group. Due to these changes in the number of individuals in each drinker group there are complexities in interpreting the modelling results by drinker group, which is particularly acute in the resulting impact on the moderate category. Further details can be found in the University of Sheffield report's Annex.
| Consumption | 55ppu | 60ppu | 65ppu |
|---|---|---|---|
| SIMD Q1 (least deprived) | +1.9% | 0% | -2.4% |
| SIMD Q2 | +1.9% | 0% | -2.3% |
| SIMD Q3 | +2.2% | 0% | -2.7% |
| SIMD Q4 | +2.4% | 0% | -3.1% |
| SIMD Q5 (most deprived) | +2.7% | 0% | -3.4% |
These estimates show that raising the MUP threshold above 50ppu in real terms (i.e. above 60ppu in 2023) is estimated to reduce alcohol consumption, with the largest reductions coming from those in the most deprived group, compared to the control.
| Deaths (numbers) | 55ppu | 60ppu | 65ppu |
|---|---|---|---|
| SIMD Q1 (least deprived) | +7 | 0 | -5 |
| SIMD Q2 | +6 | 0 | -6 |
| SIMD Q3 | +8 | 0 | -12 |
| SIMD Q4 | +8 | 0 | -15 |
| SIMD Q5 (most deprived) | +21 | 0 | -22 |
These results highlight that increasing MUP is estimated to have a greater reduction on mortality in the higher (most deprived) SIMD groups compared to the less deprived groups.
Table 14 shows the estimated impact of different levels of MUP on hospital admissions by SIMD group.
| Admissions (numbers) | 55ppu | 60ppu | 65ppu |
|---|---|---|---|
| SIMD Q1 (least deprived) | +66 | 0 | -76 |
| SIMD Q2 | +70 | 0 | -80 |
| SIMD Q3 | +97 | 0 | -131 |
| SIMD Q4 | +138 | 0 | -192 |
| SIMD Q5 (most deprived) | +284 | 0 | -296 |
As with the mortality results, increasing MUP is generally estimated to result in a greater reduction in admissions for those in more deprived groups.
| 55ppu | 60ppu | 65ppu | |
|---|---|---|---|
| Change in NHS Hospital costs (£m) | |||
| Y1-5 | +3.8 | 0 | -5.0 |
| Y1-20 | +9.0 | 0 | -16.4 |
Table 15 shows the impact of each modelled MUP policy on NHS hospital costs, in comparison to the control of 50ppu in 2019. This table presents the cumulative cost changes over the first 5 years of the policy and over the full 20 year modelled period (noting that the modelling is based on the assumption that the MUP level increases in line with CPIH each year).
As well as the health impacts of different levels of MUP, the impact on business must also be considered when deciding a potential preferred price range. Table 16 shows the modelled impact on the on and off-trade retailer revenues – again in comparison to the control of 50ppu in 2019.
| Retailer revenue | 55ppu (£million) | 55ppu % | 60ppu (£million) | 60ppu % | 65ppu (£million) | 65ppu % |
|---|---|---|---|---|---|---|
| Total | -7.7 | -0.2% | 0 | 0 | +4.4 | +0.1% |
| Retailer revenues off-trade | -19.0 | -2.4% | 0 | 0 | +16.5 | +2.1% |
| Retailer revenues on-trade | +11.3 | +0.4% | 0 | 0 | -12.1 | -0.5% |
These figures illustrate that, in total, retailers’ revenue is modelled to increase for a MUP of 65ppu and decrease for a MUP of 55ppu, relative to the control group. In breaking it down, the off-trade retailers are modelled to increase their revenue for a 65ppu while decreasing if MUP was 55ppu relative to the control. It is the opposite for the on-trade, with revenues estimated to decrease relative to the control at 65ppu, and rise for 55ppu.
Despite the on-trade unlikely to be affected directly by a minimum unit price in this range, the estimated changes in on-trade revenues comes about due to drinkers switching between products and drinking channel which bring in different levels of revenue to retailers.
Table 17: Modelled impacts on exchequer revenue from alcohol taxes in year 1 compared to control of 50ppu in 2019 (absolute change vs. control and relative vs. control)
| Exchequer revenue | 55ppu (£million) | 55ppu% | 60ppu (£million) | 60ppu% | 65ppu (£million) | 65ppu% |
|---|---|---|---|---|---|---|
| Total | +18.8 | +1.0% | 0 | 0 | -25.7 | -1.4% |
| Off – trade | +14.8 | +1.6% | 0 | 0 | -21.4 | -2.3% |
| On – trade | +3.9 | +0.4% | 0 | 0 | -4.4 | -0.5% |
Increasing the MUP threshold above 60ppu is estimated to lead to reductions in alcohol tax revenue compared to the control of 50ppu in 2019. These changes are largest in revenue from the off-trade, as it is off-trade prices which are directly impacted by changes in the MUP threshold, while on-trade prices are generally higher than the threshold levels being modelled.
Unlike retailer revenues, exchequer revenues show a uniform decline in revenues for increases in the level of MUP in general. This reflects that the duties are primarily charged on the volume of alcohol sold which declines as the MUP level increases, whereas in the retail sector the higher price paid for products which would have been under the threshold more than offsets the fall in consumption until a tipping point when product switching behaviour leads to lower revenue generating products being sold, particularly in the off-trade.
Affordability of alcohol, including cost crisis
As outlined previously, alcohol prices have risen faster than in the past, but still at a significantly lower rate than the general level of inflation and food and non-alcohol in particular. Alcohol has therefore become cheaper relative to other goods and services which would increase demand for it, all else being equal.
As alcohol has not risen in line with CPIH, it makes it more affordable relative to other goods, which can lead to increased consumption and hence harms. The most generally accepted inflationary index of CPIH used to uprate the 50ppu price would result in an equivalent level of MUP of around 60ppu in 2023. However, it is clear, for instance from the National Records of Scotland publication on alcohol-specific deaths published on 29th August 2023, that alcohol harm in Scotland remains high. The Scottish Ministers are therefore agreed that the minimum unit price should be increased, in order to increase the public health benefits of the policy.
Price distribution of alcohol, including how the market adapted to a MUP of 50ppu being introduced
The overall price distribution of alcohol has shifted up relatively more slowly than price rises for other goods. It is now the case that alcohol has become generally cheaper relative to other goods, increasing its affordability.
Table 18 shows the cumulative percentage of alcohol sold below 55ppu, 60ppu and 65ppu for both Scotland and England and Wales.
| Pence per unit (%) | Scotland <55ppu | E&W <55ppu | Scotland <60ppu | E&W <60ppu | Scotland <65ppu | E&W <65ppu | |
|---|---|---|---|---|---|---|---|
| Spirits | 58 | 57 | 70 | 68 | 77 | 75 | |
| RTDs | 0 | 1 | 1 | 1 | 2 | 2 | |
| Fortified Wines | 25 | 47 | 37 | 58 | 59 | 68 | |
| Wine | 26 | 30 | 36 | 38 | 51 | 52 | |
| Perry | 74 | 94 | 84 | 96 | 89 | 97 | |
| Beers | 44 | 56 | 63 | 70 | 77 | 81 | |
| Cider | 50 | 67 | 67 | 76 | 73 | 80 | |
| Total | 41 | 48 | 55 | 58 | 67 | 68 |
Table 19 shows the extent of the bunching of prices in the 5p bands in the 50ppu to 65ppu range, with off-trade sales accounting for 62% of all off-trade sales[90] for 2021 in Scotland compared to 35% for England and Wales. The greatest difference between Scotland, and England and Wales is in the 50 to 55ppu band, then there is a reducing tail for the other two bands.
| 50-55ppu | 55-60ppu | 60-65ppu | 50-65ppu | |
|---|---|---|---|---|
| Scotland | 35% | 14% | 12% | 61%[91] |
| England and Wales | 15% | 10% | 10% | 35% |
Above 65ppu, increases were much smaller and were in line with increases between previous years in Scotland, and in 2021 for England and Wales. After 65ppu, the figures are only 1% apart (see next section on price ranges 70ppu to 80ppu).
Alcohol prices at product level
As part of the consideration of price, consideration has been given to what has happened to alcohol prices for specific products. In 2021, the latest year for which detailed price data is available, the average price per unit of alcohol in Scotland was 64p in the off-trade (an increase from 63p in 2020) and £2.04 in the on-trade. When MUP of 50ppu was implemented, the average price per unit of alcohol in the off-trade in Scotland was 60p.
The current level of MUP at 50ppu impacted on the lower end of the market, as intended, and alcohol that was particularly cheap relative to strength was no longer sold at low prices (as little as 20ppu). A price increase within the range of 55ppu to 65ppu would increase the prices of cheaper cider, cheaper beer, gin, vodka and whisky but not impact on the more expensive products in the market.
In terms of specific products, the following table (Table 20) shows how the prices of a selection of popular alcoholic drinks have changed from immediately prior to MUP being implemented to June 2023. Some products that were selling below 50ppu before MUP was implemented, increased to 50ppu when MUP was implemented and are still retailing at 50ppu five years later, for example, Glen’s vodka (4th in top 5 selling off-trade brands in Scotland in 2021), own label (Tesco) vodka, whisky, gin and cider (Table 20)
| Scotland | Affected by 55ppu MUP? | Affected by 60ppu MUP? | Affected by 65ppu MUP? | ||
|---|---|---|---|---|---|
| 02-Jun-23 | |||||
| Price | per unit | ||||
| Cider | |||||
| Tesco Crofter’s dry cider, 2l | 5.00 | 0.50 | YES | YES | YES |
| Strongbow, 4x440ml | 4.55 | 0.58 | NO | YES | YES |
| Strongbow dark fruits 4x440ml | 5.60 | 0.80 | NO | NO | NO |
| Magners, 4x440ml | n/a | ||||
| Vodka and Gin (all 70cl) | |||||
| Tesco Imperial vodka | 13.13 | 0.50 | YES | YES | YES |
| Glen’s vodka | 13.13 | 0.50 | YES | YES | YES |
| Smirnoff Red Label | 16.50 | 0.63 | NO | NO | YES |
| Russian standard vodka | n/a | ||||
| Tesco London dry Gin | 13.13 | 0.50 | YES | YES | YES |
| Gordon’s gin | 16.50 | 0.63 | NO | NO | YES |
| Bombay Sapphire | 22.00 | 0.79 | NO | NO | NO |
| Whisky (all 70cl) | |||||
| Tesco Special Reserve | 14.00 | 0.50 | YES | YES | YES |
| Bell’s | 16.50 | 0.59 | NO | YES | YES |
| Whyte and MacKay | 15.50 | 0.56 | NO | YES | YES |
| Famous Grouse | 16.50 | 0.59 | NO | YES | YES |
| Glenfiddich single malt 12 yrs | 38.00 | 1.36 | NO | NO | NO |
| Jack Daniels | 26.00 | 0.93 | NO | NO | NO |
| Beer and lager | |||||
| Tennents lager 4X440ml | 3.99 | 0.57 | NO | YES | YES |
| Budweiser, 4x440ml | 4.75 | 0.60 | NO | NO | YES |
| Stella Artois, 4x568ml | 5.75 | 0.56 | NO | YES | YES |
| Carling, 4x440ml | 3.85 | 0.55 | NO | YES | YES |
| Wine (75cl bottles) | |||||
| Tesco Spanish white wine | n/a | ||||
| Brancott Estate Sauvignon | 9.50 | 1.02 | NO | NO | NO |
| Blossom Hill Californian Rose | 5.00 | 0.61 | NO | NO | YES |
| Tesco Rioja | n/a | ||||
| Hardy's Crest Cabernet Shiraz | 7.00 | 0.67 | NO | NO | NO |
| Tesco Cote du Rhone | 8.00 | 1.02 | NO | NO | NO |
| Isla Negra Seashore merlot | n/a | ||||
Impact of COVID-19 on alcohol consumption and harms
Public Health Scotland published a summary of evidence on the impact of the COVID-19 pandemic on alcohol consumption and harm in Scotland and England. This found that, overall, alcohol consumption decreased following the start of the COVID-19 pandemic. However, changes in drinking behaviours were polarised with some increasing their alcohol consumption and others decreasing[92]. This was associated with drinking behaviour before the pandemic: those who increased their alcohol consumption tended to drink more before the pandemic, and those who decreased consumption tended to drink less. Over the COVID-19 pandemic, alcohol-related hospitalisations decreased, and alcohol-related deaths increased – potentially due to changing patterns of consumption and to the decrease in access to services over the pandemic.
The modelling results from Sheffield, referred to previously, show that across all scenarios the greatest burden falls upon hazardous and harmful drinkers and those from the lowest socioeconomic groups, leading to an increase in health inequalities. The researchers conclude that alcohol-related harms are likely to increase significantly as a result of the COVID-19 pandemic and that these increases may be sustained if increases in alcohol consumption among heavier drinkers persist in the longer-term.
It is acknowledged that there is more work to be done to better understand if there is any continued impact of the pandemic on alcohol harm. It is too early to know for sure whether the changed drinking behaviours during the pandemic are temporary.
PHS MUP Evaluation - Impact of 50ppu MUP on business
Following the introduction of MUP, reductions in alcohol sales were seen in the off-trade with no or minimal change to sales in the on-trade. Producers did not see any change in their market share for the on-trade.
Following the introduction of MUP at 50ppu, prices bunched in the 50ppu to 65ppu range. The PHS MUP evaluation found that the greatest reduction in sales of alcoholic products were for those products that increased the most following MUP’s introduction. This was particularly the case for high strength ciders that were previously selling below 50ppu.
The impact on individual retailers and producers of MUPs introduction varied depending on the alcoholic drinks products sold or produced. Alcohol sales data show an overall increase in revenue for retailers as although sales decreased this was compensated for by higher prices. No change to revenue or profits was reported by the large retailers. Some smaller retailers reported an overall decrease in revenues which is likely down to the mix of products sold prior to MUP coming in i.e. selling a high proportion of products impacted by MUP at 50ppu.
Revenues for producers was down, with some saying the impact was small. The evaluation did not show revenues from retailers being passed down the supply chain to producers. There was little evidence of products being reformulated due to MUP. What the evaluation found was a decrease in the size of the larger containers and multipacks. This was seen particularly for cider sold in large containers of 1 litre and above, and for multipacks containing more than 12 containers.
In terms of type of alcohol affected, there is evidence from quantitative analysis of purchasing data that MUP was associated with an increase in the purchase of low- and no-alcohol beer and cider, relative to higher-strength beer and cider with a lower alcohol content, while purchases of the high-alcohol-content versions decreased.
There was no evidence of any product in any packaging size being removed from the market entirely although some retailers delisted larger sizes of products which would have seen the greatest increase in price when MUP came in.
Changes to products may have been limited by the relatively small size of the Scottish market for UK and multi-national firms.
Using quantitative data, the evaluation found little evidence of significant impact on the five key metrics for business performance: number of enterprises and business units; employment; turnover; gross value added (GVA); and output value.
As regards cross border shopping, retailers reported some evidence of Scottish consumers increasing cross-border purchasing, but not significant. Generally, cross border shopping took place where consumers lived near the border and added alcohol to their shopping trip.
Stakeholder Roundtable and survey feedback
Retailers largely considered, now that MUP had been embedded for a number of years, it was part of ‘business as usual’. Those present at the roundtables felt that there had been limited impact by MUP on their business. Smaller convenience stores reported they saw a slight increase in their alcohol sales as MUP made them more competitive with larger supermarkets.
Roundtable participants were fairly neutral about what the impacts of removing MUP would be. Convenience stores in particular discussed the fact their sector’s operational costs meant products were more expensive before MUP was introduced, plus the fact the natural floor price of these products have increased in price anyway.
Retailer participants were not supportive of any increase to the level of MUP, particularly because of the cost of living crisis pointing to the fact that many families will struggle to buy food.
Producers and trade group roundtables raised the impact MUP had had on ‘value cider’ and private label products/own brand products. They said they had seen a significant decline in the sale of these products in the first year that MUP was introduced. The cider industry have also argued that there has been substitution of different types of alcohol over low cost cider. Whilst it was acknowledged that MUP may not be the only factor, it was felt that the policy had changed consumer habits and that it was reasonable to assume that some retail was moving in a different direction as a result.
For participants not involved in cider or own brand products, the introduction of MUP led to some businesses repackaging their products. This meant changing the number of products in a pack, the size of the product, and also the labels – price marked labels had to be removed or updated.
Summary of estimated impacts of increasing MUP to 55ppu, 60ppu or 65ppu
55ppu
Taking account of all the evidence and factors set out above, on balance, 55ppu does not sufficiently meet the aims of the policy. Whilst it provides the option closest to the level of interference in the market in terms of the distribution of prices in the off-trade that a 50ppu did, it is estimated by the Sheffield modelling to have lower benefits than have been achieved by 50ppu. Based on real prices inflated using CPIH, the price would need to increase to 60ppu to obtain the equivalent scale of impacts as modelled for 50ppu in 2019.
60ppu
60ppu is estimated to provide the option that is closest to maintaining the current benefits of the policy, and would uprate MUP in line with CPIH. However, Scottish Ministers are agreed that they want to aim to further reduce alcohol-related harm, including by increasing the public health benefits that MUP makes. This would likely result in a small increase in the share of products captured by MUP compared to when it was first introduced.
65ppu
65ppu is estimated to provide even greater positive health benefits than 60ppu, with additional reductions in the alcohol harms experienced by hazardous and harmful drinkers and with health benefits experienced most greatly on average by those in the most deprived SIMD groups (i.e. 22 fewer deaths in the most deprived SIMD quintile and 5 fewer deaths in the least deprived SIMD quintile in year one of the policy compared to a 60ppu MUP). At an overall level, the industry would be expected to see increased revenues compared to the other options. However, it would result in increased market interference by capturing an increased share of the market/additional products. This has the potential to create more adverse competition impacts and a larger number of producers seeing reduced sales.
Option 4b: Continue MUP, increasing to 70ppu, 75ppu or 80ppu
Whilst these higher prices are estimated to reduce alcohol harms more, the potential impact on consumers, drinkers and the alcoholic drinks industry are at levels that are considered too high by the Scottish Ministers at this time.
Increasing MUP to 70ppu would mean around 73% of products sold in the off-trade (by volume) would be directly impacted, increasing up to 80% for 80ppu.
Increasing MUP to a range of 70ppu or above is considered too high a level for Scotland. The impact on consumers, people with alcohol dependence and the market would be significant. It is also likely that the possibility of unintended consequences would be increased, such as financial difficulties for people dependent on alcohol and a potential increase in use of non-beverage alcohol.
However, results from the Sheffield modelling for these prices are set out below for completeness.
The Sheffield modelling estimates the following results for MUP prices of 70ppu, 75ppu at 2023 prices based on the closest 5p step from the modelling results after adjusting for inflation (60ppu and 65ppu in 2019 prices). 80ppu in 2023 prices is also closest to the 65ppu 2019 price step, however it is on the upper-bound of rounding and the results for the next price step up (70ppu) is used to illustrate the scale of potential impacts at the higher price (Table 21).
| MUP Level (2023 price) | 70ppu | 75ppu | 80ppu |
|---|---|---|---|
| Consumption (Y1) | -6.7% | -10.7% | -15.3% |
| All cause deaths (Y1) | -130 | -197 | -278 |
| All cause deaths (Y20) | -88 | -112 | -165 |
| Alcohol specific deaths (Y1) | -77 | -119 | -165 |
| Alcohol specific deaths (Y20) | -81 | -134 | -192 |
| Admissions (Y1) | -1,732 | -2,696 | -3,779 |
| Admissions (Y20) | -1,211 | -1,926 | -2,760 |
Tables 22 to 23 summarise the impact MUP at 70ppu to 80ppu would have on different drinker groups and by SIMD.
| MUP level (ppu) | Moderate drinkers | Hazardous drinkers | Harmful drinkers |
|---|---|---|---|
| 2019 Number of baseline drinkers | 2,546,195 | 878,414 | 143,622 |
| 70 | +68,050 | -41,406 | -26,644 |
| 75 | +112,159 | -70,012 | -42,147 |
| 80 | +163,246 | -108,235 | -55,011 |
Due to these changes in the number of individuals in each drinker group, there are complexities in interpreting the modelling results by drinker group, which is particularly acute in the resulting impact on the moderate category. Further details can be found in the Sheffield University report's annex.
The absolute changes in the number of drinkers in each group highlight the impact of the policy in reducing the number of hazardous and harmful drinkers as the level of MUP increases.
| Consumption | 70ppu | 75ppu | 80ppu |
|---|---|---|---|
| SIMD Q1 (least deprived) | -5.9% | -9.7% | -13.9% |
| SIMD Q2 | -5.8% | -9.3% | -13.4% |
| SIMD Q3 | -6.7% | -10.9% | -15.5% |
| SIMD Q4 | -7.3% | -11.7% | -16.6% |
| SIMD Q5 (most deprived) | -8.1% | -12.8% | -18.2% |
For each of these minimum unit price levels, the largest relative falls in consumption are modelled to be in drinkers in the most deprived areas.
| Deaths (numbers) | 70ppu | 75ppu | 80ppu |
|---|---|---|---|
| SIMD Q1 (least deprived) | -13 | -20 | -29 |
| SIMD Q2 | -15 | -27 | -35 |
| SIMD Q3 | -25 | -34 | -46 |
| SIMD Q4 | -32 | -48 | -70 |
| SIMD Q5 (most deprived) | -45 | -68 | -98 |
Table 24 highlights that increasing MUP is generally estimated to have a greater reduction on mortality in the higher (most deprived) SIMD groups compared to the less deprived groups.
Table 25 shows the estimated impact of different levels of MUP on hospital admissions by SIMD group.
| Admissions(numbers) | 70ppu | 75ppu | 80ppu |
|---|---|---|---|
| SIMD Q1 (least deprived) | -186 | -294 | -426 |
| SIMD Q2 | -197 | -318 | -445 |
| SIMD Q3 | -299 | -459 | -636 |
| SIMD Q4 | -421 | -647 | -917 |
| SIMD Q5 (most deprived) | -629 | -978 | -1,354 |
These follow a similar pattern to the mortality results, with higher MUP thresholds leading to greater estimated reductions in admissions for those in more deprived groups.
| 70ppu | 75ppu | 80ppu | |
|---|---|---|---|
| Change in NHS Hospital costs (£m) | |||
| Y1-5 | -10.9 | -17.4 | -24.2 |
| Y1-20 | -36.7 | -59.1 | -84.3 |
Table 26 shows the modelled impacts of the selected MUP levels on NHS hospital costs, in comparison to a scenario where the price remained at 50ppu in 2019 prices – with both scenarios then uprated for inflation each year throughout the model period. It presents the cumulative cost changes over the first 5 years of the policy and over the full 20 year modelled period.
As well as the health impacts of different levels of MUP, the impact on business were also considered when deciding the price range on which to focus. Table 27 and Table 28 show the modelled impact on the on and off-trade retailer revenues, in comparison to the control of 50ppu in 2019 prices.
| Retailer revenue | 70ppu (£million) | 70ppu % | 75ppu (£million) | 75ppu % | 80ppu (£million) | 80ppu % |
|---|---|---|---|---|---|---|
| Total | +5.6 | +0.2% | +0.9 | 0 | -12.7 | -0.4% |
| Retailer revenues off-trade | +34.8 | +4.4% | +48.3 | +6.1% | +56.6 | +7.1% |
| Retailer revenues-on-trade | -29.2 | -1.1% | -47.4 | -1.8% | -69.3 | -2.7% |
These figures illustrate that an increase in the MUP threshold will increase off-trade retailers’ revenue while reducing revenue in the on-trade. This result is notable as generally the on-trades’ prices are set higher than MUP and it may have been assumed that their revenue would therefore not be affected by an increase to MUP.
Retailer revenues, having risen at 70ppu and 75ppu, start declining at 80ppu. This is explained by the effect of drinkers switching between products which bring in different levels of revenue to retailers, particularly within the off-trade, in response to price increases under the higher MUP thresholds.
| Exchequer revenue | 70ppu (£million) | 70ppu % | 75ppu (£million) | 75ppu% | 80ppu (£million) | 80ppu % |
|---|---|---|---|---|---|---|
| Total | -64.3 | -3.6% | -106.1 | -5.9% | -154.3 | -8.6% |
| Off – trade | -53.8 | -5.9% | -89.1 | -9.7% | -129.6 | -14.2% |
| On – trade | -10.5 | -1.2% | -17.0 | -1.9% | -24.7 | -2.8% |
Increasing the MUP threshold is estimated to lead to reductions in alcohol tax revenue. These changes are largest in revenue from the off-trade, as it is off-trade prices which are directly impacted by changes in the MUP threshold, while on-trade prices are generally higher than the threshold levels being modelled. In essence, increasing the level of MUP is expected to decrease sales and therefore exchequer revenue.
Increasing MUP to a range of 70ppu or above is considered as being at too high a level for Scotland. The impact on consumers, people with alcohol dependence and the market would be very significant. It is also likely that the possibility of unintended consequences would be increased, such as financial difficulties for people dependent on alcohol and a potential increase in use of non-beverage alcohol.
Alcohol duty
This section considers whether alcohol duty could be an alternative option to continuing with minimum unit pricing. It also highlights the potential impact of duty reform on the options given the core modelling results are based on the previous duty system. Prior to the implementation of MUP at 50ppu, alcohol duty was raised as a possible alternative way of achieving the aims of minimum unit pricing. However, there is uncertainty about what share of duty rises is passed onto consumers.
MUP and alcohol duty can work together to reduce alcohol harms. They work in different ways, but they are complementary. This is recognised in the WHO Report on Minimum Pricing – “minimum pricing policies should not be seen as replacements for taxation, but rather as being complementary to tax systems.”[93]
Given MUP has now been in place for 5 years, and a new duty system is in place (from 1 August 2023), we have re-visited consideration of the impact of duty on reducing alcohol harms[94].
The previous final BRIA which set the MUP at 50ppu[95] relating to the initial implementation of MUP, set out that alcohol duty would not achieve the same aims as MUP as it is a less targeted measure. This was illustrated through modelling by the University of Sheffield demonstrating the differential impacts of MUP and duty[96].
The results of the modelling showed that unprecedented increases in the rates of duty (under the previous duty regime) would be required to achieve a similar reduction and a similar distribution of harm reduction across drinker and income groups as MUP, defined either as the change in alcohol attributable deaths or alcohol attributable hospital admissions.
For alcohol-related mortality for all drinkers, it was estimated that tax (duty and VAT) would need to increase by 27% to achieve a similar benefit to a MUP of 50ppu. But when looking to achieve a similar reduction in mortality for harmful drinkers, the tax increase would have to be 36%[97]. Similar results were seen for alcohol-related hospital admissions[98].
A new duty system was introduced by the UK Government on 1 August 2023 and the Scottish Government commissioned the University of Sheffield to analyse the impacts of both the previous and new duty system using their new model, and to compare them with the impacts MUP would have. The University of Sheffield considered the following scenarios:
What changes in alcohol duties would be required to achieve the same number of:
- Total alcohol-attributable deaths averted
- Total alcohol-attributable deaths averted in hazardous and harmful drinkers
- Total alcohol-attributable deaths averted in harmful drinkers
- Total alcohol-attributable deaths averted in hazardous and harmful drinkers in the lowest quintile of the Scottish Index of Multiple Deprivation (SIMD)
- Total alcohol-attributable deaths averted in harmful drinkers in the lowest SIMD quintile
- In the 20th year after policy implementation as each of the modelled MUP thresholds (40ppu, 45ppu, 50ppu, 55ppu, 60ppu, 65ppu, 70ppu, 75ppu, 80ppu)
It is important to note that this section on modelling results relating to duties is based on 2019 prices – i.e. it has not been put into current prices as per the sections considering the impact of different MUP levels. This is to allow for comparisons to be made between the impacts of changes to MUP with changes to duties, which have been undertaken in 2019 prices.
As there are two different elements involved, prices cannot be uniformly updated into current prices using inflation as was done in our analysis of the specific impacts of changes in the MUP threshold. As such, references to increasing the MUP price to 60ppu (2019 prices) is not equivalent to the 60ppu level (2023 prices) in the options analysis and cost and benefit section.
Duty system from 1 August 2023
The Sheffield Model includes analysis of the relative impacts of duties and minimum unit pricing under the updated duty system. i.e. estimating the equivalised increases in alcohol duties for a range of MUP prices relative to the control arm of 50ppu (2019 prices). The results are shown in Table 29.
| Target population | |||||
|---|---|---|---|---|---|
| Population | Hazardous & harmful drinkers | Harmful drinkers | Hazardous & harmful drinkers in the most deprived SIMD quintile | Harmful drinkers in the most deprived SIMD quintile | |
| 40p | -19.0% | -19.0% | -23.0% | -19.0% | -26.0% |
| 45p | -10.0% | -11.0% | -12.0% | -11.0% | -14.0% |
| 50p | -3.0% | -3.0% | -2.0% | -1.0% | -1.0% |
| 55p | 10.0% | 9.0% | 15.0% | 12.0% | 15.0% |
| 60p | 27.0% | 23.0% | 34.0% | 26.0% | 35.0% |
| 65p | 44.0% | 38.0% | 56.0% | 43.0% | 56.0% |
| 70p | 64.0% | 57.0% | 79.0% | 63.0% | 79.0% |
| 75p | 85.0% | 76.0% | 101.0% | 85.0% | 100.0% |
| 80p | 108.0% | 97.0% | 124.0% | 107.0% | 124.0% |
The duty reforms don’t make a significant impact compared to the baseline case (of 50ppu in 2019 under the old duty system). This is demonstrated by the results in the 50ppu row, which model that the same benefits (in terms of the metric used in each column) as the original 50ppu MUP under the old duty regime could be achieved under the reform duty regime while also reducing duty rates a small amount (ranging from 1% to 3% reduction). The small scale of these changes means we can be confident that the modelled impacts throughout this report, which are based on the old duty regime, will not be significantly impacted by the updated duty regime.
In addition, the results highlight the scale of tax rises required to lead to equivalent improvements in health harms compared to increasing the level of MUP (in real terms). Similar to the analysis ahead of the introduction of MUP, this highlights duties would have to rise by a significant amount to achieve equivalent benefits.
Expanding on the second point, the University of Sheffield analysis includes an illustrative example of 60ppu in 2019 prices to consider this point - i.e. the example does not model the impacts at the price of 65ppu. Using a MUP of 60ppu as an illustrative example (in 2019 prices): the impact of duty reforms is estimated to be a small reduction in total alcohol consumption of -0.4%, whereas Sheffield model that with an increase in price to 60ppu the reduction would be -5.8%. Increases in price to 60ppu (2019 prices) would lead to a significantly higher reduction in the number of harmful and hazardous drinkers (Table 30).
| Abstainers | Moderate | Hazardous | Harmful | |
|---|---|---|---|---|
| Absolute change vs. control in 2023 | ||||
| Duty reform | 0 | 4,862 | -3,707 | -1,156 |
| 60ppu (2019 prices) | -22 | -60,179 | -37,590 | -21,891 |
| Relative change vs. control in 2023 | ||||
| Duty reform | -0.0% | 0.2% | -0.4% | -0.9% |
| 60ppu (2019 prices) | -0.0% | 2.4% | -4.2% | -16.6% |
Using a price of 60ppu as a purely illustrative example and looking at drinker groups by SIMD quintiles, the impact of duty reform is much smaller than a price of 60ppu (2019 prices). A price of 60ppu has the largest impact on alcohol consumption in the most deprived group, while duty reform is estimated to have the biggest effect on the drinking of the least deprived group. This is largely due to the fact that duty reform primarily affects taxes on wine, which tend to be consumed more by less deprived groups (Table 31).
| SIMD Q1 (least deprived) | SIMD Q2 | SIMD Q3 | SIMD Q4 | SIMD Q5 (most deprived) | |
|---|---|---|---|---|---|
| Consumption in 2023 (units per week per drinker – control) | 13.64 | 11.56 | 11.83 | 11.61 | 11.47 |
| Absolute change vs. control | |||||
| Duty reform | -0.07 | -0.06 | -0.05 | -0.03 | -0.02 |
| 60ppu (2019 prices) | -0.72 | -0.57 | -0.70 | -0.73 | -0.80 |
| Relative change vs. control | |||||
| Duty reform | -0.5% | -0.5% | -0.4% | -0.3% | -0.2% |
| 60ppu (2019 prices) | -5.3% | -4.9% | -5.9% | -6.3% | -7.0% |
In summary, the results of the modelling show that duty reform and MUP have different effects on different groups. Increasing the price from 50ppu to an illustrative 60ppu (in 2019 prices, i.e. real terms) would have a similar impact to an increase under duty reform of between 23% and 34%.
This level of increase is well above what has been seen before. Duty rises in the UK (which already has very high alcohol duty rates when compared internationally) over the last 20 years have rarely exceeded 5%. For the four years from 2013, some rates reduced or were frozen. Only in 2017 was there a duty increase across all products. Since the UK Government Autumn Budget in 2020, alcohol duty rates had remained frozen, with some rates only rising under the implementation of the new duty regime.
MUP is aimed at impacting low cost, high strength products. Under duty increases, all alcohol is impacted – low cost, high strength; high cost, high strength, and both the on and off-trade.
A minimum unit price of 60ppu (in 2019 prices) has a much greater impact on deaths than the duty reform – a minimum unit price of 60ppu is estimated to reduce all-cause deaths by 2,483 compared to 220 under the duty reform. Both are cumulative changes over the 20 years and assume that the MUP level would increase in line with inflation annually (Table 32).
| Alcohol-specific deaths | All-cause deaths | |
|---|---|---|
| Cumulative deaths over 20 years (control) | 16,905 | 1,060,466 |
| Absolute change vs. control | ||
| Duty reform | -101 | -220 |
| 60ppu (2019 prices) | -1,781 | -2,483 |
| Relative change vs. control | ||
| Duty reform | -0.60% | 0.00% |
| 60ppu (2019 prices) | -10.50% | -0.20% |
By SIMD quintile, a minimum unit price of 60ppu (2019 prices) is estimated to have a greater reduction in deaths in the most deprived group than the least deprived[99], compared to duty reform which has the lowest reduction in deaths in the most deprived (zero) (Table 33).
| SIMD Q1 (least deprived) | SIMD Q2 | SIMD Q3 | SIMD Q4 | SIMD Q5 (most deprived) | |
|---|---|---|---|---|---|
| Cumulative deaths (2019 – 2038) | 177,109 | 204,795 | 218,931 | 224,321 | 235,309 |
| Absolute change vs. control | |||||
| Duty reform | -49 | -93 | -22 | -56 | 0 |
| 60ppu (2019 prices) | -334 | -349 | -572 | -528 | -700 |
| Relative change vs. control | |||||
| Duty reform | -0.0% | -0.0% | -0.0% | -0.0% | 0.0% |
| 60ppu (2019 prices) | -0.2% | -0.2% | -0.3% | -0.2% | -0.3% |
Conclusion on duty
It is important to recognise that MUP and alcohol duty can work together to reduce alcohol harms. They work in different ways, but they are complementary. This is recognised in the WHO Report on Minimum Pricing – “minimum pricing policies should not be seen as replacements for taxation, but rather as being complementary to tax systems.”[100]
Whilst an increase in duty rates would make alcohol less affordable, the whole alcoholic drinks market is affected i.e. high price products as well as cheaper ones. MUP is better able to target those drinks that are mainly drunk by hazardous and harmful drinkers. The greater health benefit in reducing alcohol harms comes from MUP as it is more targeted at those that drink the most alcohol in the most deprived groups who suffer greater harms than those in less deprived groups, thereby reducing inequalities.
The PHS report Evaluating the impact of alcohol minimum unit pricing (MUP) on alcohol-attributable deaths and hospital admissions in Scotland[101] found that estimated reductions in deaths wholly attributable to alcohol consumption were greatest among the four most socio-economically deprived area-based deciles, suggesting that MUP acted to reduce inequalities in alcohol-attributable deaths in Scotland.
As such, the reforms do not fundamentally alter our assessment of the impacts of different level of MUP which are based on the original duty regime.
Additionally, it remains the case that in order to achieve equivalent levels of health benefits as increases to the real terms level of MUP, unprecedented levels of increases in the duty rates would be required.
It is positive from a public health perspective to have duty more aligned to alcoholic strength. However, MUP remains the more targeted approach for the drinkers that suffer the most harms. Any further changes to the structure of the alcohol duty regime could be taken into account in any future change to the level of MUP.
The potential impact of the duty reform changes on the industry impact is discussed in the costs and benefits section.
4.3 Selecting the future minimum unit price
As detailed above, there were multiple factors that needed to be taken into account in considering the level at which to set the minimum unit price, and the impact of them is different at different prices.
MUP is a price-based policy, and the benefits of it will erode over time as inflation increases. However, alcohol prices have not, in general, risen in line with other food and non-alcoholic drink prices which means alcohol is more affordable relative to other goods.
The level of MUP has remained the same in cash terms for five years which also adds to making alcohol more affordable compared to other goods which leads to increased consumption and increased harms.
With alcohol prices rising more slowly than general prices since the introduction of MUP, it is likely to be the case that to achieve the same level of harms reductions as a 50ppu that necessarily results in a larger share of the off-trade market being impacted. It is recognised that the higher the minimum unit price, the more we interfere in the market.
There are potential unintended consequences from changing the price level, including potential for shifts to illicit alcohol or drugs consumption, cross border purchasing, and increased crime. It is not possible to consider the potential for these impacts in detail at different MUP 5p banding levels. However, generally, the potential for these to materialise is likely to increase as MUP levels increase as greater incentives are created to obtain ‘cheaper’ alcohol or substitutes.
Importantly, the impacts of MUP at 50ppu to date have been taken into account: reductions in alcohol-related harms, not significantly impacted the alcoholic drinks industry, and not had significant unintended consequences.
In weighing up all the relevant factors, it is considered that the aim should be to select a MUP which increases the health benefits relative to those achieved by 50ppu on introduction while minimising undue market interference.
Conclusion on option 1: not continuing MUP
The overall conclusion is that the evidence supports that MUP has had a positive impact on health outcomes. The evaluation from PHS found MUP was estimated to have reduced deaths wholly attributable to alcohol consumption by 13.4% and was likely to have reduced hospital admissions by 4.1% up to the end of 2020, compared to what would have happened if MUP had not been in place.
The evidence shows that MUP has contributed to reducing health inequalities, as the largest estimated reductions in deaths and hospital admissions wholly attributable to alcohol consumption were seen in those living in the 40% most deprived areas.
There was also strong and consistent evidence of a reduction in alcohol consumption following MUP implementation, the evidence found that the reduction in consumption was driven by the heaviest purchasing households, and the majority of households were not affected, leading to the conclusion that MUP was well targeted.
Therefore, as MUP has achieved its aims and there was no consistent evidence that MUP impacted either positively or negatively on the alcoholic drinks industry as a whole, we are proposing that MUP should be continued.
Conclusion on option 2: continuing MUP at 50ppu
The evidence shows that 50ppu has been an effective price. However, its effectiveness will be reducing as a result of the effects of inflation. It is recommended that the level of MUP would need to increase to ensure it remains effective going forward. As such, continuing the policy at 50ppu is not being taken forward as an option.
Conclusion on option 3: continue MUP at a level lower than 50ppu
Lowering the MUP threshold is estimated to increase alcohol consumption compared to the control of 50 ppu in 2019 prices, and increase alcohol-related health harm, with the greatest increases in the most deprived groups. This is counter to the intention of the policy aims to reduce alcohol-related harm and contribute to reductions in alcohol-related health inequalities and therefore is not being taken forward as an option.
Conclusion on option 4: continue MUP at levels above 50ppu
Option 4a: Continue MUP at 55ppu, 60ppu or 65ppu
55ppu
Continuing MUP at 55ppu is likely to see lower benefits than those set out in the PHS evaluation in terms of reducing health harms, as it is lower than the original MUP level in real terms. However, it is the price level which would be most similar in terms of the share of the off-trade market captured, reflecting that off-trade alcohol prices have risen more slowly than general inflation.
55ppu would be an increase that was lower than inflation and, it is likely that any beneficial impacts of MUP realised to date will only continue if the value of MUP compared to other prices and incomes is maintained. For this reason, it is not being taken forward.
60ppu
This option is estimated to be closest to maintaining the current benefits of the policy and would uprate the minimum unit price in line with the most commonly used measure of inflation (CPIH). It would likely result in a small increase in the share of products captured by MUP compared to when it was first introduced, and therefore potentially increases the potential of adverse impacts to businesses.
At the time of the original intention of Scottish Government to introduce a minimum unit price in 2012 the proportion of the off-trade market that a 50ppu would impact was 60%. In the year prior to MUP being implemented (2017), 45% of alcohol sold in the off-trade market in Scotland was below 50ppu[102]. A 60ppu (in 2023 prices) would impact on 52% of the off-trade market (by volume in 2022).
A price of 60ppu is estimated to achieve health benefits (for example, of mortality and hospitalisations averted and years of life lost reduced) on a broadly comparable level to when MUP was first introduced in 2018.
The principal disadvantage to 60ppu is that it is not estimated to achieve the health benefits in terms of mortality, hospitalisations and years of life lost as 65ppu (or higher thresholds) and it is the policy aim of the Scottish Ministers to further reduce alcohol-related harm. For these reasons, 60ppu is not being taken forward.
65ppu
The modelling shows that there may be increased health benefits from increasing MUP to 65ppu. This level would represent an increase compared to inflation (i.e. a real terms increase compared to when MUP was introduced). 65ppu is estimated to provide even greater positive health benefits than 60ppu, with modelling showing it could avert an additional 60 deaths in the first year and 774 fewer hospital admissions compared to an inflation only rise in MUP. These health benefits would be experienced most greatly by those in the most deprived groups on average (i.e. 22 fewer deaths in most deprived SIMD quintile compared to 5 fewer deaths in the least deprived quintile in year one compared to 60ppu).
It would also impact on a greater share of the market than when MUP was introduced, with an estimated 64% of the off-trade market by volume sold below this average price level in 2022. This impact, however, must be considered within the context of rising alcohol harms as latest alcohol-specific deaths show there has been an increase of 2% in 2022.
It is also possible that there would also be an increase in unintended consequences. There are, however, arguments that given evidence of worsening alcohol-related harm (in part likely related to the impact of the pandemic) that a stronger intervention in the market to justify the greater health impacts forecast is justified.
On balance, the Scottish Ministers have decided that 65ppu strikes the appropriate balance of achieving increased health benefits (as part of a range of overall prevention and treatment policies) while avoiding unnecessary interference in the market.
Option 4b: Continue MUP at 70ppu, 75ppu or 80ppu
Although the modelling shows that there would be increased health benefits, increasing MUP to 70 or 80 ppu would represent a considerable increase compared to inflation. 80 ppu would impact over 80% of the off-trade market by volume in 2022, including some premium products, and therefore would involve a more significant interference in the market. It is also likely that there would be an increased risk of unintended consequences. Therefore, the Scottish Ministers have not taken forward this option.
Scottish Ministers’ agreed level of MUP
Having considered all relevant factors, as detailed above, the Scottish Ministers have decided to increase the minimum unit price to 65ppu, striking a balance between the policy aim of reducing alcohol harms with the impact on the alcoholic drinks market.
Contact
Email: MUP@gov.scot
There is a problem
Thanks for your feedback