Long-term monitoring of health inequalities: March 2022 report
Annual update of the long-term monitoring of health inequalities headline indicators.
This document is part of a collection
Alcohol-related hospital admissions aged under 75 years
Trends in alcohol-related admissions
The hospital admission rate for alcohol-related conditions amongst those aged under 75 years has shown a general downward trend over time. The rate of admissions was 202.4 per 100,000 in 2020, the lowest figure in the time series and 30% lower than at the start of the time series (289.9 per 100,000 in 1996).
Alcohol-related hospital admissions were 10% lower in 2020 than in 2019. Measures put in place in response to the COVID-19 pandemic impacted hospital activity from March 2020 and may have contributed to the decrease.
| Year | Number of admissions | Target population size | Rate per 100,000 (EASR) |
|---|---|---|---|
| 1996 | 12,787 | 4,754,906 | 289.8 |
| 1997 | 12,918 | 4,740,269 | 292.6 |
| 1998 | 13,316 | 4,729,975 | 300.7 |
| 1999 | 13,217 | 4,721,298 | 298.2 |
| 2000 | 12,786 | 4,708,667 | 286.6 |
| 2001 | 13,469 | 4,703,661 | 300.3 |
| 2002 | 13,492 | 4,701,958 | 299.9 |
| 2003 | 12,996 | 4,702,431 | 290.0 |
| 2004 | 14,084 | 4,714,233 | 312.5 |
| 2005 | 13,346 | 4,735,320 | 293.8 |
| 2006 | 13,595 | 4,752,425 | 295.3 |
| 2007 | 14,641 | 4,783,452 | 313.5 |
| 2008 | 14,222 | 4,811,453 | 302.3 |
| 2009 | 12,891 | 4,835,007 | 272.9 |
| 2010 | 12,307 | 4,858,058 | 258.7 |
| 2011 | 12,264 | 4,888,316 | 256.2 |
| 2012 | 11,556 | 4,895,114 | 240.9 |
| 2013 | 11,225 | 4,903,074 | 236.8 |
| 2014 | 10,779 | 4,914,362 | 223.6 |
| 2015 | 10,467 | 4,935,283 | 216.2 |
| 2016 | 10,770 | 4,962,391 | 219.4 |
| 2017 | 10,644 | 4,976,829 | 218.0 |
| 2018 | 10,662 | 4,983,364 | 217.5 |
| 2019 | 11,187 | 4,997,455 | 226.0 |
| 2020 | 9,987 | 4,996,183 | 202.4 |
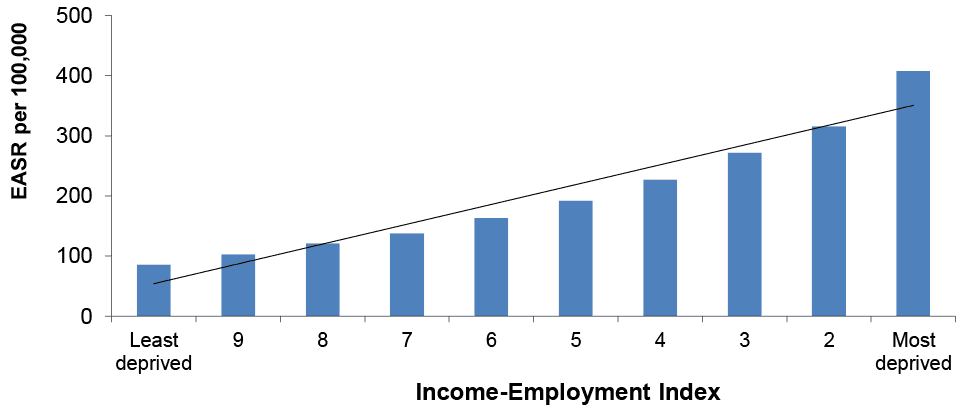
Inequalities in alcohol-related hospital admissions, 2020
In 2020, alcohol-related admissions were 5 times higher in the most deprived
areas of Scotland compared to the least deprived areas (407.3 compared to 85.3 cases per 100,000).
Trends in relative inequalities
There has been a general downward trend observed in relative inequalities for alcohol-related hospital admissions since 1996. However, there has been some fluctuation including an increase in 2016 when the RII was 1.85, the highest rate since 2003. The figure for 2020 was 1.64.
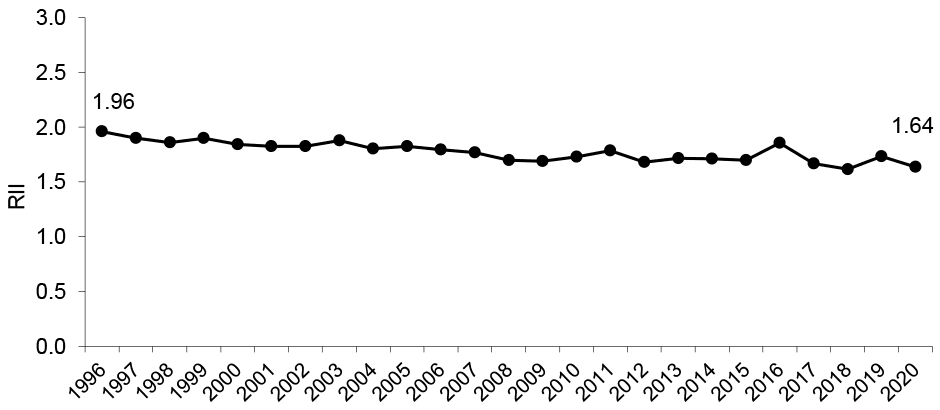
Since 2003, alcohol-related admission rates have been between 4 to 6 times higher in the most deprived areas compared to the least deprived areas. Prior to this, admission rates were 6-7 times higher in the most deprived areas.
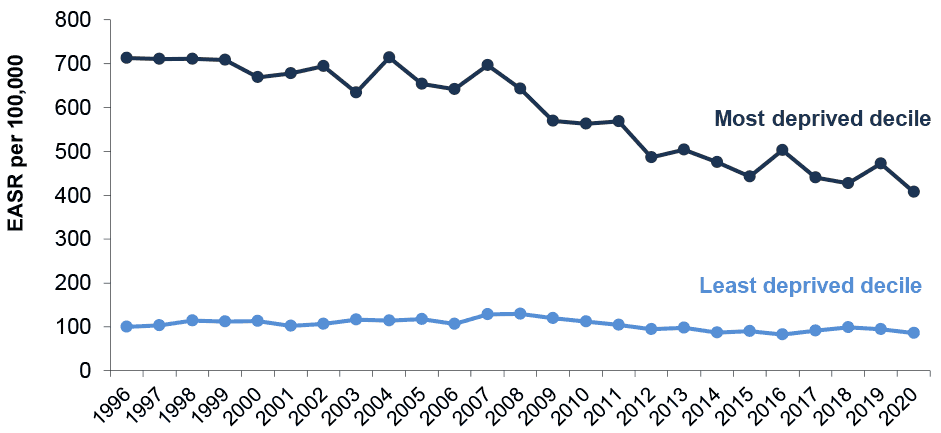
Trends in absolute inequalities
Absolute inequality in alcohol-related admissions has generally reduced over time, largely due to a reduction in admissions in the most deprived areas. The gap was widest at the start of the time series in 1996 (613.0 per 100,000) and reduced to its lowest level in 2020 (322.0 per 100,000). Rates in the most deprived areas have reduced by 43% between 1996 and 2020, compared to a reduction of 15% in the least deprived areas.
Between 2019 and 2020 the rate of hospital admissions for those living in the most deprived areas decreased by 14% and the rate in the least deprived areas decreased by 10%. It is possible that this reduction is a result of hospital admissions policies associated with the COVID-19 pandemic.
Contact
Email: morag.shepherd@gov.scot
There is a problem
Thanks for your feedback