New Rural Support Scheme development - evidence: outputs summary
This synthesis report covers twelve written reports providing evidence reviews, analysis, summaries and expert briefings on agriculture in Scotland to shape future policy to help deliver sustainable food production that tackles climate change and nature restoration.
W6 Basic Payment Regionalisation Options - Analysis of Spend and Redistribution Implications
Authors: Keith Matthews, Douglas Wardell-Johnson, Dave Miller, Steven Thomson, and Andrew Moxey
Ref: RESAS/005/21 – W6
The Report is available in the supporting documents of this publication.
Key Points
The current baseline of three payment regions can be modified in various ways. Selected different one, two and three region structures are presented here, with some further variations to budgets and/or payment criteria. The options include: (1) a single flat payment rate across all hectares; (2) a single flat rate payment scaled back to 'actively farmed hectares'; (3) a single flat rate payment based on standard labour requirement; (4) a 2 region model where current R2 and R3 are merged; (5) the 2 regions model with SUSS budget included; (6) a new 3 region model where the current R1 is split into rotational cropland and permanent grass and the current R2 and R3 are merged; (7) Option 6 including SUSS budget.
The relative payment rates for different regionalisation options (including with only 50% of the existing budget) are summarised in Table 1.
| Regionalisation option | 100% Budget: £405m | 50% Budget: £203M | Paid Area | |||||
|---|---|---|---|---|---|---|---|---|
| Payment Rates (£/ha) | Payment Rates (£/ha) | |||||||
| No | Name | R1 | R2 | R3 | R1 | R2 | R3 | (M ha) |
| 0 | Baseline | £211 | £42 | £12 | £106 | £21 | £6 | 3.8 |
| 1 | 1 Region - Flat | £105 | £53 | 3.8 | ||||
| 2 | 1 Region - AFHA | £236 | £118 | 1.7 | ||||
| 3 | 1 Region - SLR | £8,259 per FTE | £4,130 per FTE | 3.8 | ||||
| 4 | 2 Region - Merge R2&R3 | £211 | £24 | £106 | £12 | 3.8 | ||
| 5 | 2 Region - Merge R2&R3 + SUSS | £211* | £27* | £106* | £13* | 3.8 | ||
| R1a/b | R2/3 | R1a/b | R2/3 | |||||
| 6 | 3 Region – Merge R2&R3 (R3), split R1 into rotational cropland (R1) permanent grass (R2) | £211 | £24 | £106 | £12 | 3.8 | ||
| 7 | 3 Region – option 6 +SUSS | £211* | £27* | £106* | £13* | 3.8 | ||
| *budget £412m | *budget £206m | |||||||
Each regionalisation options led to differing distributions of support across regions, farm types and farm sizes. These patterns are complex and best viewed in map, tabular and graphical form (see Appendices), but may be summarised briefly as follows.
One region with a uniform, flat rate payment (£105/ha) is the simplest structure. It leads to significant support redistribution between recipients across regions, farm types and farm sizes. It also increases the budget share to the highest 1% of payment recipients (n=192) from 10% in the baseline to 24%. It also increases the budget share to the highest 1% of payment recipients from 10% in the baseline to 24%.
Restricting single region payments to only 'actively farmed hectares' (defined by an effective stocking rate of 0.8LU/ha with a payment rate of £236/ha) curbs regional redistribution, but still generates significant redistribution within farm types and sizes. The budget share of the top 1% of payment recipients remains at 10%.
Making payments on a labour proxy (£8,239/FTE), rather than land, is a more radical alternative. It leads to significant redistribution towards horticulture, dairy and granivore farms. The budget share of the highest 10% of payment recipients (n=1,929) rises to 55%.
Merging the current R2 and R3 regions (at £24/ha, or £27/ha if SUSS rolled-into budget) leads to more modest redistribution and keeps the budget share of the top 1% of payment recipients at around 10%.
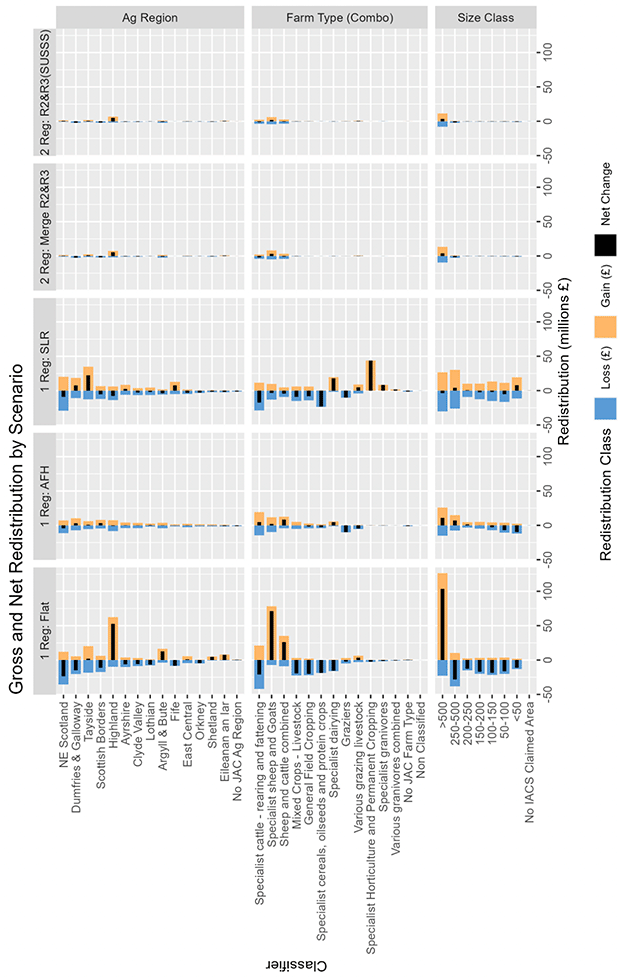
For each regionalisation option Figure 1 illustrates the net budget redistribution (black), budget gains (orange) and budget losses (blue) by size category, farm types and agricultural regions. Here it is apparent that a single region flat payment leads to significant redistribution from those with smaller claim areas to the larger land holdings that are largely specialist sheep or cattle and sheep businesses – generally located in regions with the highest density of R3 and R2 land. In contrast the single region – labour option has quite large distributions within size classes but large net gains for the specialist (intensive) horticulture, dairying and granivore sectors, with the regions with high densities of these farm types (Tayside, Dumfries and Galloway and Fife) benefiting the most.
Figure 1 reveals that options 4 and 5 (merging R2 and R3 – a combined are of c. 2.1m Ha) would be a simple evolution of the 3 region baseline model with redistribution limited to R2 and R3 lands. Option 6 & 7 would follow similar redistribution as option 4 & 5, with the only difference being delimitation of rotational cropping land including temporary grassland (171k Ha) and permanent grassland (1.03m Ha) that would be supported at the same rate (the benefit is derived from alignment to conditionality options and ease of adjustments to coupled support budgets).
In contrast options 1 and 3 (the single payment rate and labour payment) offer more radical changes to the support distribution model. The active farmed hectares (option 2) sits in the middle – but still would see significant movement of budget between business sizes. The consequences of any redistribution on the ability to engage in conditionality tiers needs consideration – evolution (4&5) versus revolution (1&3) or fairly radical change (3) in terms of redistribution.
Different stocking density and standard labour requirement (SLR) thresholds could be used with the single region model to produce different payment distributions. However, all would encounter implementation complexity and could risk breaching WTO rules on coupled support unless based on historical rather than ongoing resource usage values. Moreover, a single region structure necessarily hinders spatial targeting of support to specific outcome objectives.
It should be noted that none of the options considered materially affect the budget share of the smallest farms, but also that membership of the top 1% of payment recipients differs greatly under different options.
Contact
Email: richard.haw@gov.scot
There is a problem
Thanks for your feedback