Education: National Improvement Framework and improvement plan 2024
Sets out the vision and priorities for Scottish education that have been agreed across the system, and the national improvement activity that needs to be undertaken to help deliver those key priorities.
Measuring the attainment gap
It is important to be able to measure the impact of the system as a whole on progress towards closing the poverty-related attainment gap. That is why we use a range of measures that reflect the breadth of issues that can impact on attainment. This avoids, as far as possible, a situation where a single measure generates perverse behaviours by becoming the single focus of activity in schools.
A key development in recent years to support and drive progress in closing the poverty-related attainment gap has been the introduction of local stretch aims. This was introduced through the Scottish Attainment Challenge Framework for Recovery and Accelerating Progress in 2022. This included a requirement for local authorities to set ambitious but achievable stretch aims for progress in overall attainment and in closing the poverty-related attainment gap in the 2022/23 academic year across a sub-set of the 13 National Improvement Framework measures of the poverty-related attainment gap. An aggregation of local authorities’ core stretch aims was published in December 2022.
Local authorities also set additional (plus) aims which recognise that progress is identified in a broader range of ways at local level than those set out nationally. These aims are of equal importance to the core aims.
In this ground up approach to identifying stretch aims for progress, local authorities are responsible for implementing their local plans to make progress in raising attainment and for closing the poverty-related attainment gap. Their own stretch aims and their trajectories for annual progress towards them are included in their statutory improvement plans and published on local platforms.
Progress towards 2022/23 stretch aims
For primary school attainment, ACEL data showed strong improvement between 2020/21 and 2021/22 and the poverty-related attainment gap returned towards pre-pandemic levels. In 2022/23 this improvement has continued. The 2022/23 ACEL data for primary school literacy and numeracy shows that collectively local authorities have made progress towards the ambitious stretch aims set for 2022/23.
For school leavers with one or more SQA A-C awards at SCQF levels 5 and 6, the national data will be available through the Summary Statistics for Attainment and Initial Leaver Destinations (SSAILD) publication in February 2024. However, there are indications of progress compared to pre-pandemic performance. At National 5 and Higher, the poverty-related attainment gaps in 2023 remain narrower than in 2019.
For the Annual Participation Measure, Skills Development Scotland data published in August 2023 showed that the aggregated stretch aims for overall participation were exceeded, whilst the aggregated aims for the poverty-related participation gap were not. However, that gap was at a record low.
As we look ahead to the coming years, there is clear ambition among local authorities to raise attainment and close the poverty-related attainment gap over the next three years.
2025/26 stretch aims
Local authorities have now set stretch aims for 2025/26 in line with the guidance in the 2023 Framework for Recovery and Accelerating Progress.
The full report on ISBN/9781835217870">local authority stretch aims is published on gov.scot.
In terms of the poverty-related attainment gap, local authorities’ stretch aims point to a collective ambition to see significant progress since the Scottish Attainment Challenge was introduced. Looking at data from the beginning of the Challenge (2016/17), there is clear ambition to reduce the poverty-related attainment gaps across the core measures by:
- around 30% in primary school literacy and numeracy (ACEL P1, P4, P7 combined);
- around 28% for the proportion of school leavers attaining 1 or more award at SCQF level 5 based on Insight (All SCQF Awards) information;
- around 18% for the proportion of school leavers attaining 1 or more award at SCQF level 6 based on Insight (All SCQF Awards) information; and
- around 49% for the proportion of 16-19 olds participating in education, employment or training based on the Annual Participation Measure.
The health and wellbeing and “plus” aims set by local authorities cover a range of local priorities. However, there are some consistent areas of focus, for example all local authorities have set stretch aims for improving attendance and/or engagement. Other areas of focus include aims to improve the attainment and wellbeing of care experienced children and young people, aims for specific year groups or subject areas, aims for S3 literacy and numeracy, and local aims for closing the poverty-related attainment gap using local measures of that gap.
This collective ambition is encouraging as the system – and children and young people – continue to navigate the lasting impact of the pandemic and the current cost-of living-crisis, both of which have raised the barriers to learning created by poverty.
However, current attainment, poverty-related attainment gaps and stretch aims for progress vary significantly across local authorities, reflecting the range of different contexts in which local authorities operate. Some variation is appropriate, but in general children and young people should have equal opportunities to succeed, suggesting that we have more work to do to raise attainment for all and reduce unwanted variation. If good progress is made towards the 2025/26 local stretch aims, we would see that unwanted variation in performance across the core measures reduce.
To support local authorities to make progress towards their stretch aims, Scottish Government and Education Scotland, working with local authority partners, will use the intelligence the stretch aims provide to inform their ongoing support and challenge to drive progress.
Support and challenge to local authorities to make progress
In providing that support towards closing the poverty-related attainment gap, the Scottish Government will continue to support schools and local authorities through its £1 billion investment in the SAC programme over the course of the parliamentary term. Within that is continued investment in Pupil Equity Funding, empowering headteachers to develop local approaches to suit their children and young people’s needs; and investment in Strategic Equity Funding to local authorities to implement strategic approaches to closing the gap in their local authorities – and make progress towards their stretch aims. Additionally, the Scottish Government through the SAC programme also continues to provide funding to support care experienced children and young people’s attainment and wellbeing.
We will also look internationally to continue to develop our understanding of how progress in closing poverty-related attainment gaps has been achieved and sustained.
Alongside that, Education Scotland through its team of Attainment Advisors will continue to support and challenge schools and local authorities. This will include a clear plan for Education Scotland support and challenge for each local authority, as well as ongoing engagement throughout the academic year to ascertain and report on the progress of local authorities towards trajectories and therefore progress toward stretch aims for 2025/26, and to strengthen collaboration with schools.
Education Scotland will continue to work with and provide support to local authorities in refining, tracking and monitoring processes as well as sharing good practice. Targeted support for local authorities will continue through the analysis of data, and will be developed in collaboration with local authorities to increase the pace of progress with improvements, as well as tackling variation.
Education Scotland will continue to regularly publish materials to support improvements in learning and teaching. In addition, Education Scotland has developed Scotland’s Equity Toolkit as a learning resource which will be continually updated as evidence, research, and effective practice emerges.
Over the course of the coming three years, both locally and nationally we will track, monitor and report on progress towards these stretch aims in line with the requirements set out in the SAC Framework for Recovery and Accelerating Progress.
The Scottish Government continues its commitment to, and funding for, Equity and Excellence Lead posts, who are additional graduates in nurseries in Scotland’s most deprived areas. These are highly qualified posts, that can be either a teacher or early years graduate with or working towards, for example the BA in Childhood Practice. The role of Equity and Excellence Lead is primarily focused on leading support for the most disadvantaged children to close the attainment gap. The Scottish Government will undertake an evaluation of the Equity and Excellence Leads programme with a view to understanding how best to support these critical posts going forward.
13 key measures
Of the 13 key measures, data is not yet available to update for one of the measures (HWB: Children total difficulties score (age 4-12)). The data source has changed for one measure (HWB: Children total difficulties score (age 13&15)) and so data is available for 2022 only. Of the remaining 11 measures, there has broadly been a narrowing of the gap in eight of the measures, and a widening of the gap in three of the measures.
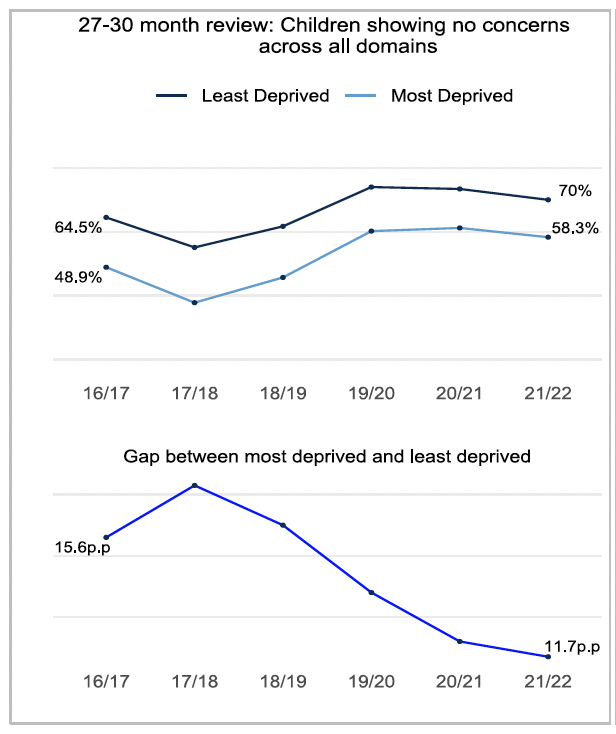
27-30 month review (children showing no concerns across all domains)
A number of changes to the approach to development assessments and recording of
outcomes were implemented in April 2017. The decline in the percentage reporting ‘no concerns’ around 2017/18 is mainly due to this change. Trends in this measure should therefore be interpreted carefully.
The COVID-19 pandemic led to changes in how reviews were delivered, as well as in the circumstances of daily life for many children in 2020/21 and 2021/22. It is therefore possible that both factors relating to assessment and recording, and genuine changes in the occurrence of developmental problems are contributing to the changes in the trends.
In 2021/22, these latest statistics show the gap between children living in the most and least deprived areas of Scotland decreased from 12.2 percentage points in 2020/21 to 11.7 percentage points in 2020/21. In 2021/22 the gap is smaller than in the pre-pandemic years. The percentage of eligible children with identified developmental concerns has increased in 2021/22 compared with 2020/21, and this increase was seen for those in both the most and least deprived areas. There has also been a small decrease in the percentage of eligible children aged 27-30 months reviewed. The percentage of eligible children reviewed decreased from 91.0% in 2020/21 to 89.4% in 2021/22. Over the same period the percentage of children reviewed and recording no concerns decreased from 68.45% to 65.5%. Speech, language and communication remains the most frequent developmental domain in which concerns are noted at this review.
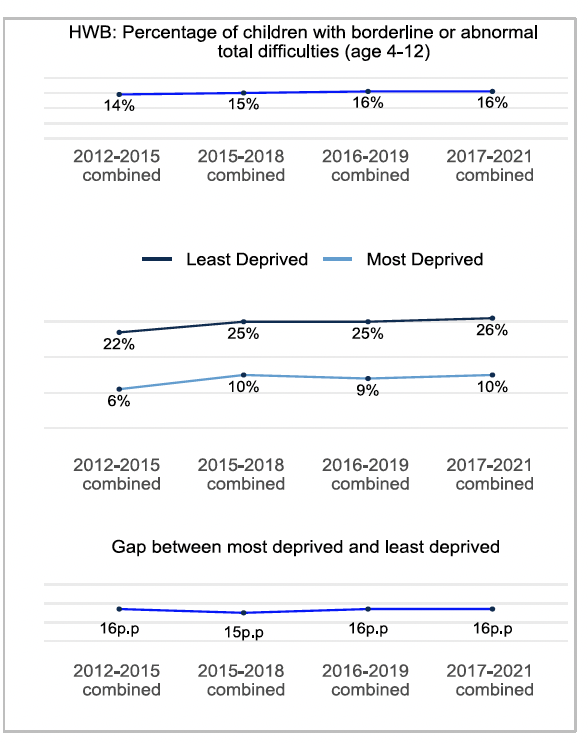
HWB: Children total difficulties score (age 4-12)
The percentage of children with borderline or abnormal total difficulties has remained broadly constant since 2012-15, with 16% of children in 2017-21 recording borderline or abnormal total difficulties scores. The gap between children in the most deprived and least deprived areas has remained largely unchanged since 2012-15, at 16 percentage points.
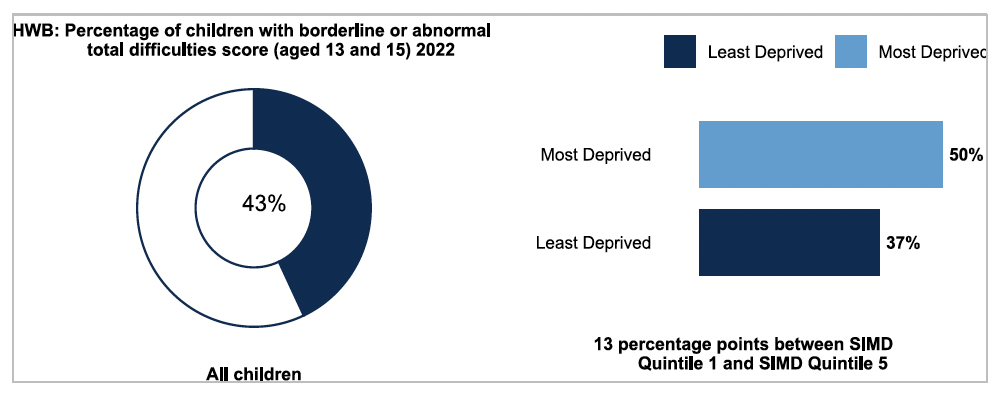
HWB: Children total difficulties score (age 13&15)
In 2021/22 the Health and Wellbeing (HWB) Census recorded 43% of 13 and 15 year olds with a borderline or abnormal total difficulties score. The gap between children from the most deprived and least deprived areas was 13 percentage points, with 50% of 13 and 15 year olds from the most deprived areas reporting borderline or abnormal total difficulties scores compared with 37% of those from the least deprived areas.
The HWB Census statistics are the aggregated results for the 16 local authorities who collected data, and are not weighted to population totals. These statistics are not directly comparable with the Scottish Schools Adolescent Lifestyle and Substance Use Survey (SALSUS) estimates previously used to report this measure. As such change in this measure will be reported as data becomes available in future years.
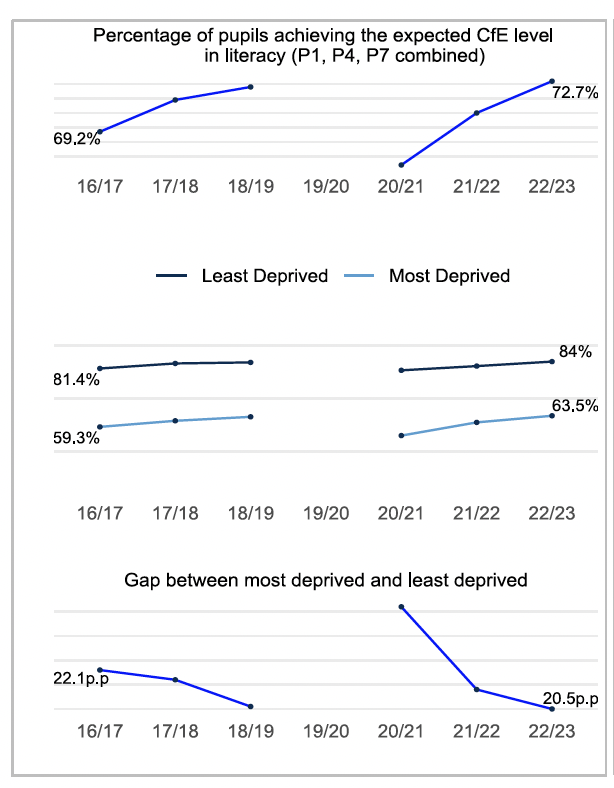
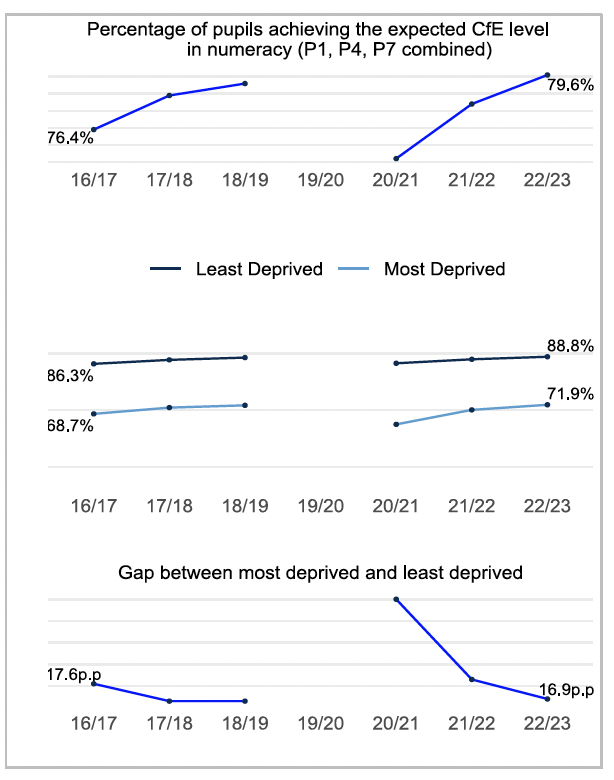
Primary - Literacy (P1, P4, P7 combined)
Primary - Numeracy (P1, P4, P7 combined)
In 2022/23, the data shows the percentage of pupils achieving expected levels in literacy increased for both those in the most and least deprived areas, compared to 2021/22. However while pupils from the least deprived areas performed better than pupils from the most deprived areas, the gap between the proportion of primary pupils from the most and least deprived areas who achieved their expected level in literacy narrowed compared with 2021/22 and is now lower than that in 2016/17. Similarly for numeracy the percentage of pupils achieving expected levels increased for both those from the most and least deprived areas. The gap between the proportion of primary pupils from the most and least deprived areas who achieved their expected level has narrowed since 2021/22, and is lower than that seen in 2016/17.
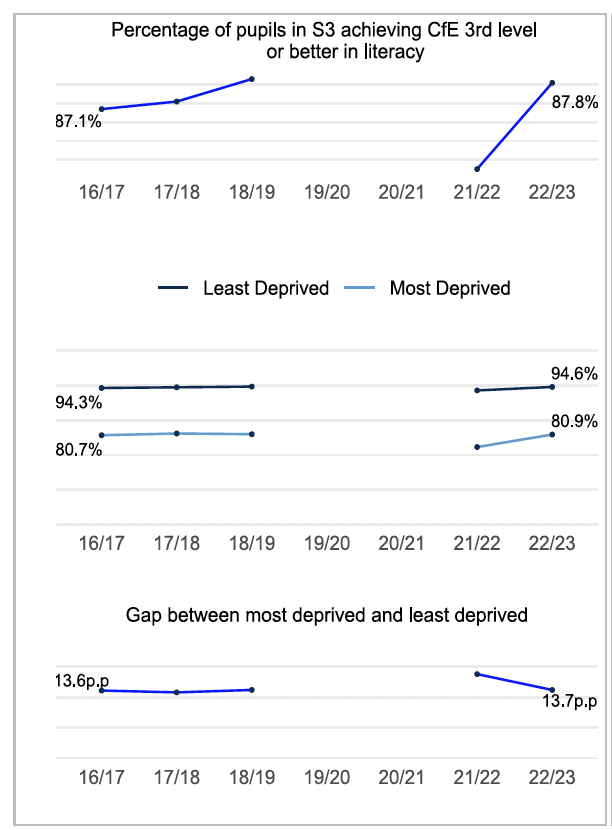
Secondary - Literacy (S3, 3rd level or better)
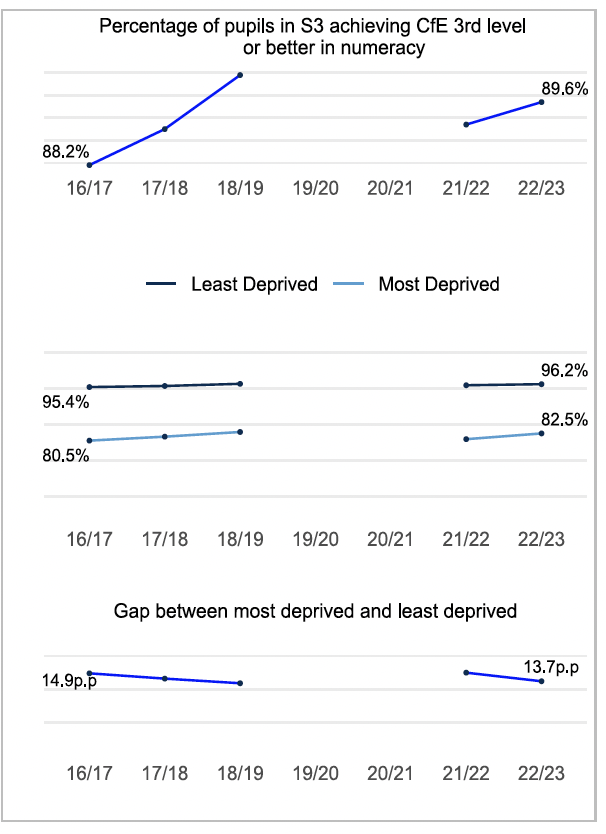
Secondary - Numeracy (S3, 3rd level or better)
In 2022/23 the gap between the proportion of S3 pupils from the most and least deprived areas who achieved their expected level in literacy narrowed (to 13.7 percentage points, and is at around the same level seen in 2016/17). While the percentage of S3 pupils achieving the expected level in literacy increased for pupils from both the most and least deprived areas, compared to 2018/19, the increase was larger for those from the most deprived areas.
The gap between the proportion of S3 pupils from the most and least deprived areas who achieved their expected level in numeracy narrowed (to 13.6 percentage points). The attainment gap in 2022/23 is lower than that in 2016/17 (14.9 percentage points). While the percentage of S3 pupils achieving expected levels in numeracy increased for pupils from both the most and least derived areas in 2022/23, the increase was larger for those from the most deprived areas.
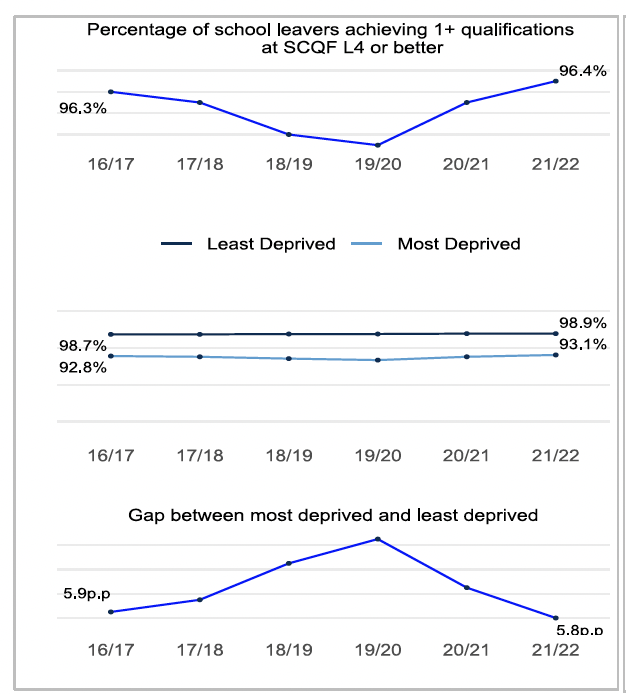
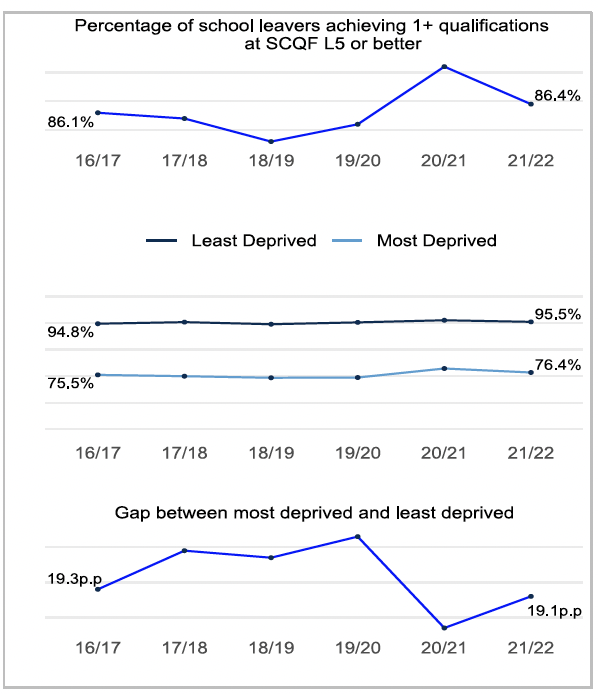
SCQF Levels 4, 5 and 6 (1 or more on leaving school)
The coronavirus (COVID-19) pandemic led to changes to the way in which National Qualification results at SCQF Levels 5 to 7 were determined. This attainment data considers all of the attainment which a school leaver gains over their time at school. This means the attainment of school leavers in 2019/20, 2020/21 and 2021/22 may be based on a combination of different approaches to determining results. The data based on school leaver attainment between 2015/16 and 2021/22 shows a small decrease in the gap for pupils leaving school with 1 or more qualifications at SCQF Level 4 from 6.1 percentage points in 2015/16 to 5.8 percentage points in 2021/22. This is due to a small increase in the percentage of pupils leaving school from the most deprived areas with at least one qualification at this level.
Over the same time period, the gap for pupils leaving school with 1 or more qualifications at SCQF Level 5 has seen a small decrease from 20.3 percentage points in 2015/16 to 19.1 percentage points in the latest year. Whilst there has been an increase in the percentage of pupils from both the most and least deprived areas leaving school with 1 or more qualification at SCQF Level 5, the increase has been greater for those from the most deprived areas.
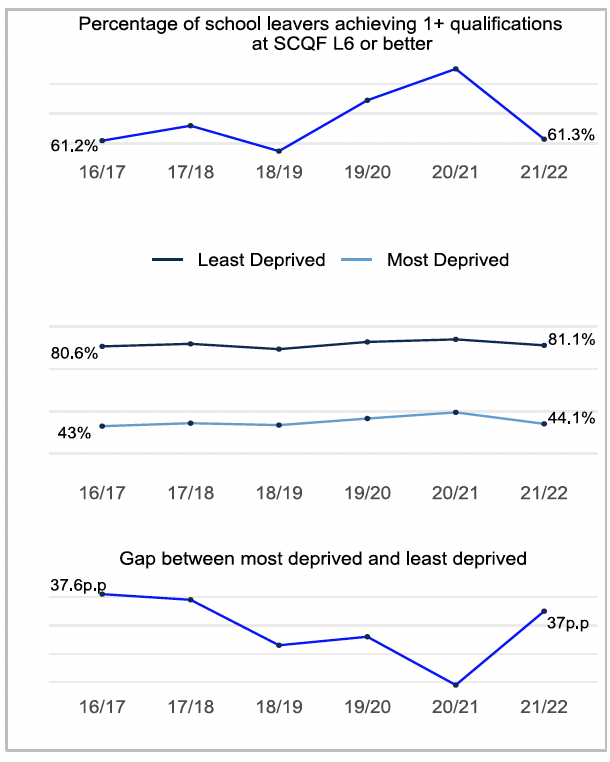
For pupils who left school with 1 or more qualification at SCQF Level 6, the gap narrowed slightly between 2015/16 and 2021/22, from 38.5 percentage points to 37.0 percentage points. Over the period 2015/16 to 2021/22, the percentage of pupils from the most deprived areas achieving 1 or more qualifications at SCQF Level 6 increased, whilst for those from the least deprived areas it remained at around the same level.
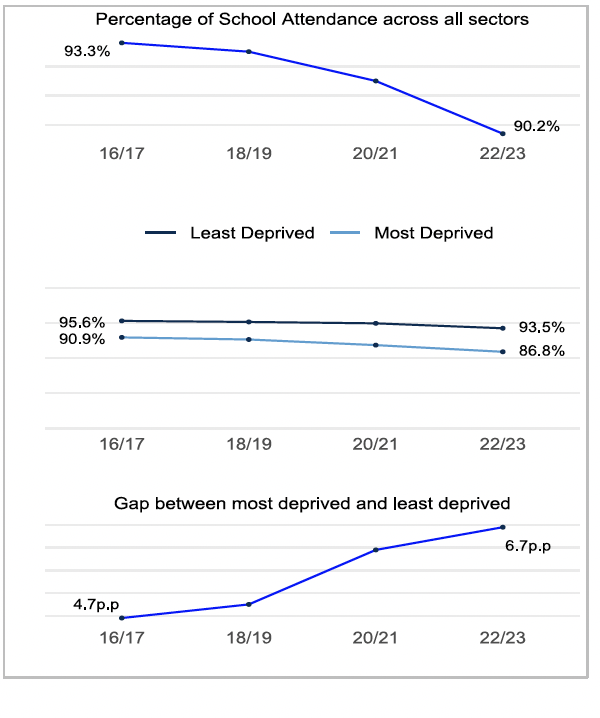
School Attendance
School attendance rates in 2022/23 have fallen slightly compared with 2020/21, and this continues a trend of small decreases in attendance since 2016/17. The attendance rate in 2022/23 was 90.2%, compared with 93.3% in 2016/17. While the attendance rates decreased for pupils from both the most and least deprived areas, the decrease was slightly larger for those from the most deprived areas. In 2022/23, the gap in attendance rates between children living in the most and least deprived areas of Scotland was 6.7 percentage points. This compares with 4.7 percentage points in 2016/17.
Participation measure
The inclusion of HM Revenue & Customs (HMRC) data, for the first time in 2023, has contributed to improved data quality and demonstrates an increase in participation. Although the data did not cover the whole of the period of interest it demonstrated an increase in young adults reported as participating in employment and a reduction in those with an unconfirmed status. The inclusion of HMRC data has contributed to an increased proportion of young adults reported in employment and this should be remembered when comparing data.
Additionally, the 2022 and 2023 statistics included data from DWP about Universal Credit (UC) claimants to comprehensively identify those out of work. The effects of Coronavirus (COVID-19) pandemic and associated lockdown and re-opening measures will have impacted on young adults’ participation in 2021 and 2022.
The impacts of the pandemic and the absence of both Universal Credit and HMRC data in prior years should be kept in mind when comparing 2023 data with earlier years.
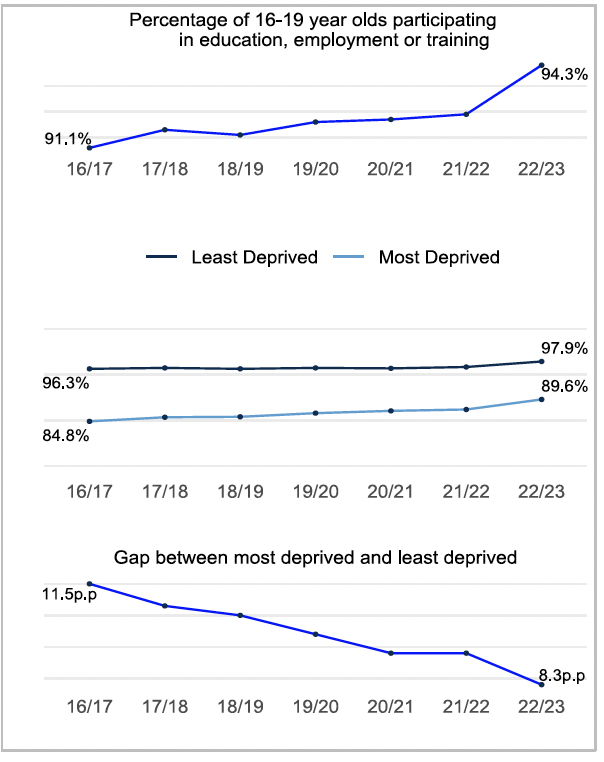
The participation measure shows that the percentage of 16-19 year olds participating in education, training, and employment has increased from 90.4% to 94.3% between 2016 and 2023. The gap between the proportion in the most and least deprived areas has decreased from 12.9 percentage points in 2016 to 8.3 percentage points in 2023. This is driven by an increase in the proportion of 16-19 year olds from the most deprived areas participating in education, training and employment from 83.3% in 2016/17 to 89.6% in 2023. Over the same period the percentage of 16-19 year olds from the least deprived areas participating in education, training or employment has largely remained the same, ranging from 96.2% in 2016 to 97.9% in 2023.
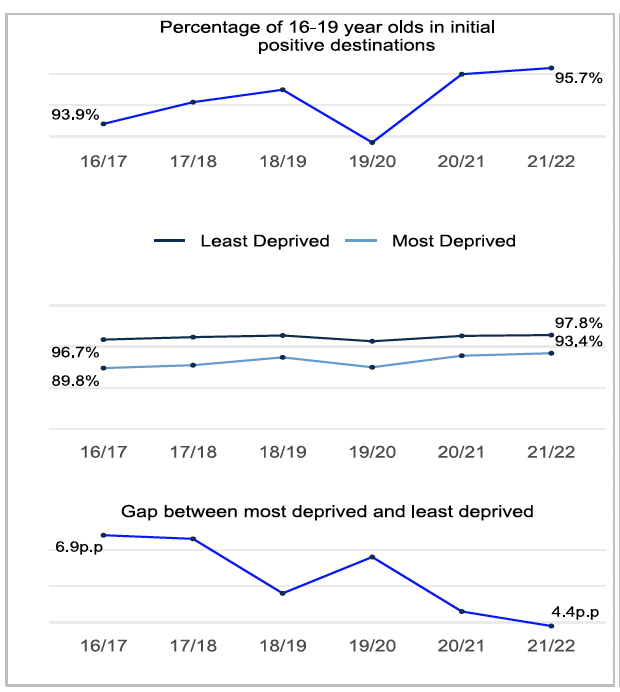
Initial Positive destination
This measure provides information on the outcomes for young people approximately three months after the end of the academic year (the first Monday in October). Positive destination includes higher education, further education, training, employment, voluntary work, Personal Skills Development and Activity Agreements (up to 2017/18).
The time series includes years where school leaver destinations have been affected – either directly or indirectly – by the COVID-19 pandemic. The impacts of COVID-19 should therefore be kept in mind when considering changes over time in school leavers’ destinations. The greatest effect of the pandemic on school leaver destinations is likely to have been seen in 2019/20. However, it is likely that there has been some ongoing impact on the destinations of some 2020/21 and 2021/22 school leavers. The pandemic may also have influenced some pupils’ decisions on when to leave school.
The gap in the proportion of school leavers in an initial positive destination has narrowed each year each year since 2015/16 (with the exception of 2019/20) and is now at 4.4 percentage points compared with 7.9 percentage points in 2015/16. While the percentage of school leavers in an initial positive destination has generally been increasing for those from both the most and least deprived areas, the increase has been greater for those from the most deprived areas.
Summary tables of the key measures are set out below, while the remaining sub-measures can be seen in the NIF Interactive Evidence Report.
Contact
There is a problem
Thanks for your feedback