We use cookies to collect anonymous data to help us improve your site browsing
experience.
Click 'Accept all cookies' to agree to all cookies that collect anonymous data.
To only allow the cookies that make the site work, click 'Use essential cookies only.' Visit 'Set cookie preferences' to control specific cookies.
The project helped define areas of the sea essential to fish for spawning, breeding, feeding, or growth to maturity. Twenty-nine species and multiple life-stages were reviewed covering marine fish and shellfish of commercial and ecological importance, relevant to offshore wind development areas.
Appendix C. Evidence on actual species distribution
This appendix combines the evidence gathered on the actual distribution of each studied species, as used in this study.
This includes:
Where data-based models were applied, map of the actual distribution of aggregations of the species/life stage as directly derived from the survey data used for the model calibration. The map shows the relative frequency of occurrence of aggregations across the surveys within the study period (2010 - 2020). Individual survey hauls were grouped within 5x5km grid cells for the calculation of the frequency of occurrence, with the grid cell centroid being shown as a point in the map. For details about these surveys, the identification of the life stages of interest and of aggregations of them, see section 2.2.1 of the main report.
Map(s) derived from the analysis of additional survey data (not used for the modelling) showing survey data points categorised according to presence of aggregations, generic presence (not as aggregation) and absence of the species/life stage. For details about these surveys, see section 2.4.1 of the main report. To allow comparability with the predicted maps, the identification of the life stages of interest (by size, season etc) and of aggregations (as top quartile CPUE catches in the survey) followed the same method as used for the modelled survey data (see section 2.2.1 of the main report for details). These maps are zoomed to the extent of the survey data available.
Maps providing evidence on the distribution of the species or areas identified as key for them, as obtained from the literature (articles, reports, policy documents, etc). These include for example maps of areas specifically identified for the protection of the species and its habitats (MPAs etc), or maps summarising evidence on te species distribution from different sources.
The maps are shown by species and relevant life stage.
C1. Lesser sandeel (Ammodytes marinus) C1.1 Any life stage
Figure C1. Lesser sandeel (
Ammodytes marinus): relative frequency of presence of aggregations in Sandeel Dredge Surveys within 2010 - 2020 period (Q4, mostly December; data used to calibrate model).
Figure C2. Lesser sandeel (Ammodytes marinus): Presence/Absence of the species and their aggregations in Sandeel Dredge Survey in December 2021 (data not used in the modelling).
Figure C3.
ICES assessment area 4 and various spatial measures for sandeels within Scottish waters. Blue lines show Scottish Marine and Offshore Regions for context. From: Marine Scotland (2022).
C2. Norway lobster (Nephrops norvegicus) C2.1 Any life stage
Figure C4. Norway lobster (
Nephrops norvegicus): relative frequency of presence of aggregations in International Bottom Trawl Surveys (
IBTS) within 2010 - 2020 period (Q3+Q4+Q1; data used to calibrate model).
Figure C5. Norway lobster (
Nephrops norvegicus): Presence/Absence of
Nephrops burrows and their aggregations (top quartile burrow density) in
Nephrops Burrows
TV Surveys 2007- 2016 (any Quarter).
Figure C6. Location of
Nephrops grounds in the Irish Sea (shaded areas). Source: Dickey- Collas et al. (2000).
C3. Herring (Clupea harengus) C3.1 Spawning
Additional survey data were not available to identify herring spawning. The summary map of spatial data on herring spawning grounds in Scottish waters (below) as published in Frost and Diele (2022) was used instead for comparison.
Figure C7. Spawning herring (Clupea harengus): Spatial-temporal data on herring reproduction, spawning grounds and larval occurrences in different seasons between 1990 and 2018 for ICES areas IV, VI and VII (including Isle of Man) (d). Polygons represent spawning areas identified based on different evidence (e.g. occurrence ripe or spawning herring, of herring eggs (on the seabed or in stomach of predator fish), of herring larvae). Point locations are also included for historic data on the catch locations of ripe or running herring, historic spawning grounds mentioned by fishers (a, b, c), and spawning grounds filmed off Wester Ross in 2018/2019. Source: Frost and Diele (2022).
C4. Plaice (Pleuronectes platessa) C4.1 Juvenile
Figure C8. Juvenile plaice (
Pleuronectes platessa, 0-group): relative frequency of presence of aggregations in Beam Trawl Surveys (
BTS) within 2010 - 2020 period (Q3; data used to calibrate model).
Figure C9. Juvenile plaice (
Pleuronectes platessa, 0-group) in West Coast of Scotland Demersal Fish Survey (
WCDF) 2013/14: Presence/Absence of juveniles and their aggregations in Q3 catches.
Figure C10. Juvenile plaice (
Pleuronectes platessa, 0-group) in West Coast of Scotland Demersal Fish Survey (
WCDF) 2013/14:Mean
CPUE (individuals per hour) in hauls from all seasons.
C5. Lemon sole (Microstomus kitt) C5.1 Juvenile
Figure C11. Juvenile lemon sole (
Microstomus kitt, 0-group): relative frequency of presence of aggregations in Beam Trawl Surveys (
BTS) within 2010 - 2020 period (Q3; data used to calibrate model).
Figure C12. Juvenile lemon sole (
Microstomus kitt, 0-group): Presence/Absence of juveniles and their aggregations in West Coast of Scotland Demersal Fish Survey (
WCDF) 2013/14 (Q3).
C6. Common sole (Solea solea) C6.1 Juvenile
Figure C13. Juvenile common sole (
Solea solea, 0- and 1-groups): relative frequency of presence of aggregations in Beam Trawl Surveys (
BTS) within 2010 - 2020 period (Q3; data used to calibrate model).
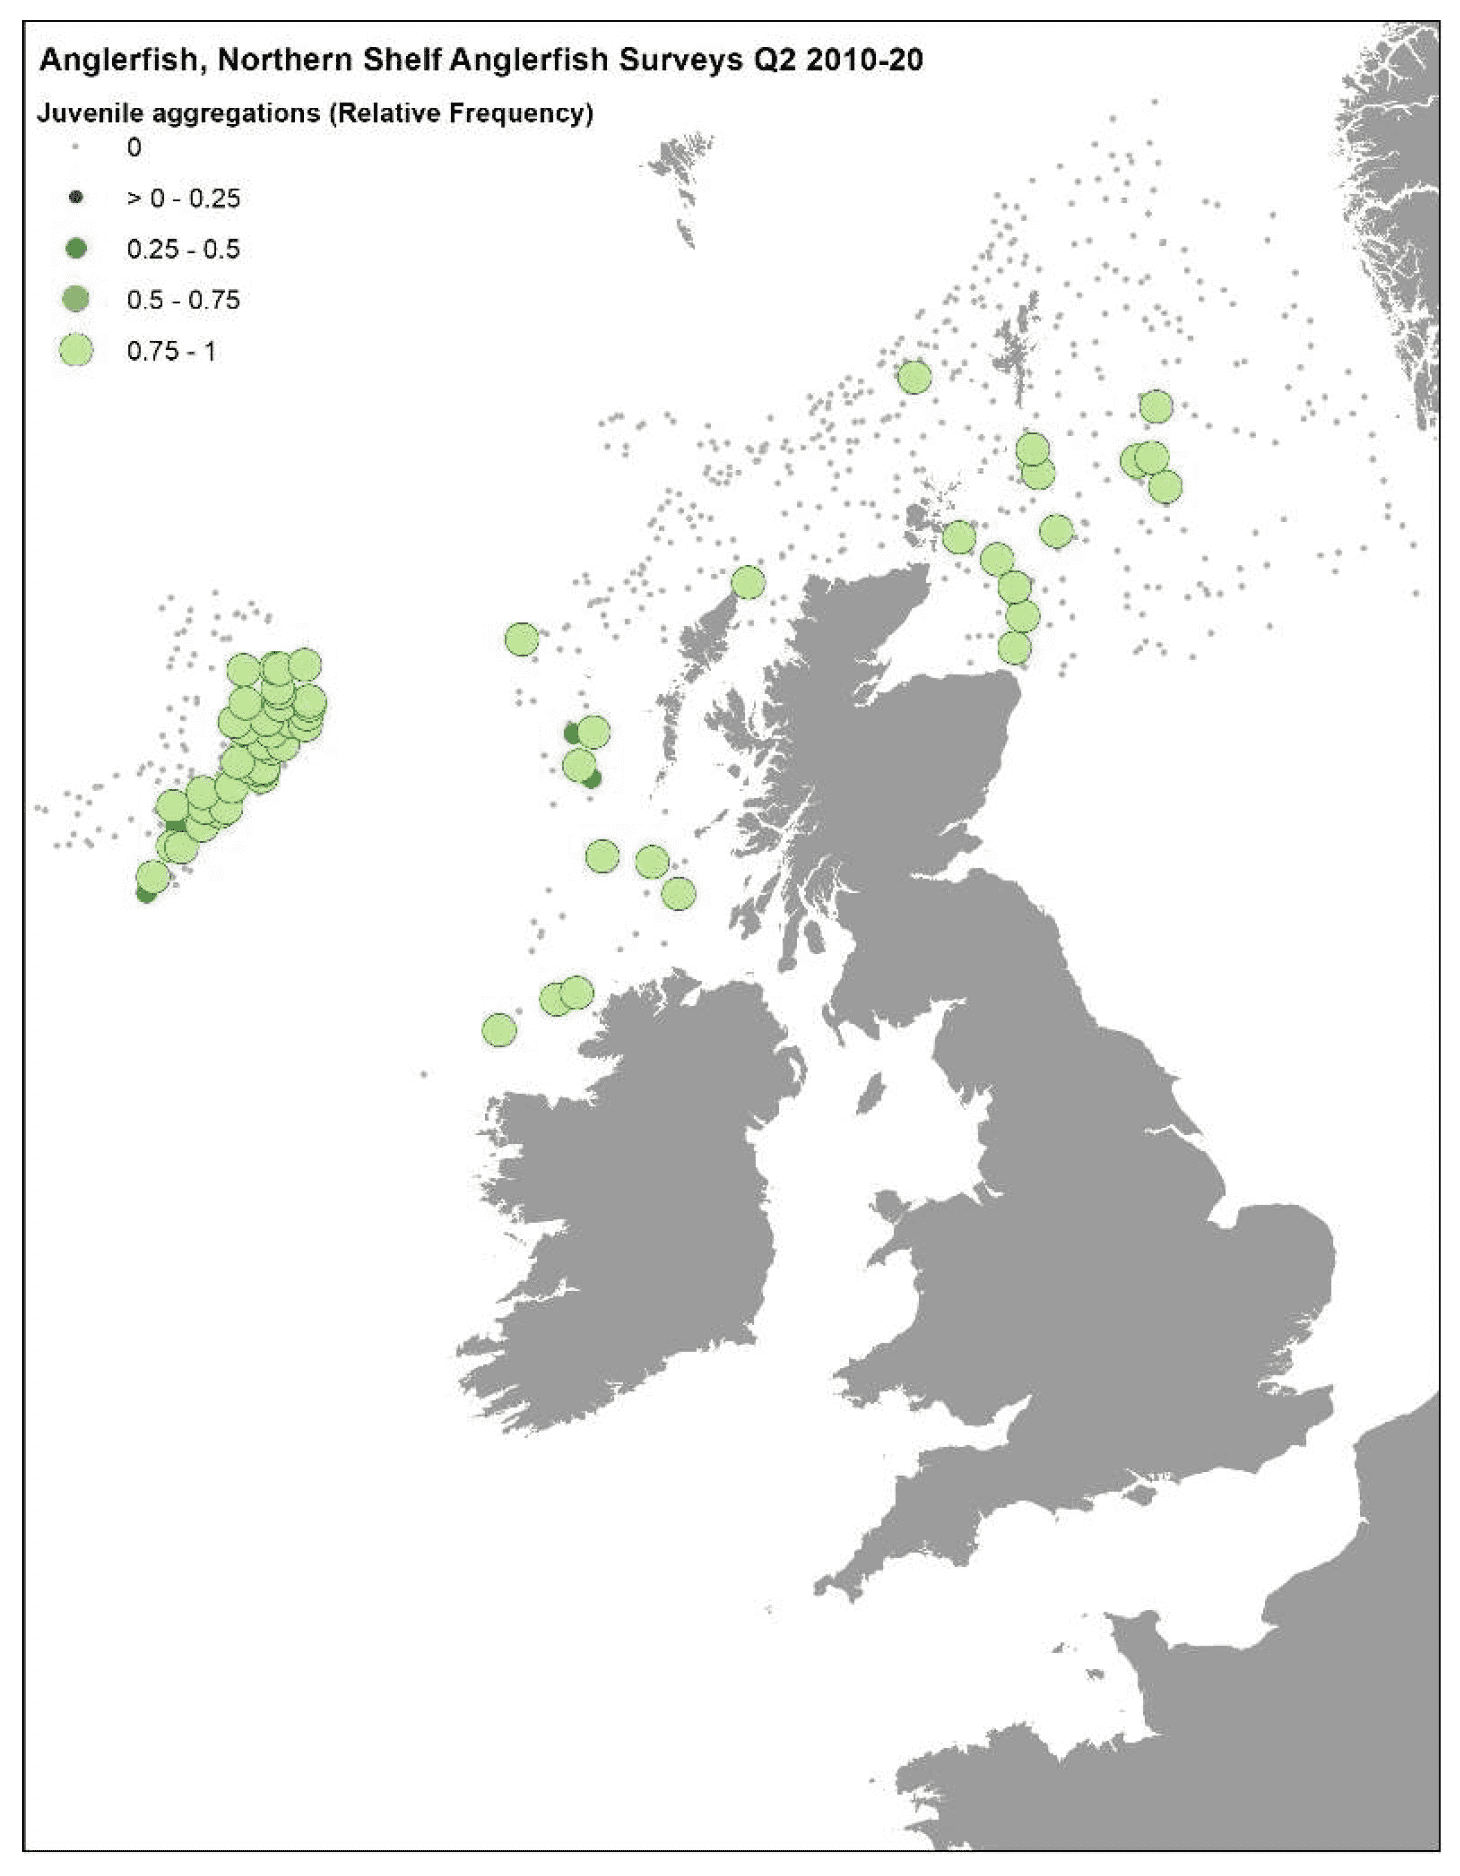
Figure C14. Juvenile anglerfish (
Lophius piscatorius, 0- and 1-groups): relative frequency of presence of aggregations in Northern Shelf Anglerfish Surveys (
SIAMISS) within 2010 - 2020 period (Q2; data used to calibrate model).
Figure C15. Juvenile anglerfish (
Lophius piscatorius, 0- and 1-groups): Presence/Absence of juveniles and their aggregations in the 2021 Northern Shelf Anglerfish Survey (
SIAMISS) (Q2).
Figure C16. Juvenile anglerfish (
Lophius piscatorius, 0- and 1-groups): Presence/Absence of juveniles and their aggregations in the West Coast of Scotland Demersal Fish Survey (
WCDF) 2013/14 (Q2).
C8. Whiting (Merlangius merlangus) C8.1 Juvenile
Figure C17. Juvenile whiting (
Merlangius merlangus, 0-group): relative frequency of presence of aggregations in International Bottom Trawl Surveys (
IBTS) within 2010 - 2020 period (Q3+Q4; data used to calibrate model).
Figure C18. Juvenile whiting (
Merlangius merlangus, 0-group) in West Coast of Scotland Demersal Fish Survey (
WCDF) 2013/14: Presence/Absence of juveniles and their aggregations in Q3 & Q4 catches.
Figure C19. Juvenile whiting (
Merlangius merlangus, 0-group) in West Coast of Scotland Demersal Fish Survey (
WCDF) 2013/14: Mean
CPUE (individuals per hour) in hauls from all season.
C8.2 Spawning
Figure C20. Spawning whiting (
Merlangius merlangus, 'running' adults): relative frequency of presence of aggregations in International Bottom Trawl Surveys (
IBTS) within 2010 - 2020 period (Q1; data used to calibrate model).
C9. Cod (Gadus morhua) C9.1 Spawning
Figure C21. Spawning cod (
Gadus morhua, 'running' adults): relative frequency of presence of aggregations in International Bottom Trawl Surveys (
IBTS) within 2010 - 2020 period (Q1; data used to calibrate model).
C9.2 Juvenile
Figure C22. Juvenile cod (
Gadus morhua, 0-group) in West Coast of Scotland Demersal Fish Survey (
WCDF) 2013/14: Mean
CPUE (individuals per hour) in hauls from all seasons.
Figure C23. Spawning haddock (
Melanogrammus aeglefinus, 'running' adults): relative frequency of presence of aggregations in International Bottom Trawl Surveys (
IBTS) within 2010 - 2020 period (Q1; data used to calibrate model).
C11. Norway pout (Trisopterus esmarkii) C11.1 Spawning
Figure C24. Spawning Norway pout (
Trisopterus esmarkii, 'running' adults): relative frequency of presence of aggregations in International Bottom Trawl Surveys (
IBTS) within 2010 - 2020 period (Q1; data used to calibrate model).
C12. Blue whiting (Micromesistius poutassou) C12.1 Juvenile
Figure C25. Juvenile blue whiting (
Micromesistius poutassou, 0-group): relative frequency of presence of aggregations in International Bottom Trawl Surveys (
IBTS) within 2010 - 2020 period (Q3+Q4; data used to calibrate model).
Figure C26. Juvenile blue whiting (
Micromesistius poutassou, 0-group) in West Coast of Scotland Demersal Fish Survey (
WCDF) 2013/14: Presence/Absence of juveniles and their aggregations in Q3 & Q4 catches.
C13. Hake (Merluccius merluccius) C13.1 Juvenile
Figure C27. Juvenile hake (
Merluccius merluccius, 0-group): relative frequency of presence of aggregations in International Bottom Trawl Surveys (
IBTS) within 2010 - 2020 period (Q3+Q4; data used to calibrate model).
Figure C28. Juvenile hake (
Merluccius merluccius, 0-group) in West Coast of Scotland Demersal Fish Survey (
WCDF) 2013/14: Presence/Absence of juveniles and their aggregations in Q3 & Q4 catches.
Figure C29. Location of Hake and Mackerel Boxes introduced to protect juveniles of the species within the Western Approaches Natural Area. Source: Jones et al. 2004.
C14. Saithe (Pollachius virens) C14.1 Juvenile
Figure C30. Juvenile saithe (
Pollachius virens, 1-group) in West Coast of Scotland Demersal Fish Survey (
WCDF) 2013/14: Mean
CPUE (individuals per hour) in hauls from all seasons.
C15. Sprat (Sprattus sprattus) C15.1 Juvenile
Figure C31. Juvenile sprat (
Sprattus sprattus, 0-group): relative frequency of presence of aggregations in International Bottom Trawl Surveys (
IBTS) within 2010 - 2020 period (Q3+Q4; data used to calibrate model).
Figure C32. Juvenile sprat (
Sprattus sprattus, 0-group) in West Coast of Scotland Demersal Fish Survey (
WCDF) 2013/14: Presence/Absence of juveniles and their aggregations in Q3 & Q4 catches.
Figure C33. Juvenile sprat (
Sprattus sprattus, 0-group) in West Coast of Scotland Demersal Fish Survey (
WCDF) 2013/14: Mean
CPUE (individuals per hour) in hauls from all seasons.
D16. Mackerel (Scomber scombrus) D16.1 Juvenile
Figure C34. Juvenile mackerel (
Scomber scombrus, 0-group): relative frequency of presence of aggregations in International Bottom Trawl Surveys (
IBTS) within 2010 - 2020 period (Q4+Q1; data used to calibrate model).
Figure C35. Juvenile mackerel (
Scomber scombrus, 0-group): Presence/Absence of juveniles
and their aggregations in West Coast of Scotland Demersal Fish Survey 2013/14 (Q4+Q1). See also Figure C29 for location of Mackerel box introduced to protect juveniles of the species within the Western Approaches Natural Area (Source: Jones et al. 2004).
C16.2 Egg
Figure C36. Mackerel eggs (
Scomber scombrus, early-stage eggs): relative frequency of presence of aggregations in Mackerel Egg Surveys (
MEGS) within 2010 - 2020 period (Q2+Q3; data used to calibrate model).
C17. Thornback ray (Raja clavata) C17.1 Juvenile
Figure C37. Juvenile thornback ray (
Raja clavata, 0-group including some 1-group individuals) in West Coast of Scotland Demersal Fish Survey (
WCDF) 2013/14: Mean
CPUE (individuals per hour) in hauls from all seasons.
C18. Spotted ray (Raja montagui) C18.1 Juvenile
Figure C38. Juvenile spotted ray (Raja montagui, juvenile) in West Coast of Scotland Demersal Fish Survey (WCDF) 2013/14: Mean CPUE (individuals per hour) in hauls from all seasons.
C19. Spurdog (Squalus acanthias) C19.1 Juvenile
Figure C39. Juvenile spurdog (Squalus acanthias, newborn) in West Coast of Scotland Demersal Fish Survey (WCDF) 2013/14: Mean CPUE (individuals per hour) in hauls from all seasons.
C20. Long finned squid (Loligo forbesi) C20.1 Juvenile
Figure C40. Juvenile long finned squid (
Loligo forbesi, immature/recruits): relative frequency of presence of aggregations in International Bottom Trawl Surveys (
IBTS) within 2010 - 2020 period (Q3+Q4; data used to calibrate model).
Figure C41. Juvenile long finned squid (
Loligo forbesi, immature/recruits) in West Coast of Scotland Demersal Fish Survey (
WCDF) 2013/14: Presence/Absence of juveniles and their aggregations in Q3 & Q4 catches.