Child poverty cumulative impact assessment: update
This report estimates the impact of Scottish Government policies on child poverty, updating the modelling that was originally undertaken for the second Tackling Child Poverty Delivery Plan.
4. Results
4.1 Relative poverty
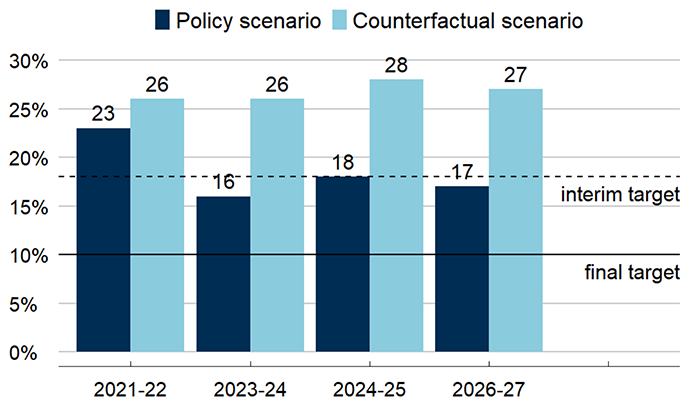
The official statistics show that 23% of children in Scotland were living in relative poverty in 2021-22, down from 26% in 2019-20.[6] With the latest data, forecasts, and policies included, we project that the relative child poverty rate will fall from 23% in 2021-22 to around 16% by 2023-24. Meanwhile, we estimate that the counterfactual poverty rate will stay relatively constant, at around 26% in both years.
Taking the difference between these scenarios, we estimate that the child poverty rate would have been around 4 percentage points higher in 2021-22 if the policy package had not been in place, with 40,000 more children living in poverty.[7] This impact is projected to increase to around 10 percentage points by 2023-24, meaning Scottish Government policies are anticipated to keep around 100,000 children out of relative poverty. The impact is slightly higher than our previous estimates.
In 2024-25, the child poverty rate rises in the policy and counterfactual scenarios to 18% and 28% respectively, driven in part by the discontinuation of UK Government cost-of-living payments. A fall of around 1 percentage point is then projected by 2026-27 in both scenarios, to reach 17% and 27% respectively. The impact of the policy package thus remains relatively constant over time, at around 10 percentage points. In 2024-25, the Scottish Child Payment alone is projected to impact the relative child poverty rate by 6 percentage points, meaning it will keep 60,000 children out of relative poverty in that year.
Figure 4.1 and Table 4.1 summarise the results of our analysis in terms of relative child poverty.
Source: Scottish Government analysis using UKMOD.
| Publication date | Scenario | Baseline year | 2023-24 – interim targets year | 2024-25 | 2026-27 –horizon of model |
|---|---|---|---|---|---|
| June 2023 (2019-20 baseline) | Counterfactual | 29% | 28% | 29% | |
| Policy | 26% | 19% | 18% | ||
| Impact of policy package | 3 ppts | 9 ppts | 11 ppts | ||
| February 2024 (2021-22 baseline) | Counterfactual | 26% | 26% | 28% | 27% |
| Policy | 23% | 16% | 18% | 17% | |
| Impact of policy package | 4 ppts | 10 ppts | 10 ppts | 10 ppts | |
| Interim target | Less than 18% | ||||
Notes: impacts calculated using unrounded figures.
Source: Scottish Government analysis using UKMOD.
4.2 Absolute poverty
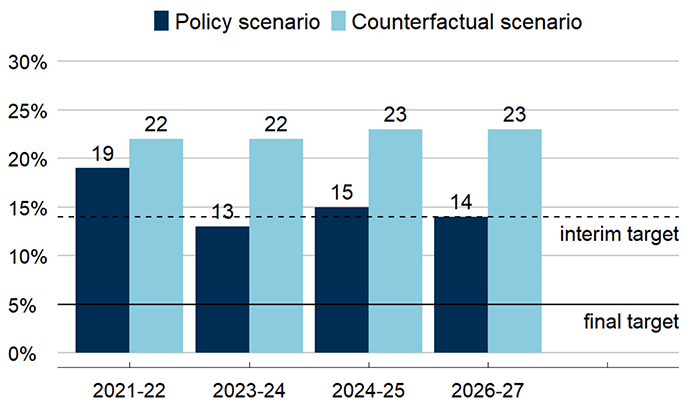
The official statistics show that 19% of children in Scotland lived in absolute poverty in 2021-22, down from 23% in 2019-20.[8] The model projects that this rate will fall to around 13% by 2023-24. Meanwhile, we estimate that the counterfactual poverty rate was 22% in 2019-20, and will remain at broadly the same level by 2023-24.
Taking the difference between these scenarios, the modelling indicates that the absolute child poverty rate would have been around 2 percentage points higher in 2021-22 if the policy package had not been in place, with around 20,000 more children living in absolute poverty.[9] This impact is projected to increase to 8 percentage points by 2023-24, meaning that Scottish Government policies could keep around 80,000 children out of absolute poverty. The impact is slightly lower than our previous estimates.
As with relative child poverty, the outlook beyond 2023-24 becomes increasingly uncertain. In 2024-25, the absolute child poverty rate rises more in the policy scenario (from 13% to 15%) than the counterfactual scenario (from 22% to 23%), reducing the impact of the policy package to around 7 percentage points. However, the projected poverty rate then falls in 2026-27, restoring an 8 percentage-point impact.
Figure 4.2 and Table 4.2 summarise the results of our analysis in terms of absolute child poverty.
Source: Scottish Government analysis using UKMOD.
| Publication date | Scenario | Baseline year | 2023-24 – interim targets year | 2024-25 | 2026-27 –horizon of model |
|---|---|---|---|---|---|
| June 2023 (2019-20 baseline) | Counterfactual | 26% | 25% | 25% | |
| Policy | 23% | 16% | 15% | ||
| Impact of policy package | 3 ppts | 9 ppts | 10 ppts | ||
| February 2024 (2021-22 baseline) | Counterfactual | 22% | 22% | 23% | 23% |
| Policy | 19% | 13% | 15% | 14% | |
| Impact of policy package | 2 ppts | 8 ppts | 7 ppts | 8 ppts | |
| Interim target | Less than 14% | ||||
Notes: impacts calculated using unrounded figures.
Source: Scottish Government analysis using UKMOD.
Contact
Email: spencer.thompson@gov.scot
There is a problem
Thanks for your feedback