Offshore wind to green hydrogen: opportunity assessment
Initial assessment of Scotland’s opportunity to produce green hydrogen from offshore wind.
2 market demand for green hydrogen
2.1 Introduction
This section assesses the market demand for green hydrogen and its target cost to compete with conventional fossil fuels. The assessment considers Scotland’s existing users and infrastructure, as well as academic, and research and development expertise. These combined with Scotland’s geographical capabilities, including energy-intensive industrial hubs, help to identify current and emerging energy demand to displace existing, fossil-fuel derived feedstocks with green hydrogen.
The aim was to model the overall future energy demand in Scotland and identify the most relevant hydrogen hubs within the country, rather than mapping individual areas. Three scenarios were developed that showed different sizes of hydrogen economy in Scotland. These scenarios were derived from the Scottish Hydrogen Assessment (SHA) (Arup, 2020), which developed a range of distinct viable scenarios for hydrogen deployment in Scotland and provided an economic assessment of those scenarios.
The following scenarios with corresponding roadmaps were created:
- Ambitious: Full transition towards a hydrogen economy in Scotland, based on the most optimistic assumptions.
- Planned Development: Optimistic scenario based on a wide hydrogen technology deployment and use across all sectors.
- Business as Usual: Conservative scenario with modest hydrogen use and extensive electrification.
Each scenario outlined how demand in Scotland is likely to change and evolve over a timeframe from present day to 2045, with focus on 2025 and 2032. The assessment considered different sectors that are likely to enter the green hydrogen sector and outlined how demand may vary between 2025 and 2045 based on the SHA. This was an important step to understand the impacts that green hydrogen may have on both national and local economies. The established high-level hydrogen demand was directly linked to specific markets that represent the greatest opportunity for Scottish green hydrogen which would allow transition towards the net-zero target by 2045.
The study focused on the cost that consumers would be willing to pay to replace the use of currently used fossil fuels. We demonstrate the predicted price of what fossil fuels will be in future years and therefore what the price of hydrogen needs to be for end-users. It does not focus on establishing the actual full costs of hydrogen production and corresponding sale price. These cost parity projections were crucial for further calculations to establish the potential gap between green hydrogen production cost and the hydrogen market price. Hydrogen can replace various fossil fuel sources across different sectors, which means that the end-user market price will vary significantly across the demand sectors. These markets were assessed independently to establish the corresponding market prices.
Finally, this section also identifies hydrogen demand hubs across Europe and assess what the cost parity may be in these regions to outline where Scotland’s green hydrogen could be best exported to in the future.
2.2 Hydrogen Demand Assessment
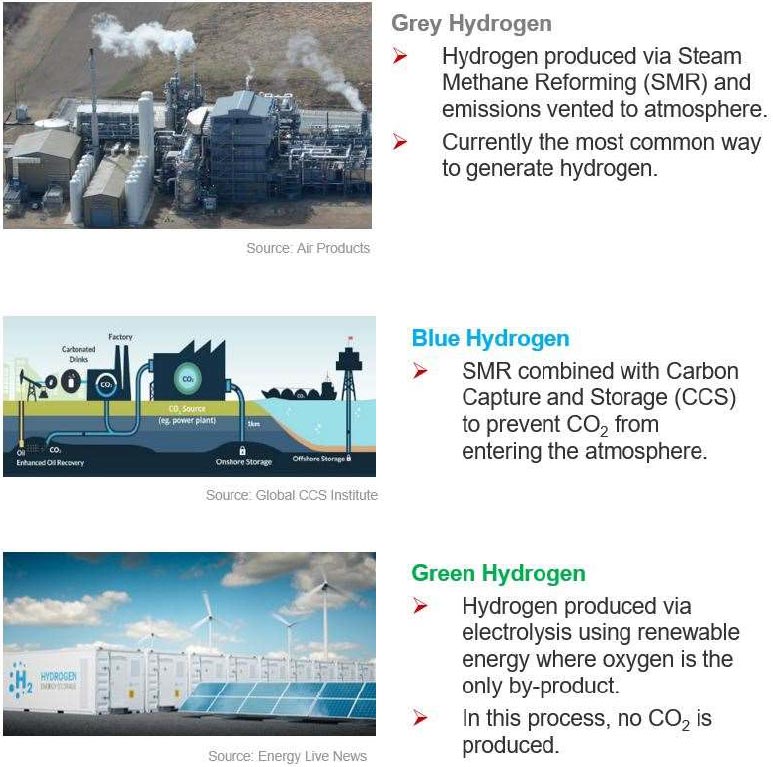
This section focuses on assessing Scotland’s future hydrogen demand, whilst identifying key links with other countries and regions. Although this study is dedicated solely to green hydrogen, it should be highlighted that there are other ways to produce hydrogen apart from electrolysis as shown in Figure 2.1
2.2.1 Worldwide Hydrogen Demand
Current global hydrogen production is around 70 million tonnes (energy equivalent of 2,800 TWh)[1] per year (IEA, 2020), with the UK producing approximately 1% of the global production (27 TWh) (Committee on Climate Change, 2018)[2]. In 2018, the primary source for dedicated hydrogen production came from natural gas through steam methane reforming - 71%, coal through gasification - 27%, and the remaining 2% from partial oxidation of oil and electrolysis (see Figure 2.2) (IEA, 2019). Hydrogen is also produced as a by-product from chemical processes, which predominantly use oil as a primary feedstock. Only electrolysis delivers a zero-carbon fuel, whereas the other methods of hydrogen production are all carbon emitting.
Hydrogen is widely used within industrial processes worldwide, predominantly for petroleum refining and recovery (46%) and ammonia production (44%) (Committee on Climate Change, 2018). These two sectors combined consume more than 90% of global pure hydrogen supply. Therefore, have the highest impact on the global pure hydrogen trade.
Global demand for hydrogen continues to rise. It has increased more than 3 times since 1975 as shown in Figure 2.3[4]. It currently accounts for 6% of global natural gas and 2% of coal worldwide. This leads to a significant carbon dioxide (CO2) footprint, which accounted for 830 million tonnes of CO2 in 2019 (IEA, 2019), almost twice as much as the overall CO2 emissions of the UK (BEIS, 2020).
Although global demand for pure hydrogen has been slowly rising for the past decades (mainly due to the increase demand for refining and ammonia used for agricultural purposes), most projections suggest that it will grow significantly faster in the coming years. BloombergNEF projects that hydrogen demand will grow 3-22x between 2020 and 2050, depending mainly on policy support across the globe (BloombergNEF, 2020).
The projected increase across various demand sectors is particularly evident in ‘difficult-to-decarbonise’ sectors, which have very few alternative low-carbon options to meet the net-zero targets. These sectors include heavy duty transport, shipping, aviation, high-grade heat used for industry or large-scale, long-term storage of renewable electricity generation. Figure 2.4 shows an example of global hydrogen demand projection between 2019 and 2070 (IEA, 2020)[5].
2.2.2 Hydrogen Demand in Europe and the UK
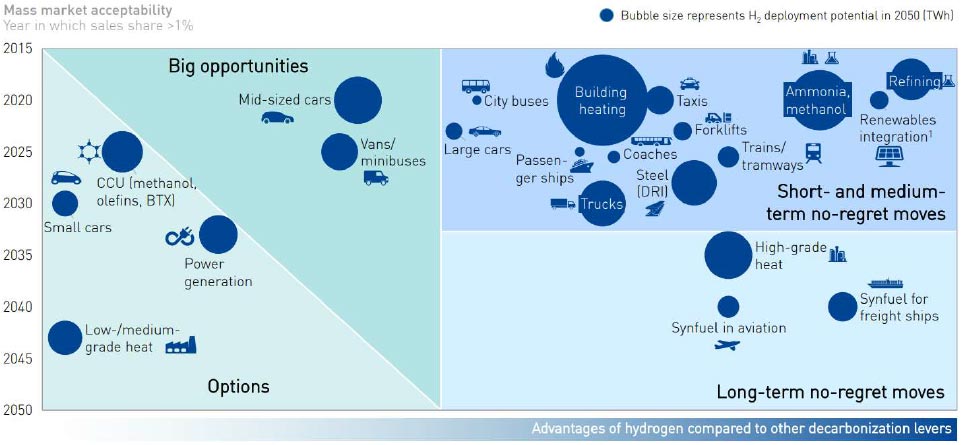
Although hydrogen can be used as an energy vector to decarbonise the majority of energy sectors, some sectors are more likely to adopt hydrogen technologies than others as shown in Figure 2.5. The figure shows the key sectors that could most benefit from the adoption of hydrogen technology and includes the anticipated timeframes for these solutions to be able to be deployed on a large-scale. Hydrogen use within sectors like power generation or low and medium grade industrial heat are expected to face stronger competition from other low-carbon alternatives. On the other hand, heating in buildings, ammonia production and refining could become the largest sectors in the hydrogen economy between 2020 and 2035. Sectors such as high-grade heat, aviation or shipping are also likely to rely significantly on hydrogen supply, although this is likely to be further into the future, 2035-2050. This is because zero-carbon hydrogen is one of the only solutions to decarbonising these energy intensive sectors (FCH JU, 2019) (OREC, 2020).
The disparity between certain parts of the world with abundant, low-cost energy sources (both natural gas and renewable electricity) and other regions with higher hydrogen demand could result in an international hydrogen trade development.
The European Union (EU) Fuel Cells and Hydrogen Joint Undertaking (FCH JU) initiative estimates that hydrogen could supply up to 24% (2,250 TWh) of total energy demand by 2050 if the 2-degree target is to be met, around 85% of the current global hydrogen production. This is equivalent to fuelling 42 million large cars, 1.7 million trucks, 250,000 buses, and more than 5,500 trains[6] (FCH JU, 2019). Two key scenarios representing rapid uptake of hydrogen technologies by 2050 compared to a business-as-usual scenario are shown in Figure 2.6
The figure shows that transport and heat are the two key sectors to be decarbonised with hydrogen technology. Industry is also likely to use hydrogen as the main driver, whereas power generation represents the lowest need for hydrogen technology. Renewable power generation is rather the key enabler of green hydrogen production through electrolysis.
Future hydrogen demand projections for the EU vary greatly depending on each scenario. In the business-as-usual scenario, hydrogen will have insignificant importance on the overall energy mix. In the high-grade heat segment, it would gain a maximum market share of 7% in 2050, equivalent to 50 TWh of hydrogen demand. On the other hand, the ambitious scenario estimates that hydrogen will be used across all energy sectors, particularly for transportation, heating and power for buildings, and industry.
Sectors that will rely on fuel cells, such as transportation, will require hydrogen with high purities. Green hydrogen produced through electrolysis can meet the purity criteria. Hydrogen produced through other methods, such as SMR, will require additional processes to reach the required purity levels. It should be noted that this requirement does not apply to sectors where hydrogen is being burnt, such as the heat sector.
FCH JU predicts that no new SMR plants will be built after 2030 as electrolysis will become the cheapest way to produce hydrogen through economies of scale. Furthermore, all existing SMR plants will be gradually retrofitted with CCS to make the processes carbon neutral and further increase the price of hydrogen from natural gas (FCH JU, 2019). These scenarios demonstrate that although the actual volume of hydrogen required by 2030 and 2050 is uncertain, currently produced grey hydrogen will be replaced with electrolysis and CCS enabled SMR facilities.
One of the largest hydrogen sectors in Europe is likely to be heating, with hydrogen blending[7] already being pursued in countries such as Germany, France, the Netherlands and the UK. Pilot projects underway include:
- H100 Fife project in Scotland is aiming to use 100% hydrogen to heat 300 local homes in Levenmouth - a five-year fully operational phase is planned from 2022/2023 (SGN, 2020).
- The HyDeploy project in Germany (HyDeploy, 2020) and GRHYD project (Engie, 2020) in France which are both testing blending of up to 20% hydrogen
- Leeds is planning to be supplied with 100% hydrogen by 2028 through the H21 Leeds City Gate project (H21, 2020).
These frontrunners in blending or injecting pure hydrogen into the gas grid are likely to drive further uptake of hydrogen technology throughout Europe (FCH JU, 2019). Countries with the highest potential for hydrogen use in the heating sector as determined by FCH JU are shown in Figure 2.7. Based on the total energy demand and the percentages of natural gas share and the heating and cooling share, countries with the highest potential for replacing natural has with hydrogen are Germany, Italy, the Netherlands, UK and France.
Large-scale, low-carbon hydrogen production projects have also been advancing recently, which will be crucial to meet Europe’s hydrogen demand in line with the 2-degree target. Several major demonstration projects are underway. The first wind-to-hydrogen pilot sites are in operation or in construction across Europe, e.g., in Germany, UK, Italy, Spain, the Netherlands, Denmark, and in the North Sea for offshore wind (FCH JU, 2019).
A 100 MW power-to-gas plant known as Hybridge for sector coupling[8] is planned to be deployed in Germany in 2023 (Wind Power Monthly, 2019). Hybridge will produce green hydrogen using renewable solar and wind power to electrolyse water. The Hydrogen Valley project in Northern Netherlands is a new pilot scheme funded through the FCH JU initiative, expecting to further develop hydrogen technology together with Northern Germany (Hyer, 2019) (see Figure 2.8).
There is also the North Sea Wind Power Hub project (see Figure 2.9), which focusses on connecting 10,000 offshore wind turbines in the North Sea to a centralised artificial island. The project will enable a large-scale power-to-hydrogen production and is currently planned to be built after 2030 (FCH JU, 2019). The consortium currently includes the Netherlands, Germany and Denmark. Potential future member countries are UK, Norway and Belgium.
2.2.3 Scotland’s Hydrogen Demand Projections
This section includes the assessment of Scotland’s market demand for hydrogen between 2025 and 2045. Since the aim of this study was predominantly focused on the supply (upstream) and transport (midstream) of hydrogen, the hydrogen demand scenarios are aligned with the SHA.
It should be noted that hydrogen export is excluded from this initial assessment - it is focused on hydrogen demand in Scotland only. Any surplus from the hydrogen production scenarios considered in Chapter 4 will then be considered as ‘potential export’.
The three scenarios used in this report are as follows;
- Ambitious: Full transition towards a hydrogen economy in Scotland. This scenario is based on a combination of the most ambitious projections for each sector from the SHA.
- Planned Development: Optimistic scenario based on wide-ranging hydrogen technology deployment and use across various sectors. This scenario was aligned with Scenario A: ‘Hydrogen Economy’ from the SHA.
- Business as Usual: Conservative scenario with modest hydrogen use and extensive electrification across all sectors. This scenario was aligned with Scenario C: ‘Focused Hydrogen’ from the SHA.
Ambitious Scenario
The ambitious scenario focuses on Scotland’s hydrogen demand in 2025, 2032 and 2045, if Scotland’s hydrogen demand technologies were to be fully deployed across all energy sectors. This scenario was created by combining the most optimistic assumptions in each sector stated in the SHA.
2025
In 2025, hydrogen use across all sectors is relatively limited even in the ambitious scenario. There is modest uptake of hydrogen technologies within heat (0.9 TWh), transport (0.6 TWh), and industrial feedstock sectors (0.5 TWh), but none in the electricity sector.
Hydrogen in the transport sector is used predominantly in the public sector organisations – buses or council fleets. There are also some demonstration projects focused on hydrogen trains and ferries. Other demonstration projects include heat and industrial feedstock sectors. However, these are rather co-located projects (hydrogen is produced near the demand side, which results in a co-location of supply and demand) spread across Scotland (such as the H100 heating project in Fife), rather than a widespread hydrogen blending in the entire of Scotland. Even in this optimistic scenario, hydrogen only meets 1-2% of Scotland’s overall energy demand.
2032
By 2032, hydrogen technology undertakes a significant step from being a minor clean energy vector to become a key player in decarbonisation efforts. The heat sector especially has adopted green hydrogen as a viable clean energy source replacing natural gas within the national grid (up to 20% in the overall network and 100% in some isolated trial projects).
There is more than 10 TWh hydrogen used annually in the heat sector, almost 6 TWh of hydrogen used as industrial feedstock and nearly 5 TWh for transport. Hydrogen is also used as a back-up source within the power generation peaking plants[9] sector (more than 0.7 TWh). Hydrogen meets less than 15% of Scotland overall energy demand in 2032.
2045
By 2045, Scotland meets the net-zero target with hydrogen being at the core of this green energy transition. Scotland’s gas network has been fully converted for hydrogen use. Hydrogen has become the main commercial and domestic heating fuel (35 TWh), accounting for nearly half of the overall annual hydrogen demand in Scotland. Hydrogen is also extensively used as industrial feedstock (17.5 TWh).
Nearly all petrol and diesel vehicles have been replaced by hydrogen fuel cell or battery electric vehicles. Hydrogen is particularly popular within aviation, shipping and larger vehicles, whereas EVs target the smaller domestic vehicle market. Hydrogen accounts for more than 21.5 TWh within Scotland’s transport sector in 2045. Peaking plants have also increased their capacities to nearly 1.8 TWh. Hydrogen is widely used within Scotland’s distillery sector as well as heavy industries requiring high-grade heat. The overall annual hydrogen demand in Scotland is 76 TWh, around half of Scotland’s total energy demand.
Planned Development Scenario
The planned development scenario focuses on Scotland’s hydrogen demand in 2025, 2032 and 2045, assuming optimistic projections with regards to hydrogen technology uptake. This scenario was created by using the inputs from Scenario A within the SHA, called ‘Hydrogen Economy’, which is the most ambitious scenario within the SHA (when excluding hydrogen export).
2025
In 2025, hydrogen use in Scotland is relatively moderate, with most demand occurring within the heat and industrial feedstock sectors, followed by the transport sector. Hydrogen meets around 1% of Scotland’s annual energy demand.
2032
By 2032, hydrogen is used across all energy demand sectors, particularly to decarbonise heat. Hydrogen use within the transport sector is moderate due to the large uptake of EVs. However, the overall hydrogen demand has grown almost 12-fold since 2025.
2045
By 2045, Scotland meets the net-zero target, with hydrogen being at the core of this energy transition. All energy sectors use hydrogen to some extent, with the heat sector being the most prominent. The use of hydrogen within the transport sector is about 50% lower compared to the full potential scenario. Most of this hydrogen is used for larger service vehicles and fleets within the public sector. Some trains, ferries and small domestic aircrafts connecting remote airports also use hydrogen. Hydrogen blending within the gas network is the main driver of Scotland’s hydrogen use in 2045.
Business as Usual Scenario
In this scenario, hydrogen demand in 2025, 2032 and 2045 plays only a supporting role within the decarbonisation efforts in specific sectors and more remote regions. This scenario was created by using the inputs from Scenario C within the SHA, which assumed wider electrification to meet the 2045 net-zero target compared to the other two scenarios.
2025
In 2025, hydrogen is used only within the transport and industrial feedstock sectors, and even there only to a limited extent, 0.228 TWh and 0.175 TWh, respectively. Most of this hydrogen is used on Scotland’s islands in the food and drink industry, and within some public transport hubs, such as Aberdeen. Hydrogen is not used in the heat and electricity sectors. The overall hydrogen use is negligible compared to the overall energy demand in Scotland, less than 0.5%.
2032
In 2032, hydrogen demand has grown nearly 20-fold since 2025, across all demand sectors. Hydrogen is now used within the transport sector (almost 2 TWh), heat (almost 3 TWh), industrial feedstock (almost 2.5 TWh) and as a back-up electricity generation – gas-fired peaking plants (0.7 TWh).
Hydrogen is now being blended in the local gas grids, particularly in the north east and more rural areas of Scotland. Hydrogen meets around 5% of the total energy demand in Scotland.
2045
In 2045, Scotland meets the net-zero target with hydrogen playing a supportive role within the energy transition. Hydrogen use had increased approximately 3-fold between 2032 and 2045, accounting for more than 20 TWh annually. The most significant uptake of hydrogen technologies has been seen within the larger vehicles, low-grade heating and industry. Most hydrogen systems are co-located (i.e. hydrogen is generated local to point of use) but there is also some hydrogen blending and tube trailer distribution to supply the hydrogen refuelling station across Scotland.
2.2.4 Regional Demand Projections Comparison
The use of hydrogen strongly depends on the scenario assumption, which results in various future demand projections. However, all these scenarios show that hydrogen use across Scotland will be relatively low in the short term (2020-25). It is likely to grow more than 10-fold in the medium term (2025-32), and then increase around 3 times between 2032 and 2045 to meet Scotland’s net-zero target.
Figure 2.11 shows hydrogen demand projections for Scotland, UK and EU. Due to Scotland’s abundant offshore wind resource, it can be anticipated that Scotland’s green hydrogen production will have the potential to exceed Scotland’s hydrogen demand in the future. Therefore, the UK and EU hydrogen demand projections showed are used in Section 3.2 to estimate how much hydrogen could be used for domestic supply (to rest of the UK), or international export (to continental Europe), once Scotland’s hydrogen demand is met.
The EU hydrogen demand projections are based on Figure 2.6. The UK projections are based on Xodus’ internal modelling projections, which are aligned with The UK Clean Growth Strategy where possible (UK Gov, 2017). Scotland’s hydrogen demand projections were taken from Section 2.2.3.
2.2.5 Summary
- Currently worldwide demand for hydrogen is used as chemical feedstock and synthesised from fossil fuelled starting materials. This will change and branch into other sectors and there is a need for clean fuel.
- Trends in Europe show that the demand for hydrogen is increasing. Over the next 12 years, the sector that will grow the largest will be heating, In the next 30 years, the biggest market will be transportation by 2050.
This trend is different to those seen in Scotland which shows the largest sectors as heating > industrial feedstock > transportation by 2045. This is due to the geographical location of Scotland, where a larger portion of energy is used for heating. The rest of the UK requires equal amounts of energy for heating and transportation.
2.3 Hydrogen Demand Hubs Mapping
The following section provides an overview of the location of existing and future hydrogen projects in Scotland, the rest of the UK and continental Europe. The collation of existing hubs focused on grey hydrogen production in particular from SMR, partial oxidation (POX)[10], and as a by-product from other chemical productions.
In the absence of hydrogen demand data at present, it was deemed reasonable to assume that future hydrogen hubs are likely to be located to where existing hydrogen production hubs currently exist in the UK and the rest of Europe. Understanding the location of existing hydrogen hubs indicates where green hydrogen could begin to replace grey hydrogen in the short to medium term, since the demand for hydrogen is already there. These demand centres could potentially be target locations for Scotland to replace existing grey hydrogen and export green hydrogen to. It should be highlighted that these existing hydrogen hubs (chemical industry) are only one of many industries where green hydrogen can play a key role in the future decarbonisation efforts.
This section also provides a location overview of existing low-carbon hydrogen projects in operation and a lookahead into future approved hydrogen projects (currently in their initial concept, pre-construction or construction stages) based in Scotland, rest of the UK and continental Europe, which are. This will provide a reasonable comparison against existing grey hydrogen projects in these regions in order to determine whether any future hydrogen hub locations and therefore demand centres, are closely located to existing grey hydrogen hubs. This is a fast-evolving sector and while this report has attempted to capture the current snapshot as comprehensively as possible, it is recognised that there may be additional projects, especially if only recently announced.
The European maps also show the existing offshore pipeline infrastructure surrounding Scotland. It should be noted that the pipeline layer is presented only to provide an overview of the existing pipeline connections between Scotland and the rest of Europe without considering which pipelines could be suitable to be repurposed for hydrogen use. Further analysis of Scotland’s existing pipeline infrastructure is discussed in Section 3.3.
2.3.1 Existing Hydrogen Demand Hubs
The existing grey hydrogen production hubs in Scotland, the rest of the UK and continental Europe have been mapped out and are shown in Figure 2.12. The hubs sizes are based upon their hydrogen production capacity size. It should be noted that the mapping has considered both compressed gas and liquified hydrogen. It should also be highlighted that liquefied hydrogen plants account for less than 1% of the overall capacity.
It can be seen that there are only two grey hydrogen production plants in Scotland - the Air Products SMR plants in Greenock, and the Petroineos’ plant in Grangemouth. Due to lack of data availability with respect to the actual hydrogen production capacity in Grangemouth, it was assumed that the SMR plant is able to produce the same amount of hydrogen as that operated by BOC in Teesside, Middlesbrough, at circa 88,500 kg/day based on a hydrogen study previously performed by Xodus for the OGTC (Xodus, 2019).
The majority of SMR facilities in the UK are based in England and represent a potential source of demand if the existing UK grey hydrogen sector was to become decarbonised by Scotland’s green hydrogen. Blue hydrogen is a potential competitor in this sector, dependent on the further deployment of CCUS.
Regarding continental Europe, existing hydrogen production plants are predominantly located in Germany, Netherlands, Belgium, France, Spain and Italy. Although not all these countries are located within close proximity to Scotland, hubs located in Northern Europe could become hydrogen importers of green hydrogen produced in Scotland. Especially Germany and the Netherlands could become major importers, as these countries currently produce more than 50% of the total hydrogen production in Europe.
2.3.2 Low-Carbon Hydrogen Demand Hubs in Scotland
Existing and proposed low-carbon hydrogen projects in Scotland are shown in Figure 2.13. It should be highlighted that these include not only operational projects but also planned projects, currently in their initial concept, pre-construction or construction stages. These projects have been coloured based on the type of projects. It should be highlighted that analysis was based on the number of projects planned in each region in the absence of plant capacity information. The project locations can then be compared with the existing hydrogen hubs to assess whether the existing demand centres trend are still valid for future projects.

It can be seen that Scotland has been very active in developing pilot hydrogen projects across the country. The map shows a total of 40 hydrogen projects in Scotland either operating or in the project pipeline. This demonstrates Scotland’s dedication to build upon its hydrogen ground-breaking projects such as Surf’n’Turf in Orkney, OHLEH in the Western Isles or hydrogen buses in Aberdeen. Figure 2.13 also shows that the majority of projects include green hydrogen production (dark purple, dark blue, light blue and dark green colours), which supports the idea of Scotland being a green hydrogen production hub (due to its abundant renewables resources) and potentially export the surplus hydrogen to the rest of the UK and continental Europe in the future. Hydrogen project titles shown in the map are summarised in Table 3.1
| Reference | Hydrogen Project Titles | Reference | Hydrogen Project Titles |
|---|---|---|---|
| 1 | High V.LO-City | 21 | HyGEN |
| 2 | Acorn CCS and Hydrogen | 22 | HyGEN |
| 3 | BIG HIT | 23 | Huntly Hydrogen |
| 4 | Surf n' Turf Orkney | 24 | Hydrogen 100 |
| 5 | Levenmouth Hydrogen Office | 25 | HyTrec2 |
| 6 | PURE | 26 | Aberdeen Vision |
| 7 | H2 Aberdeen Hydrogen Bus | 27 | JIVE and JIVE 2 |
| 8 | Dolphyn | 28 | HySEAS3 |
| 9 | ReFLEX | 29 | SeaFuel |
| 10 | HySpirits | 30 | ORION Project |
| 11 | Project Methilltoune | 31 | HyFlyer |
| 12 | HOP Project | 32 | Aberdeen Hydrogen Hub |
| 13 | Orkney Green Ammonia Plant | 33 | Green Hydrogen for Glasgow |
| 14 | ITEG | 34 | Hydrogen Dual Fuel Gritters |
| 15 | PITCHES | 35 | CX Project |
| 16 | Orkney H2 Strategy | 36 | Hydrogen Accelerator |
| 17 | Outer Hebrides Local Energy Hub (OHLEH) | 37 | HyStorPor |
| 18 | Scottish Western Isles Ferry Transport using Hydrogen (SWIFTH2) | 38 | Cromarty Firth Green Hydrogen Hub |
| 19 | HyDIME | 39 | Michelin Scotland Innovation Parc |
| 20 | HyGEN | 40 | Dundee Hydrogen Refuelling Station |
2.3.3 Low-Carbon Hydrogen Demand Hubs in the Rest of the UK and Continental Europe
Existing and proposed low-carbon hydrogen projects in the rest of the UK and continental Europe are shown in Figure 2.14. Similarly to the Scotland hubs mapping, these include both, existing and planned projects. They have been coloured based on the type of projects, and in the absence of plant capacity information, the basis of the mapping has considered the number of future hydrogen hubs and the type of projects in each country. This provides an indicative forecast into the likely location of future hydrogen demand centres in Europe.
Regarding domestic export opportunity, it can be seen that England could become an importer of Scottish green hydrogen. Although the majority of existing and proposed projects in England currently consider matching hydrogen supply and demand on-site, larger demand projects in the future may require more hydrogen than can be produced locally. Considering Scotland’s vast offshore wind resources, green hydrogen could be exported particularly to Northern England to meet future hydrogen demand.
Regarding international export opportunity, it can be seen the vast majority of planned hydrogen projects are located in Germany, which aligns with the recent announcements made by the German Government. Another potential importer of Scotland’s green hydrogen could be Belgium, which has several hydrogen demand projects in the pipeline.
Whilst Netherlands may not yet be demonstrating as many hydrogen projects, it is effectively one of the hubs for the movement/import of energy (mostly fossil fuels) into Europe. Therefore, it may reasonably be expected that they will follow, and there exist hydrogen cooperation plans such as The Hydrogen Valley (Hyer, 2019).
The map also shows that there are existing pipeline connections to Belgium and the Netherlands. As discussed in more detail in Chapter3, opportunity may exist to repurpose these pipelines for hydrogen export to Europe. Further detailed analysis is required to assess pipeline opportunities.
Germany, the Netherlands and Belgium are likely to become the leaders in the number of hydrogen demand projects, which suggest their suitability as potential target locations for Scotland to export green hydrogen to in the future. The high number of future hydrogen projects in these three countries can be partially attributed to the fact that that most of the cities where these projects would be located, are densely populated, leading to a higher demand and that Germany, the Netherlands and Belgium have very strong and ambitious climate change policies attempting adherence to the Paris agreement.
It should be noted that whilst Spain, which is currently a large producer of hydrogen in Europe, does not look to have secured and confirmed as many future hydrogen hub projects as other European countries, the country still has potential in leading hydrogen production for Europe due to its substantial solar and wind resources. Consequently, for Scotland, Spain could become one of the main green hydrogen export competitors if they decided to harness their abundant renewable energy resources for green hydrogen production.
2.3.4 Other Regions with Green Hydrogen Export Potential
Based on the recent announcements, Portugal could become Scotland’s main competitor with regards to green hydrogen export to Northern Europe. In September 2020, The Portuguese and Dutch Governments agreed on a project to export green hydrogen from Sines to the Port of Rotterdam, Europe’s largest seaport (PV-Magazine, 2020). The project will aim to develop a strategic export-import value chain to produce and transport green hydrogen within continental Europe. It can be expected that there will be more green hydrogen projects announced in Portugal, following the launch of Portuguese national hydrogen strategy in May 2020, as well as the Portuguese Government’s recent call for hydrogen projects, which attracted more than £14bn of proposed investments (PV-Magazine, 2020).
Scotland’s green hydrogen export sector may not only need to compete with other European countries with abundant wind and solar resources, such as Portugal, but also with countries located in Northern Africa and Middle East. Considering that around 80% of green hydrogen production costs are associated with the cost of electricity input (Committee on Climate Change, 2018), countries with very low cost solar will be able to produce green hydrogen cheaper that Scotland’s offshore wind. In July 2020, the Al Dhafra facility in the United Arab Emirates secured world’s cheapest solar deal with a 2GW capacity and at £10.4/MWh of a levelized cost of electricity (Recharge, 2020). Even with the most ambitious cost reduction curve for Scotland’s offshore wind, this electricity cost is not realistically achievable. However, green hydrogen also incurs cost for water sourcing, purification and desalination. Regions such as the Middle East with high solar energy potential may likely generally be areas of higher water scarcity and higher cost of water supply and treatment. It has been beyond the scope of this study to evaluate LCOH for representative solar green hydrogen production, but it would be wrong to conclude a compelling cost advantage based purely on lower cost of electricity alone.
Additionally, exporting green hydrogen internationally involves not only costs associated with production but also with storage and transportation of hydrogen. The current state of hydrogen transportation over long distances is still at its infancy, particularly when it comes to shipping. There are some pilot projects looking into shipping hydrogen via liquefication, ammonia or liquid organic carriers, which are further discussed in Section 3.3. Notably in June 2020, Germany signed green hydrogen cooperation agreement with Morocco to import green hydrogen by using Morocco’s abundant solar resources (Fuel Cells Work, 2020). These are the first signs of Scotland’s potential competition against countries beyond Europe.
Although the future costs associated with these hydrogen shipping technologies are uncertain, preliminary estimates suggest a cost range of at least £1-£2.3/kg depending on the transportation method used. In the future, exporting hydrogen as ammonia is projected to cost at least £1/kg, liquefied hydrogen £2.2/kg and liquid organic hydrogen carriers £2.3/kg (Macquarie, 2020) (BloombergNEF, 2020). It should be highlighted that all these projections consider optimistic assumptions within each technology.
These hydrogen shipping projections could then be added on top of the hydrogen production estimates and compared to the cost of Scotland’s green hydrogen export analysed in Section 4.2 Due to the opportunity of using hydrogen pipelines to export Scotland’s green hydrogen to Northern Europe, it is likely that Scotland’s green hydrogen can remain cost competitive with green hydrogen from Northern Africa or Middle East especially if the cost of hydrogen shipping remains relatively high. Political and regulatory stability may also favour Scottish hydrogen over some potential alternative sources.
2.3.5 Summary
Regionally, it can be concluded that Scotland is on its way to host the highest number of future planned hydrogen projects, followed by England, and Wales. However, it should be highlighted that the scale of these projects has not been compared in the analysis. It is likely that the size of some hydrogen demand projects in England, will be significantly larger than many projects in Scotland, which would make England a larger hydrogen demand hub. Considering Scotland’s untapped offshore wind resources and the energy net exporter legacy, it can be anticipated that some of England’s future hydrogen demand hubs could be supplied by Scotland’s green hydrogen as discussed in Section 3.2.
From the analysis and comparison between existing and future hydrogen hub projects in Continental Europe, there exists a number of major hydrogen users, particularly Germany, the Netherlands and Belgium. These European countries present a significant opportunity within the European market for Scotland to export green hydrogen to in the future.
Although Scotland and Portugal may currently not seem to have direct competitors for green hydrogen export based on confirmed projects, Spain and countries in Northern Africa and Middle East could become notable competitors in the future if they decided to harness their wind and particularly solar resources for green hydrogen production and export to Northern Europe.
Considering Scotland’s green hydrogen export cost-competitiveness against other regions (particularly out with Europe), it can be expected that Scotland’s green hydrogen can remain cost-competitive with Northern Africa’s or Middle East’s solar especially if the cost of hydrogen shipping remains relatively high. However, further analysis will be required to assess this risk and thoroughly compare regions with abundant solar resources with Scotland’s green hydrogen from offshore wind.
2.4 Hydrogen Cost Parity Projections
Green hydrogen has the potential to decarbonise various energy-intensive sectors which currently rely on the use of fossil fuels. This section focuses on calculating the cost of current fuels used in different energy sectors in 2020. These 2020 costs are then used to estimate how these costs are likely to change by 2032.
Cost estimates indicate the end user price of hydrogen equivalent to the cost of use of fossil fuels. Therefore, the values described in this section are the cost parity levels at which hydrogen would need to be sold for in order to be competitive with its fossil fuel equivalent for the same service. Put another way, the higher the cost parity projections, the better for hydrogen technology. E.g. if cost parity in the transport sector in 2032 is £3.5/kg and the levelised cost of green hydrogen production and delivery to the refuelling station is £3/kg, hydrogen would be cost competitive since it would be able to supply hydrogen at a lower cost than it could sell it for. This section only focuses on the end-user price, whereas hydrogen production costs are assessed later in the report.
Hydrogen can replace various fossil fuel sources across different sectors, which means that the end-user market price will vary significantly across the demand sectors. These markets were assessed independently to establish the corresponding market prices based on the fossil fuel type and sector to meet these demands.
These projections are used later in this study to outline potential subsidies that will be required to decarbonise Scotland’s energy-intensive demand sectors based on the difference between hydrogen supply costs and the cost parity projections.
The assessment included 8 demand sectors, which represent the most likely demand sectors for green hydrogen in the future. The following sectors were included in the assessment:
- Cars
- Buses
- Trains
- Chemical feedstock (ammonia production and refining)
- Ferries
- Aviation
- Heat
- Electricity.
It should be noted that this study only focused on the sale price of the fuels and does not take account of lifecycle or maintenance costs of the technology unless otherwise stated. This is to compare only the operating costs in a given sector. Where applicable, hydrogen cost parity projections are compared to other zero-carbon technologies that are likely to compete with hydrogen technology (such as electric vehicles).
The cost parity outputs are based on the final price paid by consumers. The proportion of fuel duty and value-added tax (VAT) within each sector is assessed in Section 2.4.2.
2.4.1 Modelling Assumptions and Outputs
The cost parity projections for 2032 identified hydrogen cost per sector that the end-users are likely to be willing to pay to replace the use of fossil fuels. The analysis was based on cost parity with the current status quo based on operational costs to deliver the same service. The existing costs of fossil fuels were based on the costs paid by the end-user at the point of delivery (e.g. hydrogen would replace petrol or diesel at the refuelling station). Therefore, factors such as fuel duty and VAT were included in the calculations.
For transport sectors, the table below shows how the hydrogen cost parity was calculated for each sector.
| A | Fuel consumption of fossil fuelled sector over distance (litres/100km for example with cars) |
| B | Hydrogen fuel consumption of equivalent sector (kg/100km for example with cars) |
| C | Cost of Fossil Fuel (£/litre for example with petrol) |
| 2020 hydrogen cost parity = [A]/[B]*[C] | |
| 2032 hydrogen cost parity (£/kg) |
The average quantity unit (distance/volume/power) for both the fossil fuelled technology [A] and its hydrogen equivalent [B] is determined. The cost per quantity unit [C] of the appropriate fossil fuel is then used to determine what the cost of hydrogen would need to be, the cost parity, in 2020 to equal the cost of its fossil fuelled equivalent.
For sectors that do not have a hydrogen technology equivalent, energy content values of the fossil fuel and equivalent amount of hydrogen are compared to determine the hydrogen cost parity.
The hydrogen cost parity for 2032 was then determined using fuel cost projections. For petrol, diesel and marine gas oil (MGO), projections taken from 2019-2032 in the US (EIA, 2020) were used to obtain a factor of change and applied to UK government values in 2019.
For natural gas projections and kerosene for aviation, UK projections from 2015-2035 were taken from Statista and values for 2032 were extrapolated (Statista, 2020) (Statista, 2020). Since steam methane reformed hydrogen uses a natural gas feedstock, projections for chemical feedstock hydrogen were also projected via this method.
2.4.1.1 Cars (light-duty road transport)
| A | Average UK petrol car fuel consumption | 5.46 | litres/100km |
| B | Average hydrogen fuel consumption of Toyota Mirai | 0.94 | kg/100km |
| C | Cost of UK petrol in 2019 | 1.25 | £/litre |
| 2020 hydrogen cost parity [A]/[B]*[C] | 7.3 | £/kg | |
| 2032 hydrogen cost parity (£/kg) | 7.8 | £/kg |
The bestselling fuel cell electric vehicle (FCEV) in the world is Toyota Mirai, with a fuel economy of 0.94 kg of hydrogen / 100 km based on the Worldwide Harmonised Light Vehicle Test (WLTP) combined cycle (Grange, 2020). An average petrol car in the UK uses 5.46 litres of petrol per 100 km (GOV UK, 2019). This value also aligns with the WLTP combined cycle of smaller petrol cars similar sized to Toyota Mirai (Grange, 2020). Considering the average cost of unleaded 95 Octane in the UK in 2019-2020 (UK Gov, 2020), average light-duty vehicles pay on average £7.3 per 100 km. This cost is likely to increase to £7.8 by 2032, based on petrol cost projections for 2032 (EIA, 2020).
Considering the increasing market penetration of hybrid electric vehicles and the fact that an average UK petrol car fuel consumption varies significantly, Toyota Mirai was also compared to a new hybrid electric vehicle, which is more efficient than an average UK petrol car.
| A | New hybrid electric car fuel consumption | 4.32 | litres/100km |
| B | Average hydrogen fuel consumption of Toyota Mirai | 0.94 | kg/100km |
| C | Cost of UK petrol in 2019 | 1.25 | £/litre |
| 2020 hydrogen cost parity [A]/[B]*[C] | 5.7 | £/kg | |
| 2032 hydrogen cost parity (£/kg) | 6.2 | £/kg |
In this scenario, Toyota Mirai was compared to Toyota Prius electric hybrid based on its WLTP combined cycle (Toyota, 2018). The remaining assumptions remained identical to the previous calculations, which resulted in lower cost parity outputs compared to the average UK petrol vehicle. It should be highlighted that plug-in electric hybrid cars were not included in the analysis.
Competition with other zero-carbon technologies
Although this study is predominantly focused on the cost competitiveness of hydrogen technology versus fossil fuels, it should be highlighted the main competitor of FCEVs in 2032 will be battery electric vehicles (BEVs). Both technologies can be powered via zero carbon fuels (green hydrogen or renewable electricity), therefore contributing towards Scotland’s decarbonisation efforts within the transport sector. Although pure energy input costs are likely to favour BEVs, particularly in areas with sufficient electricity grid capacity to accommodate charging, FCEVs may become a feasible option for light-duty vehicles that require frequent refuelling and operate in areas with already constrained electricity grids.
It will cost approximately £2.8 to travel 100 km in a BEV in 2032, assuming home charging of Nissan Leaf and future electricity retail cost projections (Nissan, 2020) (Statista, 2020) (UK Gov, 2019) . Therefore, hydrogen used in a Toyota Mirai would need to cost £2.8/kg to become cost competitive with BEV electricity charging at home. On the other hand, charging a BEV via a 50-150kW rapid charger is significantly faster and more expensive compared to home charging. Assuming current rapid charging costs and future electricity cost projections, this would equate to a cost parity projection of £7.9/kg for hydrogen dispersed at a refuelling station in 2032 (Shell, 2020) (Statista, 2020). This value is close to the projected cost parity with average petrol cars.
A range of hydrogen fuel cell range extenders have also been developed and are in operation in Orkney. This uses hydrogen fuel cell technology to power the batteries in BEVs and provides additional mileage without recharging the battery at a fixed power supply (SeaFuel, 2019). This combines both technologies and could be another avenue where FCEV technology is taken up.
Although this report is predominantly focused on the upstream and midstream aspects of hydrogen technology, it can be expected that some light-duty vehicles sold in 2032 will be FCEVs, rather than entirely BEVs.
2.4.1.2 Buses
| A | Average diesel hybrid bus fuel consumption | 32.3 | litres/100km |
| B | Hydrogen bus fuel consumption | 8.57 | kg/100km |
| C | Cost of UK diesel in 2019 | 1.32 | £/litre |
| 2020 hydrogen cost parity | 5.0 | £/kg | |
| 2032 hydrogen cost parity (£/kg) | 5.5 | £/kg |
An average diesel hybrid bus operating in London has a fuel economy of 7.3 to 8.8 miles per gallon (mpg) (Lin, Partridge, & Bucknall, 2016). A fuel consumption of 8.8 miles per gallon was selected for the calculations, assuming that these are new buses that would be competing with new hydrogen buses. The Aberdeen hydrogen refuelling station, Kittybrewster, can produce up to 300 kg of hydrogen a day to refuel 10 buses to travel up to 350 km (The Engineer, 2020). This aligns with the fuel economy outlined by Hydrogen Europe, which states that new hydrogen fuel cell buses use 8 to 9 kg per 100 km (Hydrogen Europe, 2017) [11]. Therefore, hydrogen parity for buses to replace diesel is estimated to be 5/kg of hydrogen in 2020. Hydrogen could be sold for £5.5/kg in Scotland in 2032 to achieve the cost parity with an average hybrid bus based on diesel cost projection for 2032 (EIA, 2020).
Competition with other zero-carbon technologies
Similarly to light-duty vehicles, hydrogen powered buses sold in 2032 will have to compete with battery electric buses, as both of them can use zero-carbon fuels. Hydrogen buses are likely to become more competitive with battery electric buses particularly for longer distances and when fast and frequent refuelling is required.
The energy consumption of battery electric buses can range between 1 and 3.5 kWh/km, depending on many parameters, such as bus technology, traffic conditions, number of passengers or route profile (Pamula & Pamula, 2020). Assuming an average energy consumption rate of 1.41 kWh/km as outlined in the report and future electricity cost projections (slow charging), the cost parity of hydrogen buses versus battery electric in 2032 would be £3/kg. However, slow charging may only be available for shorter, less frequent routes.
This cost parity trend is similar to light-duty vehicles; buses with relatively low daily mileage will be able to be charged overnight, profiting from lower electricity costs and lower charger capacity requirements. Buses that will need to be recharged frequently and quickly throughout the day be more suitable for hydrogen technology.
2.4.1.3 Trains
| A | Average diesel train fuel consumption | 49.28 | litres/km |
| B | Hydrogen fuel cell train consumption | 1.0 | kg/km |
| C | Cost of UK diesel in 2019 | 0.85 | £/km |
| 2020 hydrogen cost parity | 3.1 | £/kg | |
| 2032 hydrogen cost parity (£/kg) | 3.4 | £/kg |
Average per-passenger fuel economy of diesel trains varies significantly depending on the type of journey. E.g. intercity trains are more efficient compared to commuter trains (58.93 miles per passenger US gallon compared to 39.63) (AFDC, 2020), since they experience fewer stop-start situations. An average fuel economy between intercity and commuter trains was used for the calculations and multiplied by 300 passengers to align with the hydrogen fuel cell train capacity - Alstom iLintFCH. The train consumes 0.275 kg of hydrogen every kilometre and has a passenger capacity of 300 (Hydrogen Europe, 2018). It should also be noted that diesel used for trains attracts lower Fuel Duty compared to road transport (such as cars or buses), as can be seen in Table 2.2
Competition with other zero-carbon technologies
Regarding the competition of electric versus hydrogen trains, it is likely that electrified train lines will be used in densely populated areas with frequent routes, whereas hydrogen powered trains and battery electric trains may split the market with battery powered trains serving shorter routes and hydrogen powered trains serving longer routes in remote, rural areas where trains run more sporadically. This is because the electricity infrastructure required to power electric trains is costly and can be justified only when transporting high number of passengers or goods, usually over shorter distances.
2.4.1.4 Chemical Feedstock
| 2020 hydrogen cost parity | 2.0 | £/kg |
| 2032 hydrogen cost parity (£/kg) | 2.6 | £/kg |
Currently in the UK the cheapest way to purchase large quantities of grey hydrogen, would be for the supplier to build a dedicated SMR on site connected to the NTS and convert the hydrogen from natural gas. The quoted cost for such a supply is approximately £2/kg of hydrogen produced, which covers CAPEX and OPEX for the equipment required and supply of natural gas (TNEI and Pure Energy Centre, 2020).
SMR produces hydrogen from methane with a by-product of carbon dioxide which is vented to atmosphere. This is the most common way to produce hydrogen at present and does not incorporate carbon capture (this would add approximately £0.5/kg of hydrogen produced). Cost parity of green hydrogen is estimated to be £2.6/kg by 2032, based on the future projections of natural gas cost in the UK (Statista, 2020).
It should be highlighted that existing hydrogen producers (SMR operators) are not necessarily the same companies as the hydrogen end-users. These hydrogen merchants currently sell hydrogen in the UK for around £2/kg. Therefore, green hydrogen would have to directly compete with these merchants that own SMR facilities. If green hydrogen can offer equal (or lower) price than these existing producers, then the hydrogen end-user would be likely switch to green hydrogen. However, a lower cost parity projection would apply to hydrogen end-users who already own an existing SMR facility to produce their own hydrogen, as their facility is sunk cost. The green hydrogen supply this has to compete with operating costs only, which are mainly related to the use of natural gas (rather than paying the full hydrogen merchant price).
Competition with other zero-carbon technologies
There is no alternative technology to compete with hydrogen, which is already used as chemical feedstock. The only future competition for green hydrogen would be blue hydrogen. However, this section is focused on the demand side rather than supply. Therefore, the dominant role of hydrogen used as key feedstock to the chemical industry is likely to remain in the future, with the only difference being the type of hydrogen supplied.
2.4.1.5 Ferries
| Marine gas oil ferry plant efficiency | 0.37 | - |
| Hydrogen fuel cell ferry plant efficiency | 0.4 | - |
| LHV of marine gas oil | 11.89 | kWh/kg |
| LHV of hydrogen | 33.3 | kWh/kg |
| Cost of UK marine fuel in 2019 | 0.5 | £/litre |
| 2020 hydrogen cost parity | 1.5 | £/kg |
| 2032 hydrogen cost parity (£/kg) | 1.9 | £/kg |
Based on the Scottish Western Isles Ferry Transport using Hydrogen (SWIFTH2) project (Point and Sandwick Trust, 2019), an average MGO plant efficiency is 0.37 compared to a hydrogen fuel cell plant efficiency of 0.4. These efficiencies combined with Lower Heating Values of each fuel were then used to calculate the cost parity. The average current MGO cost in Scotland is £0.50/litre (TNEI and Pure Energy Centre, 2020) (Point and Sandwick Trust, 2019)[12].
Competition with other zero-carbon technologies
Using green hydrogen to power ferries is likely to become a feasible low-carbon option, rather than using battery electric ferries. Battery electric ferries may be used only for very short journeys. Space restrictions and weight allowance are important aspects of seagoing transport, which is why batteries are not expected to become widely deployed within the ferry sector compared to hydrogen systems.
2.4.1.6 Aviation
Aside from small scale trials currently being conducted under the HyFLYER programme by ZeroAvia, no comparable hydrogen aviation technology exists in the larger scale.
| LHV Kerosene | 11.94 | kWh/kg |
| LHV Hydrogen | 33.3 | kWh/kg |
| Average UK kerosene retail price for aviation in 2020[13] | 0.42 | £/kg |
| 2020 hydrogen cost parity | 1.2 | £/kg |
| 2032 hydrogen cost parity (£/kg) | 1.6 | £/kg |
Using hydrogen to decarbonise the aviation sector is an emerging concept, with exact technology and set-up still unknown. For example, hydrogen could take up more space, potentially taking away seats in what would normally be the passenger cabin or space in the cargo hold. Lower Heating Values of hydrogen and kerosene were compared only for a very high-level cost parity indication. Further information about hydrogen-powered aviation can be found in the recent EU report (FCH JU, 2020).
Average UK aviation kerosene retail price in 2020 was £0.42kg based on aviation kerosene density of 0.81kg/l (Chevron, 2007) and cost of £0.34/l (Statista, 2020). This means that hydrogen would have to cost £1.6/kg in 2032 to compete with kerosene used in aviation based on future price projection for kerosene in the UK (Statista, 2020) and assuming its use does not suffer from any other inconvenience, such as lower payload volumes, which are likely to occur due to hydrogen’s lower energy density.
Competition with other zero-carbon technologies
Similarly to seagoing ferries, hydrogen planes are likely to be more suitable for longer (transatlantic) journeys, whereas battery electric planes may only be able to compete with hydrogen technology on journeys that are shorter and carry less cargo. Future zero-carbon planes may also be powered by synthetic fuels. However, synthetic fuels also require green hydrogen as a zero-carbon feedstock, so the role of green hydrogen in aviation is likely to be significant to meet Scotland’s net-zero targets by 2045.
2.4.1.7 Heat
| HHV Natural gas | 14.5 | kWh/kg |
| HHV Hydrogen | 39.4 | kWh/kg |
| Average domestic gas price in Scotland in 2019 | 44.5 | £/MWh |
| 2020 hydrogen cost parity | 1.8 | £/kg |
| 2032 hydrogen cost parity (£/kg) | 2.3 | £/kg |
The average domestic gas price in Scotland in 2019 was 4.45 pence per kWh using the average of all payment types (UK Gov, 2020). It should be highlighted that this price is what the average consumer paid in Scotland in 2019, which includes the cost of natural gas supply, transmission and distribution to Scotland’s homes. Based on Higher Heating Value (HHV) of natural gas and natural gas cost projections in 2032 (Statista, 2020), hydrogen cost parity equals to £2.3/kg in 2032, as hydrogen contains more energy per mass compared to natural gas. This is the price that hydrogen would have to be sold for to Scotland’s domestic consumer to compete with natural gas.
Competition with other zero-carbon technologies
Although natural gas used within the UK heat sector offers a very low-cost parity projection for green hydrogen, it is still likely that hydrogen will be one of the only solutions to decarbonise the UK heat sector. There are other options to deliver zero-carbon heat, such as heat pumps, biomethane or biomass boilers. Particularly heat pumps are likely to be the main competitor of green hydrogen technology. However, it can be expected that heat pumps will not be able to decarbonise Scotland’s entire heat sector, especially since the natural gas grid infrastructure is already in existence and extensive and could be converted for hydrogen use in the future.
Although the cost comparison of heat pumps and hydrogen boilers depends on many aspects, it is likely that neither of these technologies will be able to compete with the current cost of natural gas. Progressive incentive (or natural gas disincentive) will be required to decarbonise Scotland’s heat sector as discussed in Section 4.3. Considering that Scotland’s heat demand accounts for more than half of Scotland’s overall energy demand, it is likely that heat pumps and hydrogen systems will have to work hand in hand to decarbonise this ‘hard-to-abate’ sector.
2.4.1.8 Electricity
Key assumptions and results
| LHV Natural gas | 13.1 | kWh/kg |
| LHV Hydrogen | 33.3 | kWh/kg |
| Average UK wholesale gas price 2019 (HHV) | 16.4 | £/MWh |
| 2020 hydrogen cost parity | 0.5 | £/kg |
| 2032 hydrogen cost parity (£/kg) | 0.7 | £/kg |
The cost parity calculations within the electricity sector is the most challenging due to its dynamic nature. Considering that the vast majority of Scotland’s electricity generation already comes from renewables, natural gas is used for electricity generation predominantly when electricity demand exceeds supply to balance the grid. This often coincides with times when the wholesale price of natural gas is significantly higher than average, driven by the increased demand requirements.
If this dispatchable electricity generation currently provided by natural gas peaking plants was to be replaced with green hydrogen, it would require substantial amounts of hydrogen being stored. Dispatchable electricity generation in Scotland is often required when there is not enough wind generation available, therefore hydrogen would have to be stored and readily available to address the supply-demand imbalance. As discussed in Section 3.3, Scotland’s large hydrogen storage caverns are primarily located offshore, which would add substantial cost to the dispatchable fuel supply but could offer higher than average market price due to the increased electricity demand requirements.
Assessing the cost of large-scale hydrogen storage or Scotland’s hourly/daily electricity supply-demand profile was beyond the scope of this initial study. Therefore, the cost parity results within the electricity sector are only indicative, based on the average wholesale price of natural gas and Lower Heating Values of natural gas and hydrogen, assuming that hydrogen would be burnt in large hydrogen gas turbines to generate electricity. This high-level comparison resulted in a hydrogen cost parity price of £0.7/kg of hydrogen in 2032 to be able to compete with large-scale natural gas-peaking plants based on cost projections for 2032 (Statista, 2020). However, due to the complexity of the topic and the non-inclusion of storage CAPEX and OPEX in the simplified analysis, cost parity with natural gas for electricity is excluded from parity summary figures later in this section
Competition with other zero-carbon technologies
The electricity generation sector is likely to be one of the most difficult for hydrogen technology to enter. Electricity generation from green hydrogen could only be used as a dispatchable, back-up source when renewable generation cannot meet the longer-term electricity demand. This introduces the complexity of seasonal hydrogen storage and additional CAPEX and OPEX for large-scale offshore storage. Whilst it is possible that cavern storage could be replenished during times of low electrical cost (or during period where wind energy is curtailed) , the overall efficiency of converting renewable electricity to hydrogen and then back to electricity is very low and is most likely to be used only as a last resort option.
2.4.2 Assessment of Taxes
Fossil fuels sold and used in the UK fall under different categories based on guidance provided by Her Majesty's Revenue and Customs (HMRC). Since hydrogen could be used to replace various fossil fuels in different sectors Table 2.2, shows fuel duty and VAT assumptions applied within each sector. It is noted that there are complex exemptions in each sector, so these assumptions may not be precise for every individual application in a given sector.
The impact of Fuel Duty and VAT on the cost parity results is shown in Figure 2.15 to highlight the significant effect of existing taxing regime within each sector. For example, fuel duty and VAT significantly influences the final cost of petrol used in cars or diesel in buses, compared to MGO used in ferries, which is exempted from fuel duty and VAT. It should be noted that fuel duty and VAT were based on 2020 rates even for the 2032 cost parity estimates.
| Sector | Fossil Fuel Replaced | Taxes | Reference | |
|---|---|---|---|---|
| Fuel Duty (£/litre) | VAT | |||
| Cars | Petrol | 0.5795 | 20% | (HMRC, 2014) |
| Buses | Diesel | 0.5795 | 20% | (HMRC, 2014) |
| Trains | Diesel | 0.1114 | 20% | (fta, 2018) |
| Chemical Feedstock[14] | Grey hydrogen | 0 | 0 | |
| Ferries | Marine Gas Oil | 0 | 0% | (HMRC, 2019) |
| Aviation | Kerosene | 0 | 20% | (HMRC, 2014) |
| Heat | Natural gas | 0 | 5% | (HMRC, 2016) |
| Electricity | Natural gas | 0 | 5% | (HMRC, 2016) |
2.4.3 Summary
The cost parity modelling was focused on current costs and those projected for 2032. The final results are shown in Table 2.3. The table shows Scotland’s hydrogen cost parity for each sector in 2032 and the prices that consumers would be likely to pay for the fossil fuel equivalent per sector. The table also highlights what type of fossil fuel would be replaced by green hydrogen, and examples of alternative zero-carbon technologies that are likely to become competitors with green hydrogen in 2032. It should be noted that these are only examples and other alternative technologies can be found in reports that are focused on the demand side.
It should be also caveated that the cost parity calculations in this section is focussed on the supply costs and do not account for costs associated with the end use application, including delivery of green hydrogen from the onshore landfall to point of use. The costs also do not consider any capital costs associated with the adoption of hydrogen (e.g. capital cost of new hydrogen cars). To enable a wide uptake of hydrogen end-use technologies across Scotland, the capital cost for the initial investment in hydrogen technology is likely to require incentives. Such example can be seen in the light-duty vehicle sector, where the capital cost required to buy a hydrogen car is significantly higher compared to an equivalent petrol vehicle.
| Sector | 2032 Hydrogen Cost Parity (£) | Fossil Fuel Replaced | Alternative Technology Competitor Example | |
|---|---|---|---|---|
| Including fuel duty and VAT | Excluding fuel duty and VAT | |||
| Average Petrol Cars | 7.8 | 2.6 | Petrol | Battery electric vehicles |
| Hybrid Electric Cars | 6.2 | 2.1 | Petrol | |
| Buses | 5.5 | 2.0 | Diesel | Battery electric buses |
| Trains | 3.4 | 2.1 | Diesel | Railway electrification |
| Chemical Feedstock | 2.6 | 2.6 | Grey hydrogen | None |
| Heat | 2.3 | 2.2 | Marine Gas Oil | Battery electric ferries |
| Ferries | 1.9 | 1.9 | Kerosene | Battery / synthetic fuels |
| Aviation | 1.6 | 1.3 | Natural gas | Heat pumps / biomass / biomethane |
| Electricity | 0.7 | 0.7 | Natural gas | Battery / other grid balancing technologies |
Table 2.3 indicates that land-based transport is where cost of fuel in demand sectors may be most competitively challenged by hydrogen in 2032, particularly when Fuel Duty and VAT are included. When taxes are excluded, cost parity across the sectors is more evenly distributed, ranging from 1.9 to 2.6 (apart from aviation and electricity sectors which are only indicative and will require further analysis as highlighted in Section 4.3).
It should be highlighted that this chapter does not include transportation logistics cost of getting the green hydrogen to the customer from the onshore landing point. To demonstrate this on an example; the associated costs of delivering green hydrogen to refuelling stations via pressurised containers is likely to be significantly higher than direct injection of hydrogen into the national gas grid network to decarbonise the heat sector. Due to the high logistics cost for getting hydrogen to the refuelling stations, and very low logistics cost of the existing pipeline network, the actually cost-competitiveness gap between various sectors is assessed in Section 4.3 to evaluate which sectors are likely to become the most cost competitive with fossil fuels in 2032, and which may require additional support in terms of subsidies.
The analysis revealed that the most difficult sectors for green hydrogen penetration are the ones with the lowest Fuel Duty and VAT under current tax regime. This particularly applies to natural gas, which not only attracts lower taxes but also offers lower emissions abatement potential compared to other fossil fuels as discussed in Section 4.3. This makes the replacement with green hydrogen not only challenging from a direct cost to consumer point of view but also from the environmental perspective. The final 2032 cost parity results assessed in this section are shown in Figure 2.15.
Contact
Email: onshoreoilandgas@gov.scot