
Atlantic salmon and sea trout - migration routes and behaviour: acoustic tracking study
An acoustic tracking study into the movements of Atlantic Salmon (Salmo salar) and Sea Trout (Salmo trutta) on migration through operational offshore wind farms in the Moray Firth, Scotland.
2. Methods
Study area and telemetry array
The Moray Firth, North East Scotland, contains several OWD sites at various stages of planning including consented, in construction, and operational. Beatrice and Moray East OWDs located 13 and 22 km offshore, respectively, within the Moray Firth were the focus of the current study. Beatrice, completed in 2019, has a generation capacity of 588 MW from 84 fixed turbines while Moray East, completed in 2022, has a generation capacity of 950 MW from 100 fixed turbines. The turbines of both wind farms are located in water of 35–60 m depth.
Acoustic telemetry (69 kHz) was used to track: 1) the outmigration of Atlantic salmon smolts from the River Wick into the Moray Firth and through the Beatrice and Moray East wind farms, and 2) the movements of adult sea trout translocated from the River Wester into the vicinity of the Beatrice and Moray East wind farms. The study utilised an acoustic receiver array (Innovasea, model VR2AR) deployed as part of the collaborative ‘Predators and Prey Around Renewable Energy Development’ (PrePARED) project, along with additional study-specific receivers (Innovasea, models VR2AR, VR2W and VR2Tx) deployed in the Rivers Wick and Wester, and in the Moray Firth (Figure 1). The PrePARED receivers (n = 84) were deployed close to turbine base structures within the Beatrice and Moray East wind farms, with a nearest neighbour spacing of approximately 1150 m, and maintained for the duration of the current study (14th April 2023 – 30th March 2025). Additionally, 60 study-specific receivers were deployed in two lines (30 receivers on the North Line and 30 receivers on the South Line) extending out from the Beatrice OWD with a spacing of 500 m between adjacent receivers for (Figure 1). The lines were in situ from 9th March 2023 to 10th July 2023 (Y1) and from 29th February 2024 to 15th September 2024 (Y2). This configuration was designed to determine if salmon post-smolts travelled east after leaving Wick Bay or south-east towards the wind farms, with passage through the latter confirmed by the extensive receiver array there. Due to high fishing pressure directly north of Wick Bay, it was not feasible to deploy receivers in this region to detect the northward movements of smolts. During the period from 27th February to 2024 to 18th September 2024 (Y2), 14 receivers were deployed 11 km north of Beatrice OWD to provide the “Control Area” in which to release and track translocated adult sea trout. The hexagonal grid configuration and spacing of these receivers were identical to the hexagons within the North and South areas of the Beatrice OWD, thus enabling direct comparison of detection patterns within these 3 areas (Figure 1).
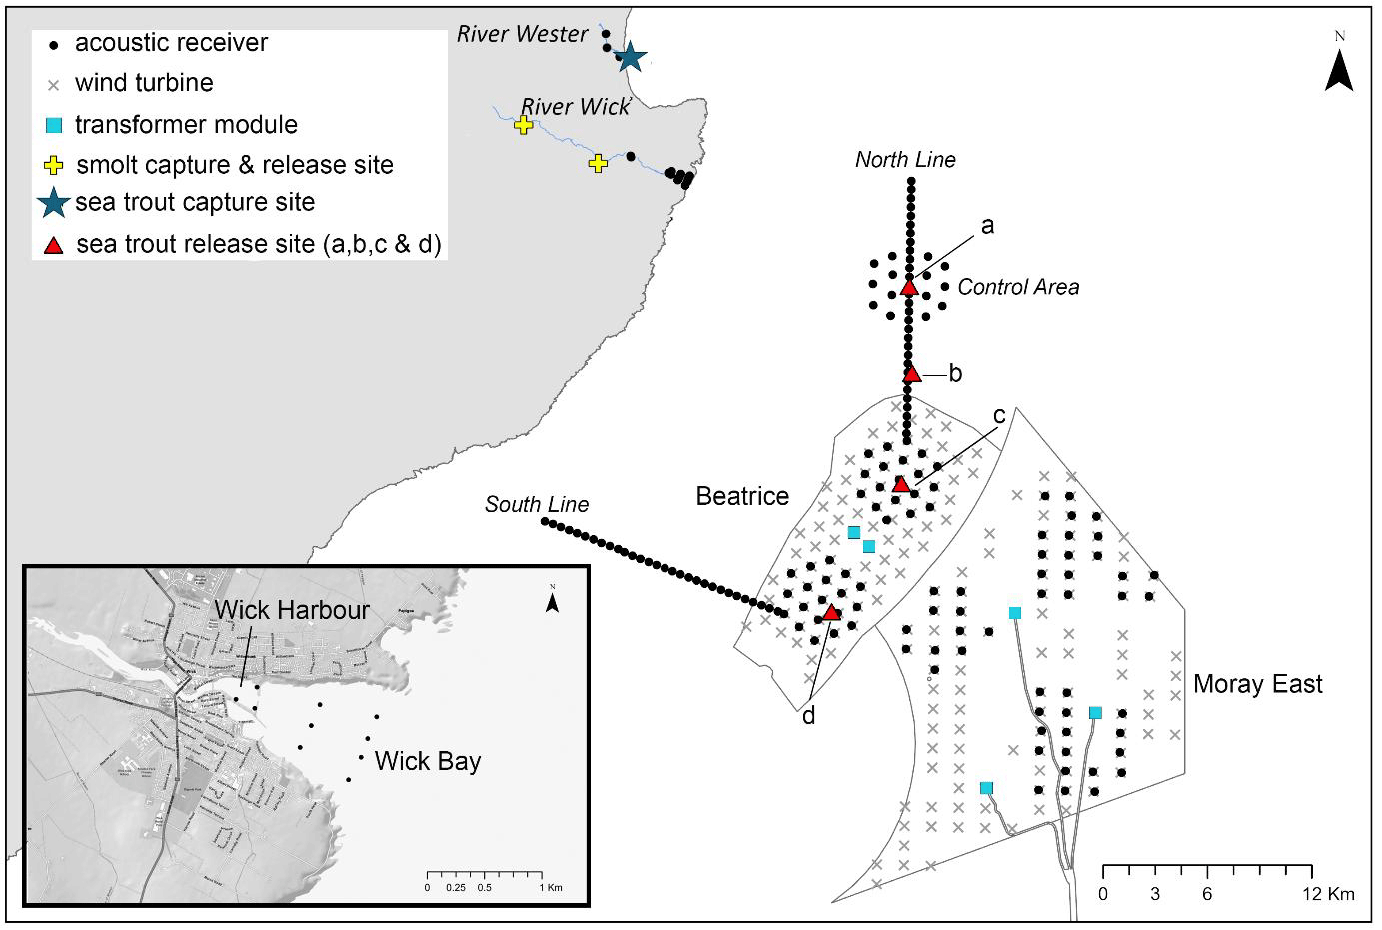
All marine moorings comprised a 70 kg weight attached to an acoustic release canister system via a 2 m rope strop. This configuration enables remote retrieval of all items from the seabed using a surface vessel. Receivers in freshwater were deployed on the riverbed, attached to a weighted stand. Data download and battery replacement were conducted annually.
Fish capture and tagging
Atlantic salmon smolts
Salmon smolts were captured during the period from 13th to 22nd April 2023 (Y1) and from 11th April to 2nd May 2024 (Y2) using an upstream-facing box funnel trap deployed at Bilbster (58.464363°, -3.230271°) located 11.1 km upstream of Wick Harbour on the River Wick (Y1 & Y2), and at Haster (58.445416°, -3.154892°) on Haster Burn, a tributary of the River Wick, 6.4 km upstream of Wick Harbour (Y2).
Captured fish were visually assessed and selected for tagging (n= 108 in Y1; n = 100 in Y2) if they were clearly smolting, of sufficient size (≥120 mm fork length) and exhibited no notable external indicators of damage or disease. Selected individuals were anaesthetised (0.1 g/L MS222 1:1 buffered with NaHCO3), measured (fork length, mm) and placed on a V-shaped sponge saturated with river water. An incision (approximately 10 mm length) was made in the ventral abdominal wall, anterior to the pelvic girdle, and a uniquely coded acoustic transmitter (Innovasea) with a transmission rate of 15–45 s inserted into the peritoneal cavity (Table 1). The TP transmitter model incorporated tag depth and temperature sensors from which data were transmitted on alternate transmissions (nominally each minute). The incision was closed using two interrupted surgeon knots with 4/0 Ethilon nylon sutures. The gills were continuously irrigated with river water throughout tag implantation. The fish was subsequently transferred to an aerated tank, then after full recovery placed into a perforated in-river containment box (0.7 m length x 0.45 m width x 0.60 m depth) that had throughflow of freshwater, close to the point of capture and held until release, which occurred after sunset (minimum 8 h, maximum 11 h).
| Study Year | No. fish | Tag model | Tag diameter x length (mass in air) | Expected tag life (days) | Fork length (mm)min−max (mean ± SD) |
|---|---|---|---|---|---|
| Y1 | 68 | V6-2x | 6.3 x 13 mm 0.5 g | 52 | 120−149 (134 ± 6) |
| Y1 | 40 | V7-2x | 7 x 19.5 1.5 g | 69 | 134−164 (143 ± 6) |
| Y2 | 70 | V6-2x | 6.3 x 13 mm 0.5 g | 52 | 120−140 (132 ± 5) |
| Y2 | 30 | V7TP-2x | 7 x 21 mm 1.7 g | 57 | 131−156 (144 ± 5) |
Total Number of Fish: 208
Adult sea trout
Adult sea trout were captured on 12th and 13th July 2023 (Y1) and 30th June and 18th July 2024 (Y2) by seine netting in the sea pools of the lower River Wester (58.500314°, -3.135941°) (Figure 1). Captured individuals which exhibited one or more visual indicators of a migratory lifestyle (i.e. silver body colouration and altered spot colour and configuration) (Pratten & Shearer, 1983), were of sufficient size (≥190 mm fork length) and apparently healthy were retained for tagging. One of three models of acoustic transmitter was implanted, dependent on fish size, using the methods described above but with a larger incision for the V9 models (approximately 14 mm) (Table 2). The tag transmission rate of all IDs was 15–45 s. Tag depth and temperature data were transmitted from the V9TP-2x tags on alternate transmissions (nominally each minute).
| Study Year | No. fish | Tag model | Tag diameter x length (mass in air) | Expected tag life (days) | Fork length (mm) min−max (mean ± SD) | Release location - Control Area (a) | Release location - South of Control Area (b) | Release location - Beatrice North (c) | Release location - Beatrice South (d) |
|---|---|---|---|---|---|---|---|---|---|
| Y1 | 17 | V9TP-2x | 9 x 31 mm 4.9 g | 231 | 255−509 (322 ± 72) | - | - | 7 | 10 |
| Y2 | 11 | V7-2x | 7 x 19.5 mm 1.5 g | 196 | 195−220, (204 ± 9) | 0 | 3 | 4 | 4 |
| Y2 | 6 | V9-2x | 9 x 27.5 mm 4.5 g | 232 | 200−219, (210 ± 8) | 2 | 0 | 2 | 2 |
| Y2 | 35 | V9TP-2x | 9 x 31 mm 4.9 g | 231 | 225−440, (279 ± 53) | 7 | 5 | 12 | 11 |
| Total | 69 | N/A | N/A | N/A | N/A | 9 | 8 | 25 | 27 |
After recovery, fish were held within a rigid mesh in-river cage (1.5 m length x 0.7 m width x 1 m depth) that had throughflow of freshwater close to the capture location. Prior to release, fish were transported by road in an aerated tank (600 L) of river water to Wick Harbour and transferred in water-filled containers to a larger aerated tank (800 L) on the deck of a vessel. This tank was filled with a mixture of seawater and freshwater to achieve comparable salinity as that at the capture site. Fish were transported offshore and released at one of four sites: Beatrice North (Y1 & Y2); Beatrice South (Y1 & Y2); the “Control Area” (Y2) or “South of the Control Area” (Y2) (Figure 1) (Table 2). The latter was not a planned release site but was used due to deteriorating weather conditions on the release day. On arrival at each release site, ambient seawater was slowly pumped into the holding tank at a rate which replaced the entire volume over a period of 15 minutes to facilitate fish acclimation. The tank was subsequently slowly lowered by crane into the sea to sink approximately 1 m below the surface, whereupon the fish left volitionally.
Detection range
Tags had a power output of 137 - 146db dB re 1 µPa @ 1m which results in a typical optimal deep open water transmission range of 300–500 m. Numerous physical and environmental factors may reduce or increase detection range and efficiency including water depth, bed substrate type, the presence of suspended particles, and localised varied effects of factors such as wind (Brownscombe et al., 2019). Based on the typical optimal scenario, all tagged fish should have been detected while passing through Wick Bay and the North and South lines, but could potentially have passed through the OWD and control area grids without detection.
Environmental data
Data on tidal current direction and speed along with bathymetry were generated for the study area in the Moray Firth using the Scottish Shelf Model developed by the Scottish Government Marine Directorate (Barton et al., 2022). Depth-averaged 2D data were extracted at 30 minute time intervals over the entire study period at 662 nodes within a polygon of approximately 30 km x 40 km.
Data analysis
Atlantic salmon smolts
Time-stamped detection data were filtered to remove spurious records linked to false IDs, and the remaining 123,481 detections relating to salmon were analysed to generate metrics on the following: 1) the timing and duration of salmon post-smolt river emigration; 2) the residency of salmon post-smolts within Wick Bay; 3) the direction of movement of salmon post-smolts after leaving Wick Bay, and 4) the duration and distance travelled by salmon post-smolts within the OWDs.
The last detection of a salmon post-smolt on the outer receiver line in Wick Bay was used to denote the time of successful emigration of into the Moray Firth.
To explore the potential influence of tidal currents on the movement direction of fish leaving Wick Bay, the last detection times of post-smolts on the outer line of receivers in Wick Bay were rounded to the nearest 30 minutes and joined to tidal current data. Multinomial logistic regression was used to test the effect of current speed (m s-1), current bearing and year on the first detection location after leaving Wick Bay (North Line, South Line, “Control Area”, turbine array, or not detected). Model fitting and simplification was performed in R (R Core Team, 2024) using package “nnet” (Venables & Ripley, 2002). Z-scores were used to calculate p-values for coefficients.
The time difference between the first and last detections in the marine array was used to infer the duration that post-smolts spent within the marine array. Durations were compared across years using a Wilcoxon rank sum test.
Detections on the 84 PrePARED receivers along with 3 additional receivers from the North Line and 2 receivers on the South Line which were within 500 m of a turbine were used to indicate when fish were within the OWDs. For salmon post-smolts, time spent in the OWDs was quantified using residence events. Each residence event was defined as a period of detection at the same receiver, during which consecutive detections were separated by time intervals of less than 390 seconds. The detection of the fish at a different receiver marked the start of a new residence event, irrespective of the detection interval. The temporal cut-off was informed by interval analysis which identified that 95% of detection intervals were at the cut off value or lower.
The movement patterns of individual fish within the OWDs were determined from consecutive residence events. The swim bearing (°) and minimum track distance (m) were calculated for each swim path ‘step’. In cases where consecutive residence events were separated by 24 h or more (i.e. one day passed without detection), the fish could not reasonably be presumed to have remained in the OWDs. Therefore, track metrics were only calculated within discrete periods where consecutive residence events were temporally separated by less than 24 h. These periods ranged in duration from <1 s to 22.04 h (median 2.54 h) in Y1 and from <1 s to 50.62 h (median 10.53 minutes) in Y2.
Adult sea trout
Detections of sea trout on all receivers in the North and South lines, except those receivers in the North Line that formed part of the “Control Area” hexagon comprising 19 receivers (Y2 only, see above) were excluded from the dataset (9564 from a total of 103706 detections). To exclude atypical movements associated with post-release dispersal behaviours, detections within 30 minutes of release were omitted, leaving 93,780 detections for analysis.
All detection records, along with the depth and temperature profiles from those fish equipped with sensors, were examined for evidence of mortality or predation. Specifically, relevant records were removed from the database if: 1) a continuous detection pattern was observed at the same receiver for >24 h without subsequent movement (i.e. stationary tag, presumed dead); 2) temperature exceeded 30°C, indicating mammalian predation; or 3) depth use was far outside the expected behavioural limits of sea trout (e.g. continuous detections on the sea floor for >24 h), suggesting predation or the scavenging of a dead sea trout by an ectothermic demersal fish. A total of 1308 records from 1 individual in Y2 were omitted.
Durations within the OWDs and control area were quantified using residence events (as above), using 790 seconds as a temporal cut off derived by interval analysis of all marine detections whereby 95% of detection intervals were 790 seconds or less.
A Roaming Index was calculated to quantify exploratory behaviour in the three receiver hexagons (test areas) comprising Beatrice North, Beatrice South and the Control Area. The number of unique receivers visited by each fish in each area per day was divided by the daily total duration of residence in that area (h), yielding a Roaming Index value for each fish per area per day. Generalised Linear Mixed Models (GLMMs) were used to investigate the effect of potential descriptors (‘test area’ and ‘year’) on the response variables 1) Roaming Index, and 2) Total residency in a test area per fish per day. Negative binomial error distributions were used for both response variables, with Fish ID included as a random effect. Stepwise deletions were performed using chi-square tests to identify non-significant terms and to reach the model with lowest Akaike Information Criterion value (Akaike, 1973).
To account for varying seafloor depths across the study area, pressure sensor data along with bathymetric data from the model node (see above) nearest to the detecting receiver were used to calculate swimming depths as a percentage of total water depth.
Detection areas
For clarity, the term ‘marine detection area’ is used throughout to denote all receivers deployed offshore, while ‘within OWDs’ refers only to those receivers within the boundaries of the wind farms Beatrice and Moray East.
Contact
Email: ScotMER@gov.scot