Migration routes and behaviour of Atlantic salmon and sea trout around operational wind turbine arrays in the Moray Firth, Scotland

An acoustic tracking study into the movements of Atlantic Salmon (Salmo salar) and Sea Trout (Salmo trutta) on migration through operational offshore wind farms in the Moray Firth, Scotland.


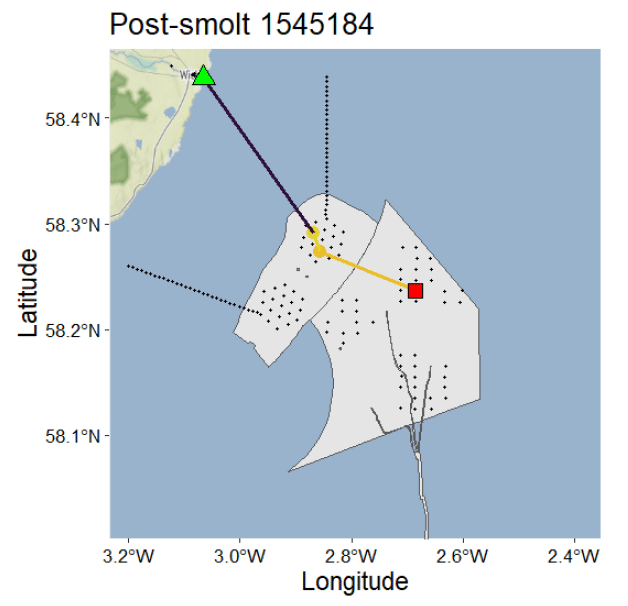
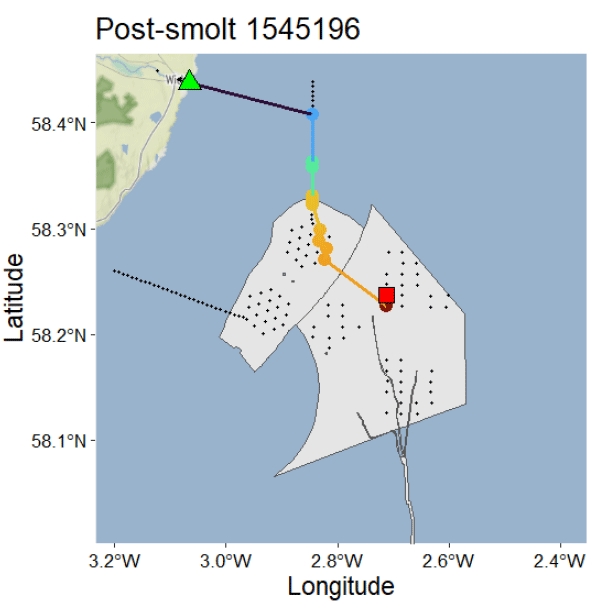
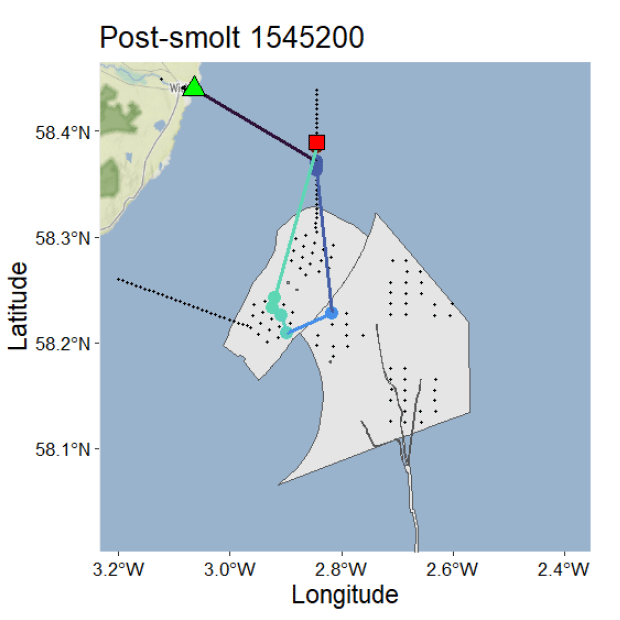
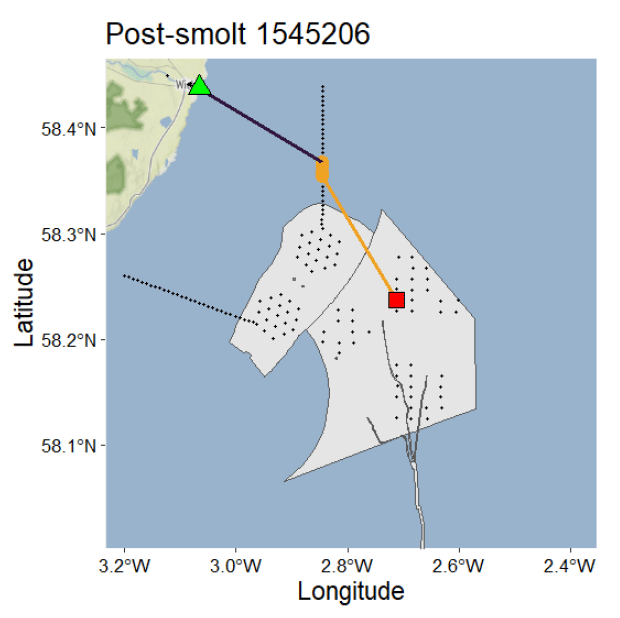
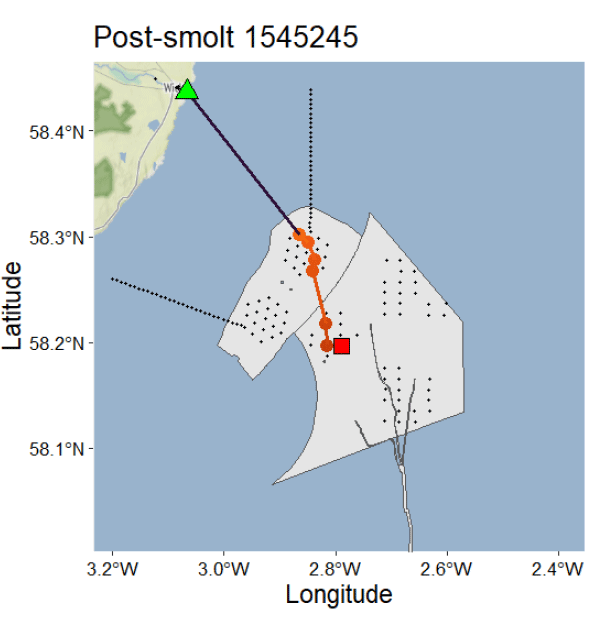
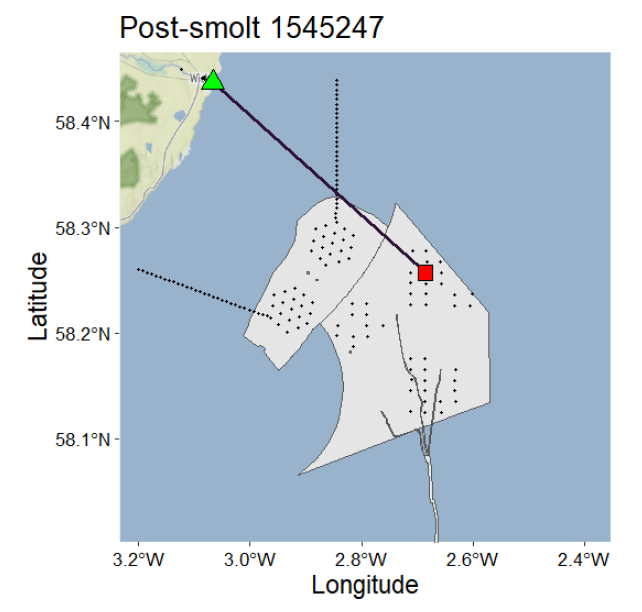
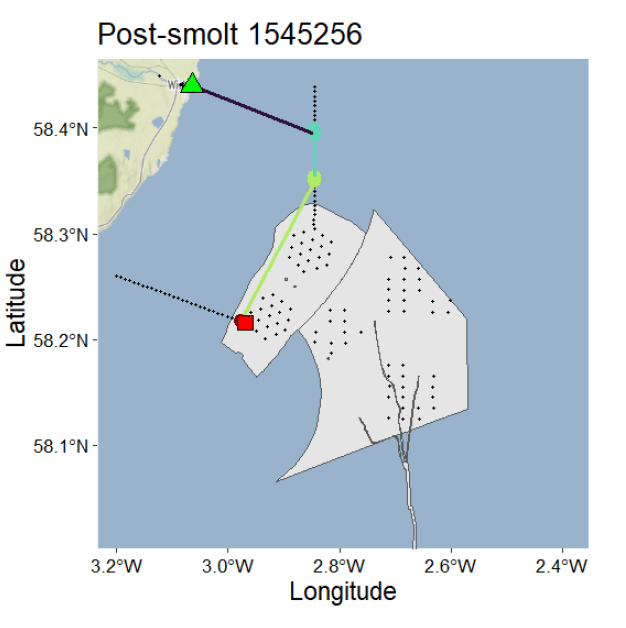
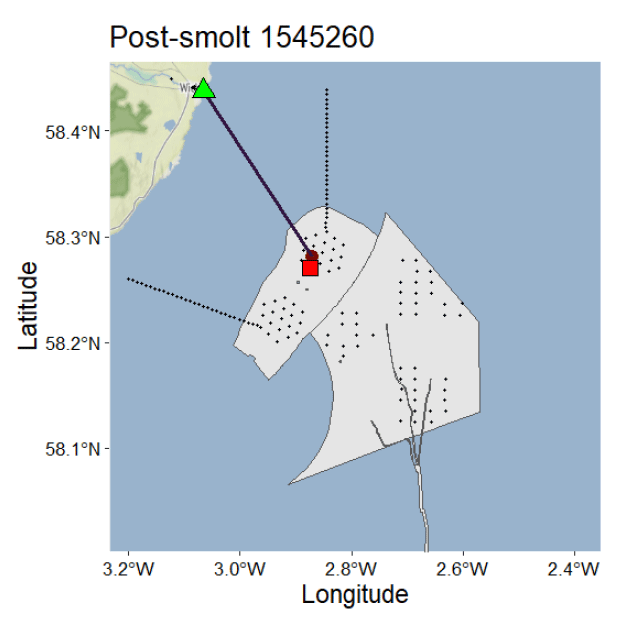
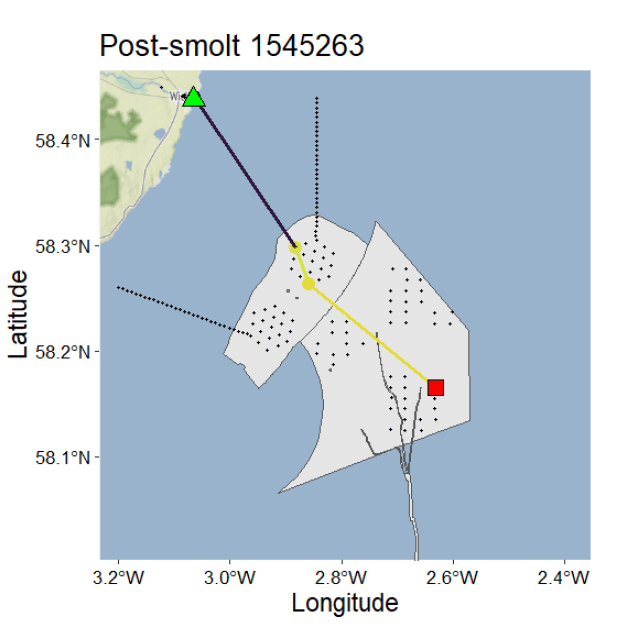
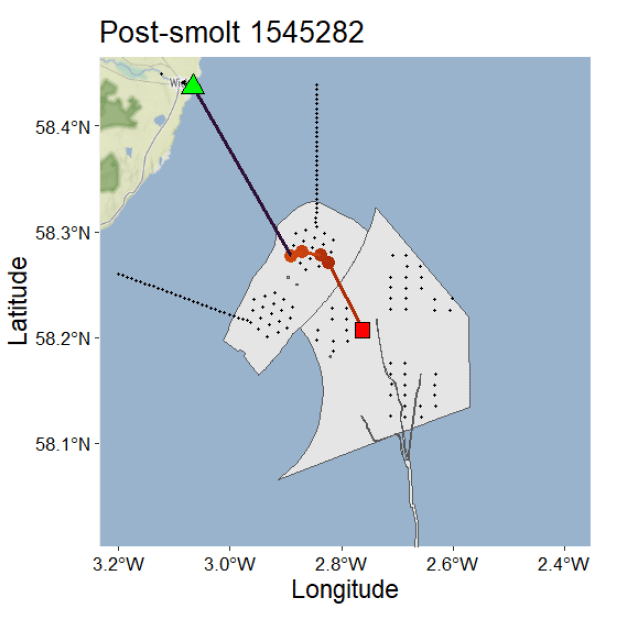
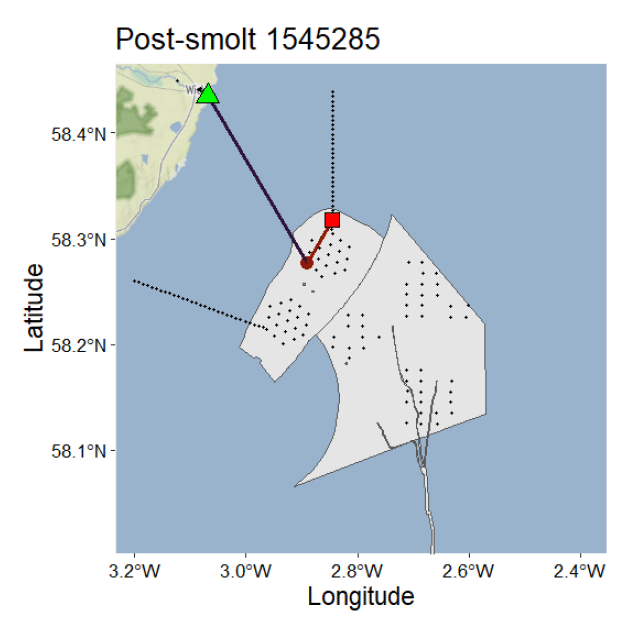
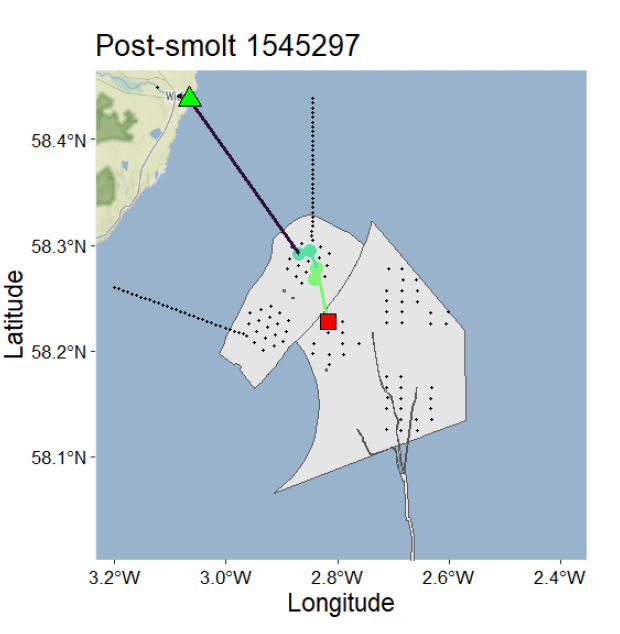
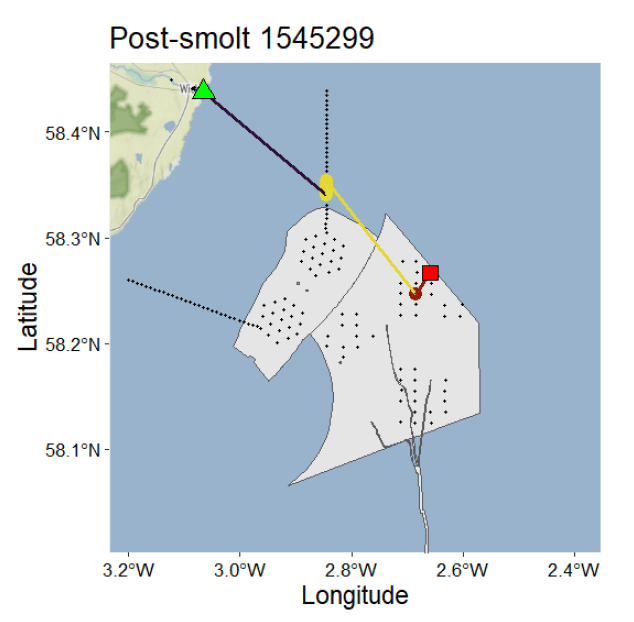
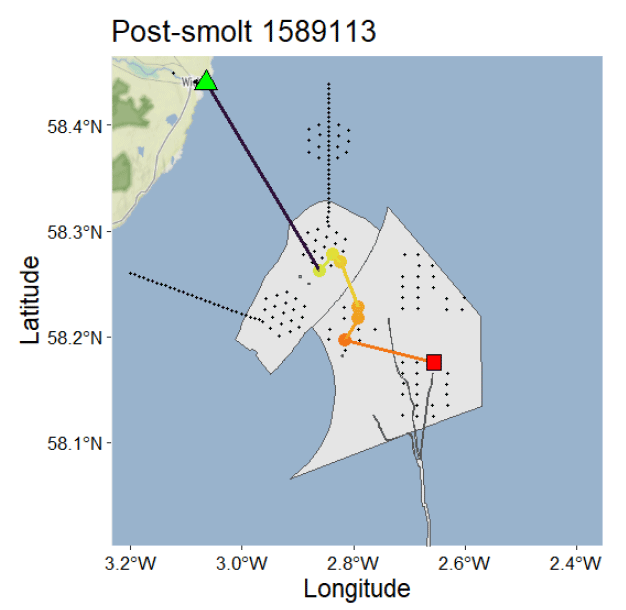
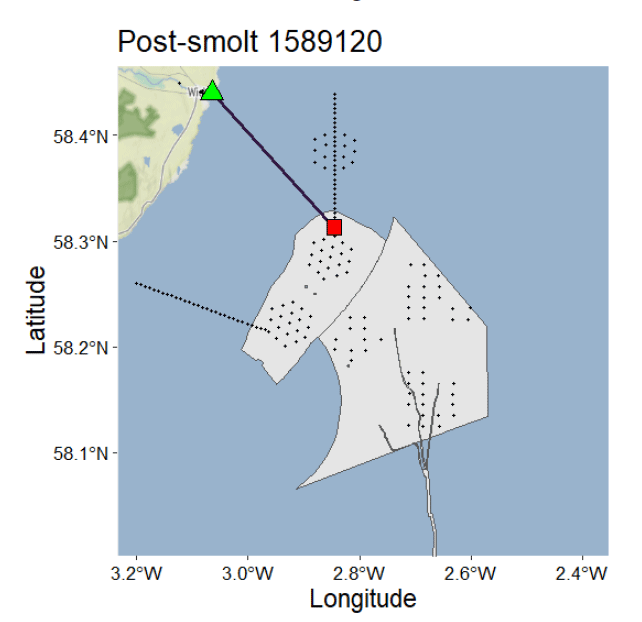
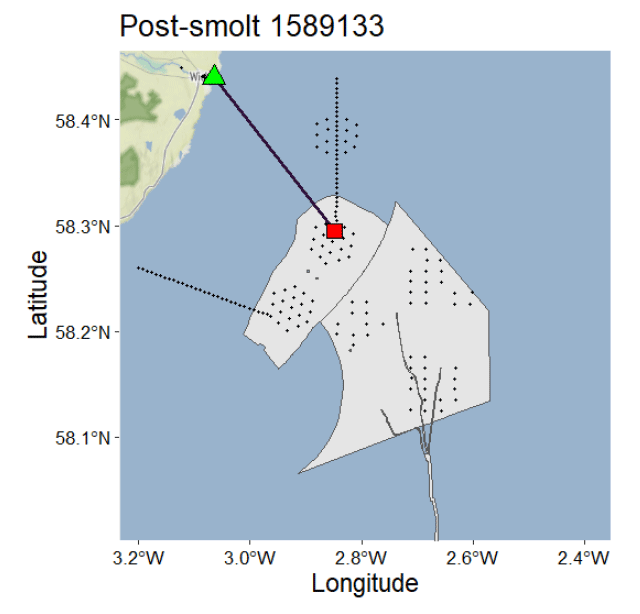
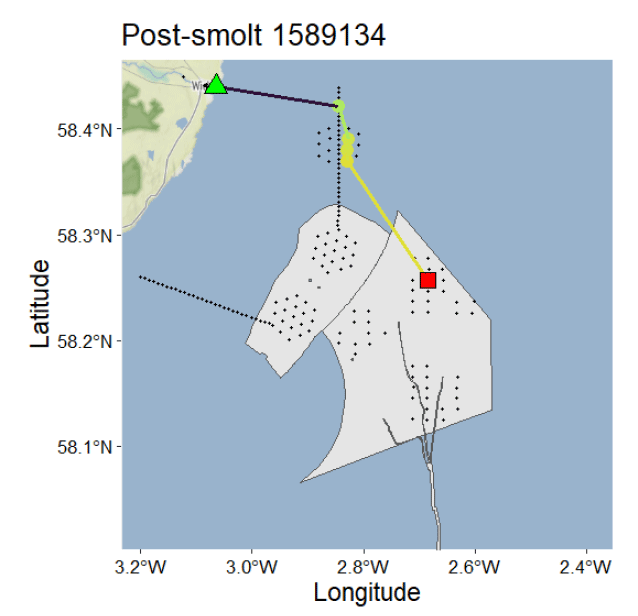
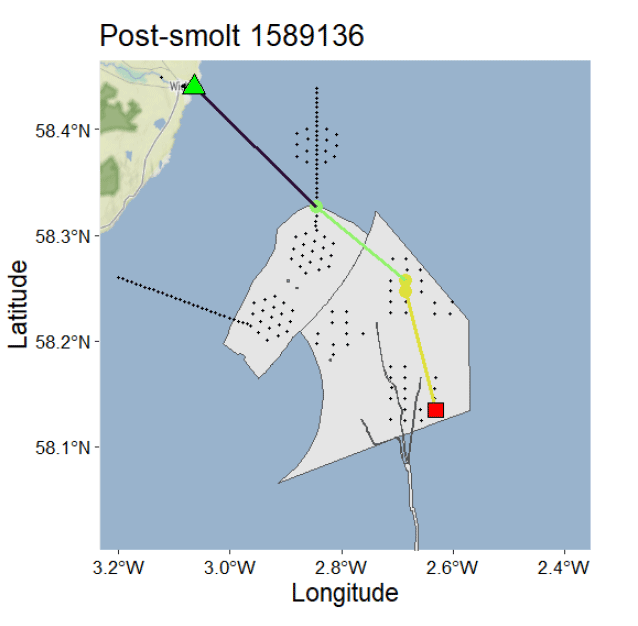
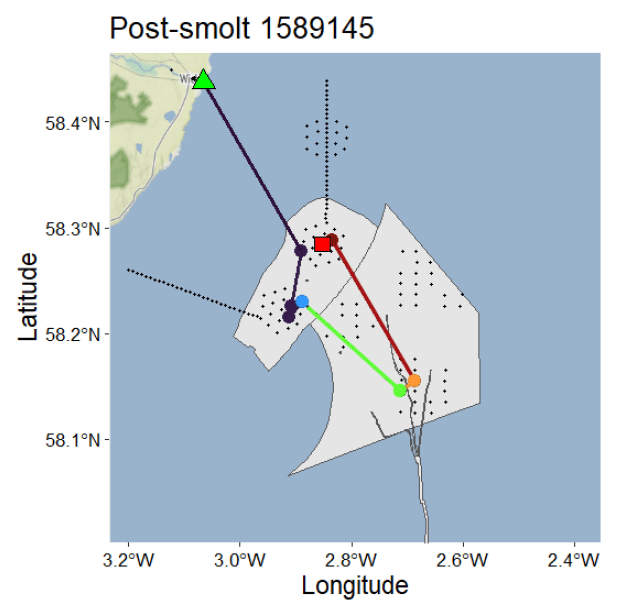
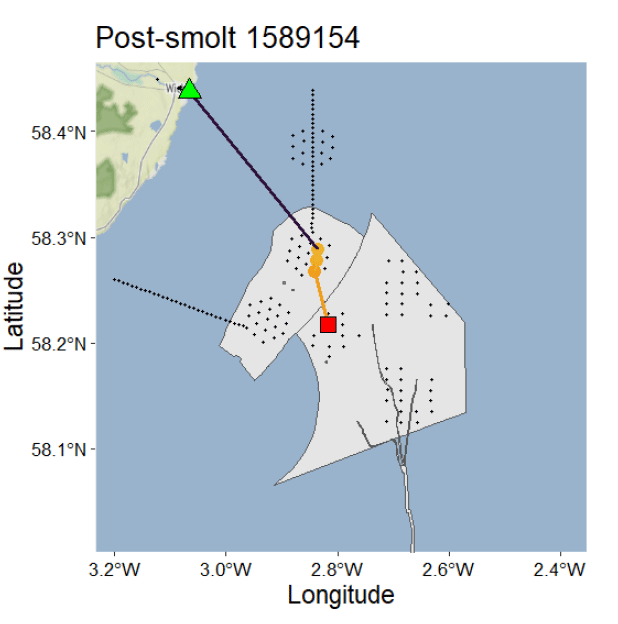
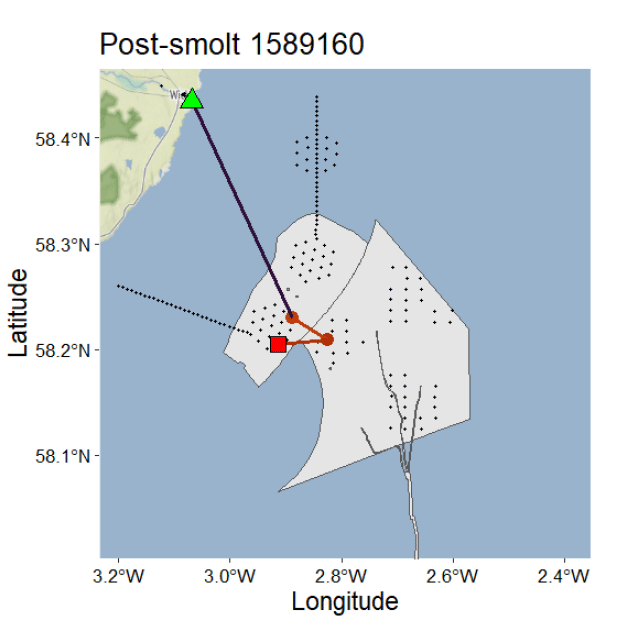
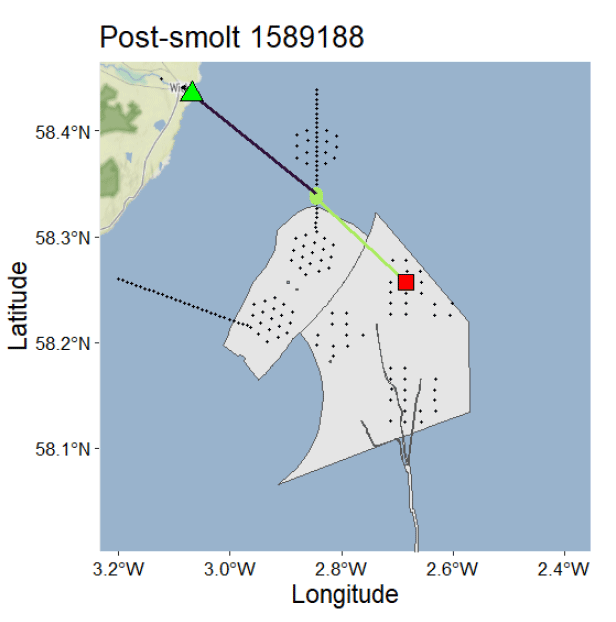
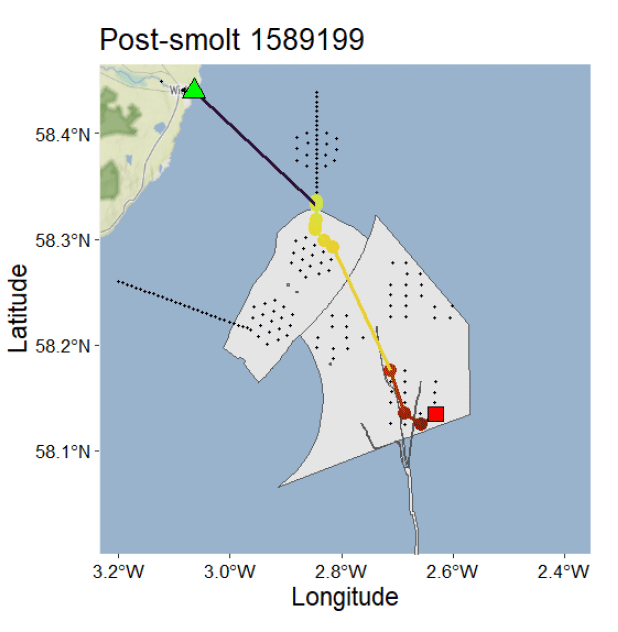
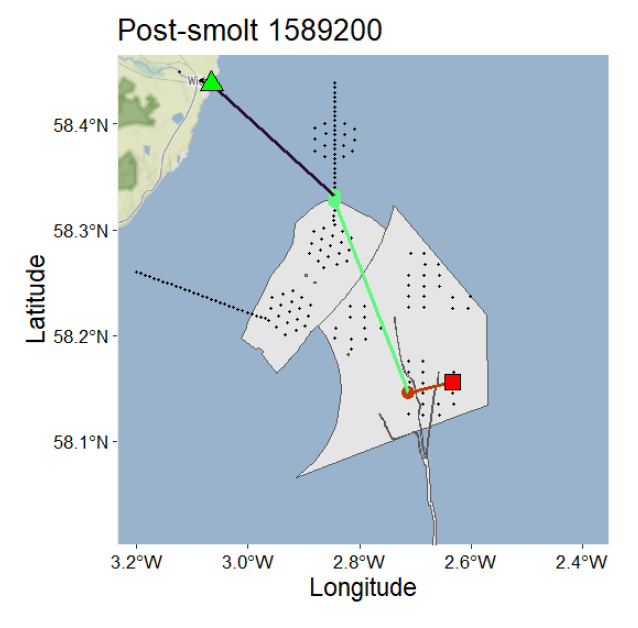
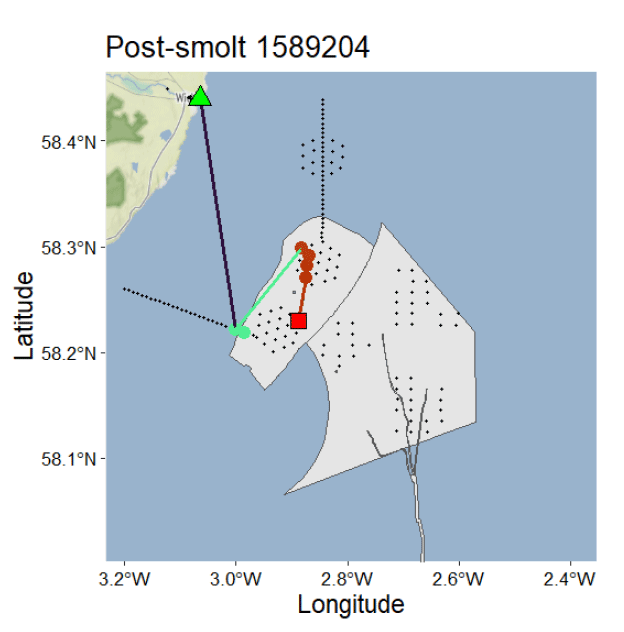
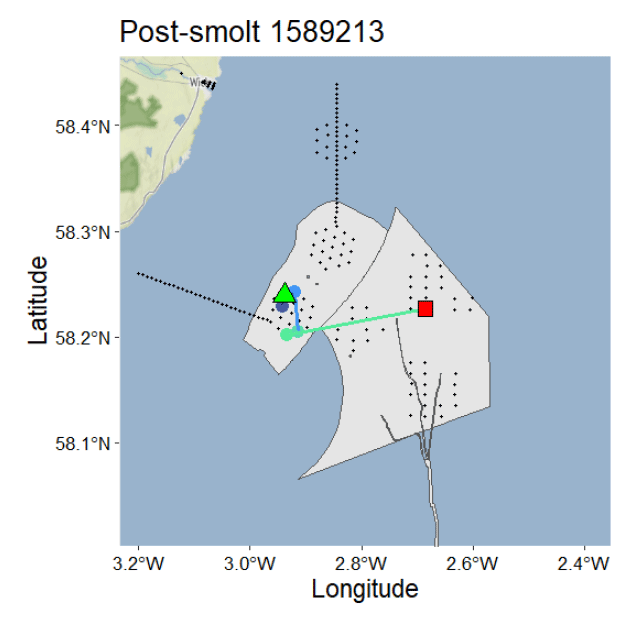
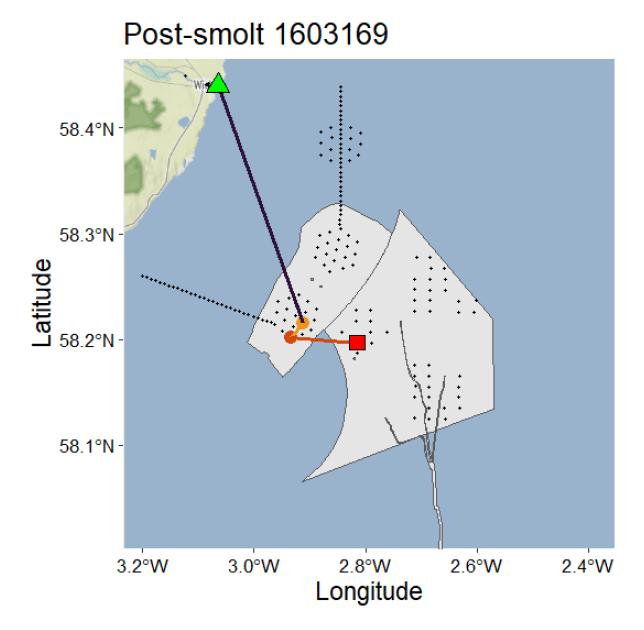
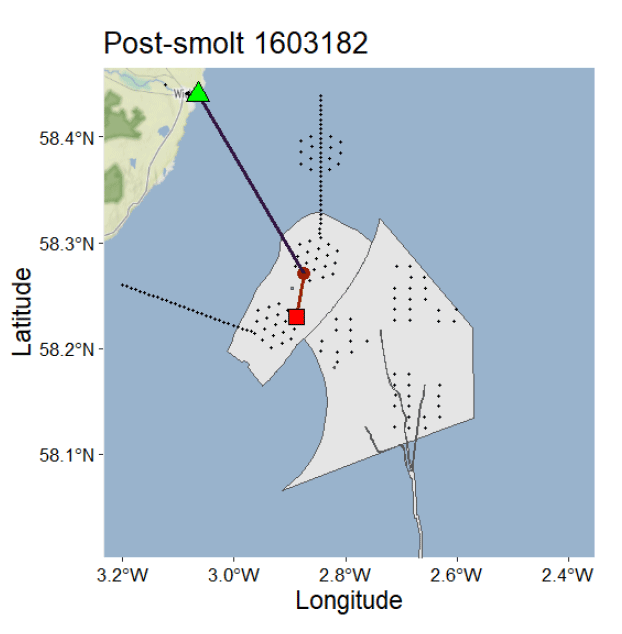
Appendix 1: Individual reconstructed swim path trajectories (assumed straight lines between consecutive detection locations) of post-smolts that interacted with the Beatrice and Moray East offshore wind developments

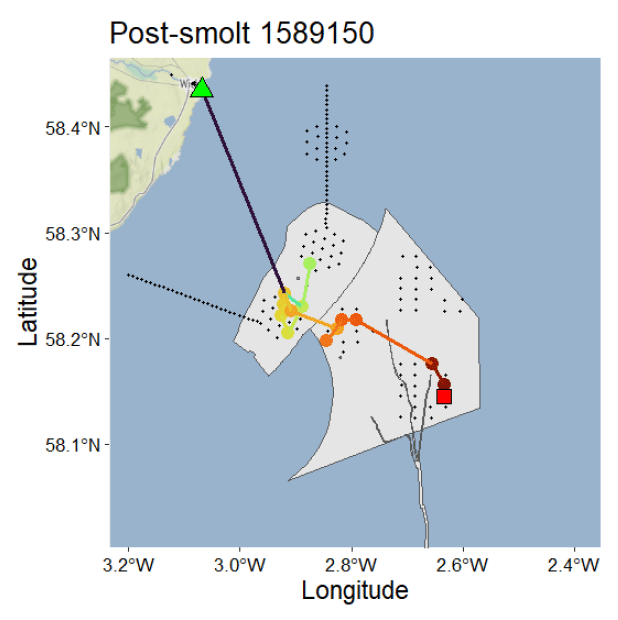
The green triangle and red square depict the start and end, respectively, of the marine swim path. Coloured lines depict swim path steps between the coloured circles which depict locations of detection. Colours reflect passing time, along the following colour gradient:

A scale bar showing a dark blue to a red spectrum illustrating passage of time.

Year 1 (n = 17)

Map showing post-smolt 1545184 tracking data with latitude and longitude coordinates. Key elements include a green triangle, red square, and yellow circle connected by lines, indicating movement paths within a shaded area representing a specific marine region.
Map showing post-smolt fish movement tracked by latitude and longitude, with coloured markers and lines indicating different locations and paths. Key features include a green triangle, red square, and a series of connected dots in blue, cyan, yellow, and orange, highlighting migration routes within a coastal area.
Map showing post-smolt movement tracked by latitude and longitude, with a green triangle marking the starting point and a red square indicating the endpoint. Blue and purple lines trace different routes taken across a coastal area shaded in grey with dotted regions, highlighting variations in travel paths.
Map showing post-smolt tracking with latitude and longitude coordinates marked on axes, highlighting movement from a green triangle at 58.4°N, 3.2°W to a red square near 58.2°N, 2.6°W. Key elements include a grey shaded area with dotted patterns, black dashed lines indicating paths, and coloured lines connecting markers to illustrate migration route.
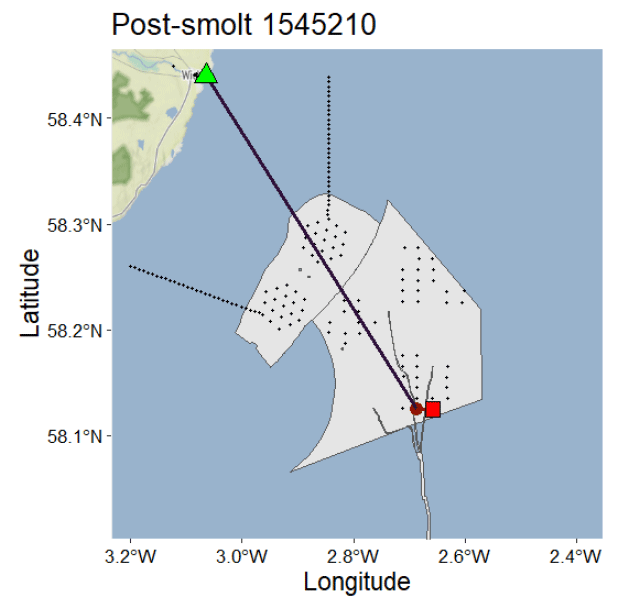
Map showing post-smolt 1545210 tracking data with latitude and longitude coordinates. Key elements include a green triangle and red square connected by a purple line, overlaid on a grey shaded area with dotted patterns indicating specific zones.
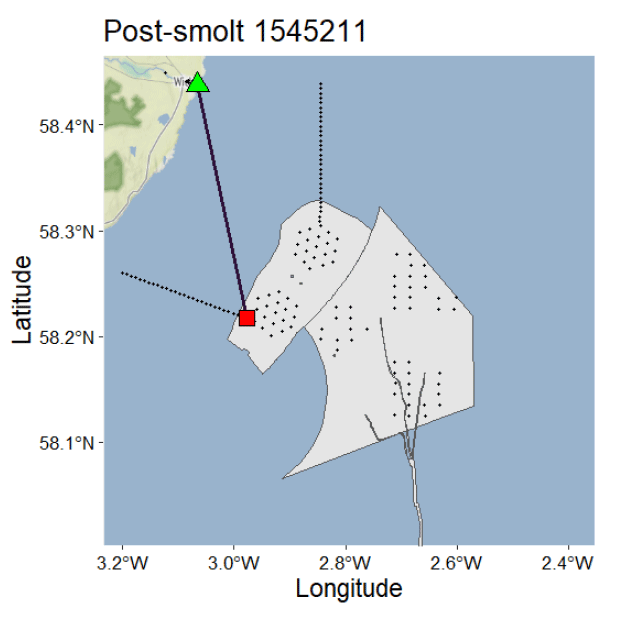
Map showing post-smolt tracking data with latitude and longitude coordinates, highlighting a movement path from a red square near 58.2°N, 3.0°W to a green triangle near 58.4°N, 3.0°W. Grey shaded areas with dotted patterns represent specific zones, and a dark blue line indicates the tracked route.
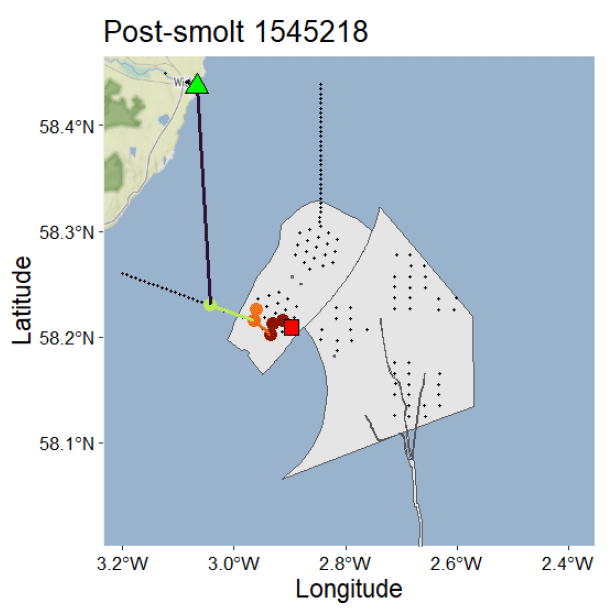
Map showing post-smolt tracking data with latitude and longitude coordinates marked on axes. Key elements include a green triangle, red square, orange and yellow dots connected by lines, and a grey shaded area with black dashed boundaries, indicating movement patterns and specific locations.
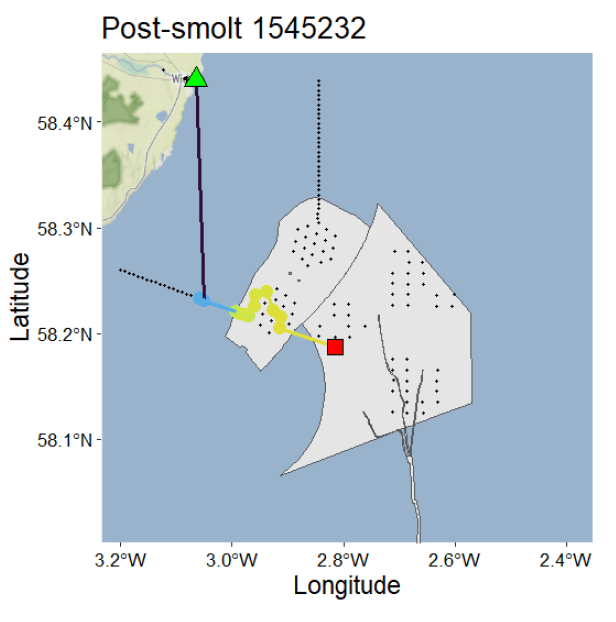
Map showing post-smolt tracking with latitude and longitude coordinates, highlighting movement from a green triangle marker at approximately 58.4°N, 3.0°W to a red square marker near 58.2°N, 2.8°W. Map includes shaded areas in grey and yellow, dotted patterns, and lines indicating specific regions or pathways relevant to post-smolt migration study.
Map showing post-smolt tracking data with latitude and longitude coordinates marked on axes. It features a green triangle, red square, and orange dots connected by lines over a grey shaded area with dotted patterns, indicating movement path and key locations.
Map showing post-smolt 1545247 tracking data with latitude and longitude coordinates. Key features include a green triangle marking the starting point, a red square indicating a significant location, and a purple line representing the movement path across a coastal area.
Map displaying post-smolt tracking data with latitude and longitude coordinates marked on vertical and horizontal axes. Key elements include a green triangle, red square, and green circle connected by lines, overlaid on a shaded area with dotted patterns indicating specific zones or regions.
Map showing post-smolt 1545260 tracking data with latitude and longitude coordinates. Key elements include a green triangle, red square, dotted area, and a dark line connecting the triangle and square, indicating movement or migration path.
Map showing post-smolt migration path of a fish tagged 1545263, with latitude and longitude coordinates marked along axes. Key elements include a green triangle indicating starting point, a red square marking endpoint, and a yellow line tracking movement through a shaded, dotted area representing a specific marine region.
Map showing post-smolt 1545282 tracking data with latitude and longitude coordinates. Features include a green triangle and red square markers connected by a dark line, overlaid on a shaded area with dotted patterns indicating specific zones.
Map showing post-smolt tracking data with latitude and longitude coordinates, highlighting movement from a green triangle near the coast to a red square offshore. Grey shaded areas with dotted patterns represent specific zones, and a dark line traces the path between key markers.
Map showing post-smolt 1545297 tracking data with latitude and longitude coordinates, highlighting movement from a green triangle near land to a red square offshore. Grey shaded area with dotted lines represents specific zones or regions relevant to tracking, with a purple line indicating the path taken.
Map showing post-smolt 1545299 tracking data with latitude and longitude coordinates. Key elements include a green triangle, yellow circle, and red square connected by lines, indicating movement paths within a shaded area representing a specific region.

Year 2 (n = 16)
Map showing post-smolt 1589113 movement with latitude and longitude coordinates marked on axes. Route includes coloured points from orange to yellow, a red square, and a green triangle, indicating key locations and travel path across a coastal area.
Map showing post-smolt 1589120 tracking data with latitude and longitude coordinates. Features include a green triangle and red square connected by a purple line, shaded grey areas with black dotted patterns, and dashed black lines indicating movement or boundaries.
Map showing post-smolt 1589133 tracking data with latitude and longitude coordinates marked on axes. Key elements include a green triangle and red square connected by a purple line, indicating movement from coastal area to offshore region with grey shaded zones and dotted patterns representing specific marine areas.
Map showing post-smolt 1589134 tracking with latitude and longitude coordinates along coastal and offshore areas. Key elements include a green triangle, red square, and coloured lines indicating movement paths, with shaded regions and dotted patterns representing specific zones or habitats.
Map displaying post-smolt 1589136 tracking data with latitude and longitude coordinates, showing movement paths marked by colored lines connecting a green triangle, yellow circles, and a red square. The map includes a coastal outline, shaded area with dotted patterns, and dashed lines indicating specific zones or boundaries relevant to the tracking study.
Map showing movement paths of a post-smolt fish tagged 1589145, with latitude and longitude coordinates marked on axes. Different coloured lines (purple, red, green) connect various points including a green triangle, red square, orange circle, and blue circles, indicating tracking locations and migration routes within a coastal area.
Map showing post-smolt 1589150 movement with latitude and longitude coordinates marked on axes. Path traced with coloured markers from red square to green triangle, passing through orange and yellow points within a grey shaded area, indicating tracked migration route and key locations.
Map showing post-smolt tracking data with latitude and longitude coordinates marked on axes. Key elements include a green triangle, orange circle, and red square connected by lines, overlaid on a grey shaded area with dotted patterns indicating specific zones.
Map showing post-smolt tracking data with latitude and longitude coordinates, highlighting movement from a red square marker to a green triangle marker. Grey shaded area with dotted and solid black lines indicates specific zones or pathways relevant to tracking, with a dark purple line connecting key points.
Map showing post-smolt tracking data with latitude and longitude coordinates, highlighting movement from a green triangle marker on land to a red square marker offshore. The map includes a grey shaded area with dotted and solid black lines indicating specific zones or paths relevant to the tracked subject.
Map displaying post-smolt 1589199 movement with latitude and longitude coordinates, featuring a green triangle, yellow and purple lines, and a red square marking key locations. The map highlights tracked paths and specific zones within a coastal area, with dotted patterns indicating distinct regions.
Map showing post-smolt tracking data with latitude and longitude coordinates, highlighting movement paths between marked points. Key elements include green triangle, red square, and dotted black areas indicating specific locations and tracked routes, illustrating migration or movement patterns.
Map showing post-smolt 1589204 movement with latitude and longitude coordinates marked. Key elements include a green triangle, red square, and connected coloured lines indicating tracked positions and paths within a coastal area.
Map showing post-smolt tracking data with latitude and longitude coordinates marked along axes. Key features include a green triangle, blue circle, and red square connected by green lines within a grey-shaded area, indicating movement or location points and boundaries.
Map showing post-smolt 1603169 tracking with latitude and longitude coordinates marked along axes. Key features include a green triangle, orange circle, and red square connected by a purple line, overlaid on a grey polygon representing a specific marine area with dotted patterns and coastal outline.
Map showing post-smolt tracking data with a green triangle marking the starting point and a red square indicating a key location connected by a dark line. Latitude and longitude axes frame a grey shaded area with dotted patterns, highlighting movement within specific coordinates off a coastal region.

Contact

Email: ScotMER@gov.scot

Back to top