Government Expenditure and Revenue Scotland (GERS) 2019-2020
Government Expenditure and Revenue Scotland (GERS) is a National Statistics publication. It estimates the revenue raised in Scotland and the goods and services provided for the benefit of Scotland.
Chapter 3: Public Sector Expenditure
Introduction
This chapter provides detailed estimates of public sector expenditure for Scotland. Expenditure is shown by type of spend, using a presentation based on the UN’s Classification of the Functions of Government (COFOG). Further information is provided in the Glossary in Annex D. Current and capital expenditure are shown separately.
The primary data sources used to estimate Scottish public sector expenditure in GERS are Scottish Government spending reported on the UK Government’s public spending system, OSCAR, and HM Treasury’s Public Expenditure Statistical Analyses (PESA)[21] and the supporting Country and Regional Analysis (CRA).[22]
Spending by the Scottish Government is provided directly by the Scottish Government Directorate for Financial Management. Scottish Local Government spending in all years is taken from HM Treasury’s PESA publication. Spending by other UK government departments spending is based on PESA for 2019-20 and on the CRA for earlier years. Further information on the methodology is set out in the expenditure methodology paper available at the link below.
https://www.gov.scot/collections/economy-statistics/#governmentexpenditureandrevenuescotland(gers)
GERS also includes some transactions between Scotland and the EU. These can be reported in a number of different ways, and are discussed in more detail later in the chapter.
GERS expenditure figures are presented on a National Accounts basis, an international reporting standard used by governments. This requires a number of accounting adjustments to be included in total expenditure. These are primarily symmetric adjustments that also form part of revenue, and therefore have little impact on the net fiscal balance. Further information is set out in Annex A.
As discussed in the preface, there are a number of changes to the expenditure in this year’s publication, reflecting changes in the UK Public Sector Finances. Some of these are primarily presentational, and do not affect the net fiscal balance, such as the change to capital consumption. The main revision to expenditure that impacts on the net fiscal balance is the change to student loans, which is discussed in Box 3.1.
Public Sector Expenditure
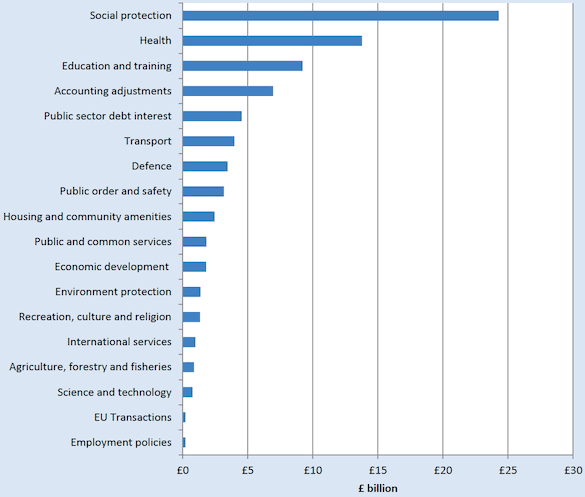
Total public sector expenditure for Scotland in 2019-20 is estimated to be £81.0 billion, an increase of 3.1% from 2018-19, compared to growth of 3.5% for the UK as a whole. Scotland’s public sector expenditure in 2019-20 was equivalent to 9.2% of total UK public sector expenditure. This is shown by spending category in Table 3.1.
| Scotland | ||
|---|---|---|
| £ million | % of total expenditure | |
| General public services | ||
| Public and common services | 1,809 | 2.2% |
| International services | 966 | 1.2% |
| Public sector debt interest | 4,533 | 5.6% |
| Defence | 3,451 | 4.3% |
| Public order and safety | 3,153 | 3.9% |
| Economic affairs | ||
| Enterprise and economic development | 1,795 | 2.2% |
| Science and technology | 754 | 0.9% |
| Employment policies | 209 | 0.3% |
| Agriculture, forestry and fisheries | 864 | 1.1% |
| Transport | 3,970 | 4.9% |
| Environment protection | 1,358 | 1.7% |
| Housing and community amenities | 2,443 | 3.0% |
| Health | 13,765 | 17.0% |
| Recreation, culture and religion | 1,323 | 1.6% |
| Education and training | 9,201 | 11.4% |
| Social protection | 24,275 | 30.0% |
| EU transactions | 210 | 0.3% |
| Accounting adjustments | 6,936 | 8.6% |
| Total Expenditure | 81,015 | 100% |
Table 3.2 below shows growth in current and capital spend in Scotland by organization in 2019-20, compared to the UK. Spending increased more slowly in Scotland than the UK as a whole in 2019-20. This is primarily due to spending on student loans increasing faster in the rest of the UK.
Box 3.1: Changes to the reporting of student loans
Student loans have been used in the UK since 1990, to help some students meet their living costs. In 1998, when tuition fees were introduced for UK universities, student loans were extended to cover these additional costs. At this point, the repayment of loans was also changed to be linked to income, referred to as an income-contingent repayment.
In Scotland, tuition fees were ended for Scottish students in 2001. At the time, they were replaced by a one-off charge at the time of graduation. This was later abolished in 2008.
Student loans are income-contingent, meaning that they are only repaid when the borrower’s earnings exceed a certain threshold, and are written-off, normally after 30 years, regardless of whether they have been repaid. This means that many students will not repay their loans in full.
Under the previous treatment, student loans were recorded as conventional loans. This means that interest is earned on the loan while it is outstanding, and if the loan is not repaid by the expiration date, a charge is recorded in the government accounts at that point. A number of concerns had been raised over this approach, including by the Office for Budget Responsibility, as it meant that:
- The public sector finances showed revenue associated with accrued interest on the loans, even when no payments were being made due to the income criteria not being met; and
- Due to the long length life of the loans, the government would likely face a large expenditure charge in future years when loans issued from 1998 onwards began to be written off.
In response to these concerns, the ONS undertook a review of different approaches for recording the loans, including considering approaches used internationally. The result of the review recommended that loans be recorded by recording part of the loan as a grant, which represents the amount of loan not expected to be repaid, with the remainder still recorded as a conventional loan. The grant element is recorded as capital spending in the year that the loan is issued.
The impact of this change on spending is shown in the table below for Scotland and the UK. As Scottish students do not face tuition fees, the value of loans issued is lower in Scotland, and as such the level of spending is also lower. This spending is currently captured through the expenditure accounting adjustments.
| 2015-16 | 2016-17 | 2017-18 | 2018-19 | 2019-20 | |
|---|---|---|---|---|---|
| Scotland | 165 | 198 | 311 | 285 | 324 |
| UK | 6,483 | 7,477 | 9,893 | 12,411 | 14,144 |
| Scotland as share of UK (%) | 2.5% | 2.6% | 3.1% | 2.3% | 2.3% |
The capital expenditure on student loans is the main impact on the net fiscal balance. However, there is also an impact on revenue, as less interest will be earned on the loans. More detail on the changes is available at:
| Scotland | UK growth | |||
|---|---|---|---|---|
| 2018-19 | 2019-20 | Growth | ||
| Current expenditure | 69,626 | 71,540 | 2.7% | 3.4% |
| Scottish Government | 27,255 | 28,020 | 2.8% | 2.8% |
| Local Government | 12,571 | 13,266 | 5.5% | 0.9% |
| Public Corporations | - | - | - | - |
| Other UK Government bodies | 29,800 | 30,254 | 1.5% | 4.1% |
| Capital expenditure | 8,972 | 9,475 | 5.6% | 4.3% |
| Scottish Government | 2,688 | 3,007 | 11.9% | 11.9% |
| Local Government | 2,142 | 2,350 | 9.7% | 11.4% |
| Public Corporations | 1,573 | 1,504 | -4.4% | 4.1% |
| Other UK Government bodies | 2,569 | 2,614 | 1.8% | 2.1% |
| Total expenditure | 78,598 | 81,015 | 3.1% | 3.5% |
| Scottish Government | 29,943 | 31,027 | 3.6% | 3.6% |
| Local Government | 14,713 | 15,616 | 6.1% | 2.1% |
| Public Corporations | 1,573 | 1,504 | -4.4% | 4.1% |
| Other UK Government bodies | 32,369 | 32,868 | 1.5% | 3.9% |
Notes:
1. Public corporation line for Scotland shows spending by Scottish public corporations only. UK figure shows spending by all public corporations
2. Scottish public corporations have no current expenditure as this is netted off against their income to provide their gross operating surplus in the revenue calculations. Consistent with the CRA, interest expenditure by public corporations is recorded as spending by HM Treasury.
3. Spend by Other UK Government departments for Scotland and the UK are not directly comparable, as spending for the UK as a whole includes spending on functions which are devolved to the Scottish Government.
Table 3.3 shows the split of total expenditure between current and capital for Scotland. The capital spending share increased in 2016-17. This reflects both increased local authority capital spending and increased Scottish Government capital spending in part due to the use of new capital borrowing powers. It has since remained at this higher level.
| per cent | |||||
|---|---|---|---|---|---|
| 2015-16 | 2016-17 | 2017-18 | 2018-19 | 2019-20 | |
| Current | 89.9% | 88.3% | 88.2% | 88.6% | 88.3% |
| Capital | 10.1% | 11.7% | 11.8% | 11.4% | 11.7% |
Table 3.4 below shows estimates of Scottish and UK public sector expenditure as a share of GDP. This provides an illustration of the relative size of public spending between countries and over time. It is not an estimate of the contribution of public spending to the economy as much of this spending consists of transfers from government to individuals and businesses. Excluding North Sea GDP, public sector spending as a share of GDP has increased by 0.7 percentage points in Scotland in 2019-20. This represents a change from the trend of falling public expenditure since 2015-16, and more generally since 2009-10, and reflects the increased spending announced by the UK Government in Spending Round 2019.
Although overall spending in Scotland grew more slowly than for the UK in 2019-20, spending as a share of GDP increased faster. This reflects weaker GDP growth in Scotland in 2019-20.
| per cent of GDP | |||||
|---|---|---|---|---|---|
| 2015-16 | 2016-17 | 2017-18 | 2018-19 | 2019-20 | |
| Scottish TME as a Share of GDP: | |||||
| Excluding North Sea GDP | 49.3% | 49.0% | 48.4% | 47.5% | 48.2% |
| Including population share of North Sea GDP | 49.0% | 48.8% | 48.1% | 47.2% | 47.9% |
| Including geographical share of North Sea GDP | 46.9% | 47.0% | 46.1% | 44.4% | 46.1% |
| UK TME as a share of GDP: | |||||
| 100% of North Sea GDP | 41.0% | 40.2% | 40.0% | 39.3% | 39.8% |
Table 3.5 shows total public sector expenditure per person for Scotland and the UK. The gap between Scottish and UK spending per person has increased since 2015-16. In part, this will reflect the new Scottish Government capital borrowing powers which began in 2015-16, and the decision by the Scottish Government to use its new devolved tax powers to on average increase the amount of funding available for public services. Slightly less than one percentage point of this difference is due to water and sewerage services being provided by the public sector in Scotland, and therefore included in Scottish expenditure, whilst in England and Wales they are operated by the private sector and therefore excluded from UK expenditure. Tables 3.6 and 3.7 show current, capital, and total expenditure for Scotland and the UK respectively.
| 2015-16 | 2016-17 | 2017-18 | 2018-19 | 2019-20 | |
|---|---|---|---|---|---|
| Scotland | 13,493 | 13,864 | 14,153 | 14,436 | 14,829 |
| UK | 12,162 | 12,360 | 12,626 | 12,802 | 13,196 |
| Difference (Scotland minus UK) | 1,331 | 1,504 | 1,527 | 1,634 | 1,633 |
| Difference between Scottish and UK | 10.9% | 12.2% | 12.1% | 12.8% | 12.4% |
Box 3.2 Social protection spending in Scotland
Social protection spending is the largest single spending line in GERS, and covers a range of different spend types.
The largest spending element within social protection is expenditure on the state pension by the Department for Work and Pensions (DWP). This is followed by DWP’s spending on other social security such as disability and incapacity related benefits, income support, jobseekers allowance, and housing benefit. Tax credits and child benefit are part of HMRC spending, which also includes universal credit. Scottish Government social security spend includes the Scottish Welfare Fund, Council Tax Reduction Scheme, and Scottish Government expenditure on Discretionary Housing Payments, all of which are administered by Local Authorities. From 2018-19, it also includes spending on newly devolved social security, including the Carer’s Allowance, Carer’s Allowance Supplement, and Best Start Grant. This means it is higher than the figures presented in Table 4.5.
Some UK social security expenditure, mostly associated with the state pension, is paid to non-UK residents. Scotland is allocated a population share of this expenditure in GERS.
| 2015-16 | 2016-17 | 2017-18 | 2018-19 | 2019-20 | |
|---|---|---|---|---|---|
| Social security spending in Scotland | |||||
| State pension | 7,870 | 8,064 | 8,243 | 8,146 | 8,318 |
| Housing benefit | 1,772 | 1,733 | 1,671 | 1,588 | 1,442 |
| Other DWP social security | 5,806 | 5,841 | 6,073 | 6,364 | 7,012 |
| HMRC child benefit and tax credits and universal credit | 2,876 | 2,761 | 2,686 | 2,422 | 2,382 |
| Scottish Government social security | 426 | 418 | 419 | 663 | 823 |
| Social security spending in Scotland | 18,750 | 18,817 | 19,092 | 19,183 | 19,977 |
| Share of benefit spending outside UK and corporate spend | 549 | 556 | 586 | 376 | 381 |
| Other social protection | |||||
| Net public sector pensions | 991 | 896 | 830 | 1,033 | 402 |
| Social care for the elderly | 2,292 | 2,216 | 2,178 | 2,196 | 2,319 |
| Other | 721 | 598 | 596 | 1,412 | 1,197 |
| Total social protection | 23,302 | 23,082 | 23,281 | 24,201 | 24,275 |
Other social protection spending consists primarily of Local Authority expenditure on social care to families and children.
A more detailed breakdown of social security spending is published by DWP, available at the link below.
https://www.gov.uk/government/collections/benefit-expenditure-tables
Spending by different parts of the Public Sector
Table 3.8 below provides a breakdown of Scottish expenditure by the Scottish Government, Scottish local government and public corporations, and other UK government bodies.
| £ million | |||||||||||||||
|---|---|---|---|---|---|---|---|---|---|---|---|---|---|---|---|
| Current | Capital | Total | |||||||||||||
| 2015-16 | 2016-17 | 2017-18 | 2018-19 | 2019-20 | 2015-16 | 2016-17 | 2017-18 | 2018-19 | 2019-20 | 2015-16 | 2016-17 | 2017-18 | 2018-19 | 2019-20 | |
| General public services | |||||||||||||||
| Public and common services | 1,295 | 1,250 | 1,297 | 1,347 | 1,446 | 256 | 246 | 350 | 263 | 363 | 1,551 | 1,496 | 1,646 | 1,611 | 1,809 |
| International services | 682 | 735 | 762 | 744 | 822 | 164 | 158 | 101 | 235 | 143 | 845 | 893 | 862 | 979 | 966 |
| Public sector debt interest | 4,439 | 4,663 | 5,110 | 4,643 | 4,533 | 0 | 0 | 0 | 0 | 0 | 4,439 | 4,663 | 5,110 | 4,643 | 4,533 |
| Defence | 2,294 | 2,296 | 2,332 | 2,408 | 2,564 | 729 | 762 | 844 | 885 | 887 | 3,023 | 3,057 | 3,176 | 3,293 | 3,451 |
| Public order and safety | 2,746 | 2,660 | 2,716 | 2,844 | 3,004 | 73 | 78 | 130 | 140 | 149 | 2,818 | 2,738 | 2,845 | 2,984 | 3,153 |
| Economic affairs | |||||||||||||||
| Enterprise and economic development | 910 | 906 | 959 | 1,112 | 1,324 | 140 | 342 | 366 | 500 | 471 | 1,051 | 1,249 | 1,326 | 1,612 | 1,795 |
| Science and technology | 101 | 146 | 181 | 186 | 189 | 377 | 349 | 383 | 533 | 565 | 478 | 494 | 564 | 720 | 754 |
| Employment policies | 217 | 214 | 230 | 246 | 209 | 2 | 5 | 9 | 4 | 0 | 219 | 219 | 239 | 250 | 209 |
| Agriculture, forestry and fisheries | 692 | 816 | 790 | 811 | 738 | 120 | 116 | 122 | 112 | 126 | 812 | 932 | 911 | 923 | 864 |
| Transport | 1,650 | 1,646 | 1,667 | 1,719 | 1,780 | 1,511 | 1,765 | 1,925 | 1,786 | 2,190 | 3,162 | 3,411 | 3,592 | 3,505 | 3,970 |
| Environment protection | 932 | 873 | 891 | 905 | 929 | 311 | 330 | 322 | 352 | 429 | 1,244 | 1,203 | 1,213 | 1,257 | 1,358 |
| Housing and community amenities | 160 | 112 | 159 | 213 | 227 | 1,410 | 1,476 | 1,689 | 2,029 | 2,216 | 1,570 | 1,588 | 1,848 | 2,242 | 2,443 |
| Health | 11,585 | 12,036 | 12,328 | 12,596 | 13,300 | 569 | 626 | 499 | 494 | 465 | 12,154 | 12,662 | 12,827 | 13,089 | 13,765 |
| Recreation, culture and religion | 1,140 | 1,092 | 1,061 | 1,169 | 1,123 | 263 | 310 | 258 | 236 | 201 | 1,404 | 1,403 | 1,320 | 1,405 | 1,323 |
| Education and training | 7,106 | 7,299 | 7,499 | 7,883 | 8,362 | 732 | 972 | 995 | 765 | 839 | 7,837 | 8,272 | 8,494 | 8,648 | 9,201 |
| Social protection | 23,234 | 23,012 | 23,223 | 24,115 | 24,170 | 68 | 71 | 58 | 86 | 105 | 23,302 | 23,082 | 23,281 | 24,201 | 24,275 |
| EU Transactions | 315 | 156 | 207 | 270 | 210 | 0 | 0 | 0 | 0 | 0 | 315 | 156 | 207 | 270 | 210 |
| Accounting adjustments | 5,771 | 6,338 | 6,363 | 6,414 | 6,610 | 609 | 1,146 | 999 | 554 | 326 | 6,379 | 7,484 | 7,362 | 6,968 | 6,936 |
| Total | 65,270 | 66,250 | 67,774 | 69,626 | 71,540 | 7,333 | 8,752 | 9,050 | 8,972 | 9,475 | 72,603 | 75,001 | 76,823 | 78,598 | 81,015 |
| £ million | |||||||||||||||
|---|---|---|---|---|---|---|---|---|---|---|---|---|---|---|---|
| Current | Capital | Total | |||||||||||||
| 2015-16 | 2016-17 | 2017-18 | 2018-19 | 2019-20 | 2015-16 | 2016-17 | 2017-18 | 2018-19 | 2019-20 | 2015-16 | 2016-17 | 2017-18 | 2018-19 | 2019-20 | |
| General public services | |||||||||||||||
| Public and common services | 9,778 | 9,656 | 10,092 | 10,204 | 11,341 | 1,433 | 2,827 | 2,381 | 2,576 | 3,140 | 11,211 | 12,483 | 12,473 | 12,780 | 14,481 |
| International services | 8,260 | 8,923 | 9,261 | 9,083 | 10,040 | 1,984 | 1,918 | 1,226 | 2,866 | 1,749 | 10,244 | 10,841 | 10,487 | 11,949 | 11,789 |
| Public sector debt interest | 53,788 | 56,642 | 62,206 | 56,728 | 55,382 | 0 | 0 | 0 | 0 | 0 | 53,788 | 56,642 | 62,206 | 56,728 | 55,382 |
| Defence | 27,796 | 27,881 | 28,399 | 29,422 | 31,336 | 8,831 | 9,250 | 10,271 | 10,816 | 10,835 | 36,627 | 37,131 | 38,670 | 40,238 | 42,171 |
| Public order and safety | 28,928 | 28,954 | 29,437 | 30,438 | 32,209 | 1,279 | 1,116 | 2,030 | 1,972 | 2,246 | 30,207 | 30,070 | 31,467 | 32,410 | 34,455 |
| Economic affairs | |||||||||||||||
| Enterprise and economic development | 6,733 | 6,589 | 7,306 | 9,398 | 12,593 | 733 | 1,678 | 2,688 | 3,777 | 3,123 | 7,466 | 8,267 | 9,994 | 13,175 | 15,717 |
| Science and technology | 875 | 978 | 1,126 | 1,011 | 1,020 | 3,868 | 3,510 | 3,920 | 5,422 | 5,786 | 4,743 | 4,488 | 5,046 | 6,433 | 6,806 |
| Employment policies | 2,379 | 2,347 | 2,512 | 2,632 | 2,251 | 22 | 60 | 105 | 47 | 2 | 2,401 | 2,407 | 2,617 | 2,679 | 2,253 |
| Agriculture, forestry and fisheries | 4,090 | 4,769 | 4,774 | 5,320 | 5,354 | 381 | 434 | 403 | 414 | 514 | 4,471 | 5,203 | 5,177 | 5,734 | 5,868 |
| Transport | 9,765 | 9,868 | 9,967 | 11,963 | 13,407 | 18,143 | 18,953 | 20,464 | 20,741 | 21,295 | 27,908 | 28,821 | 30,431 | 32,704 | 34,701 |
| Environment protection | 7,937 | 7,264 | 7,260 | 7,365 | 7,793 | 3,676 | 3,782 | 4,529 | 3,685 | 3,860 | 11,613 | 11,046 | 11,789 | 11,050 | 11,653 |
| Housing and community amenities | 2,988 | 2,943 | 2,979 | 3,086 | 3,286 | 6,847 | 7,359 | 8,377 | 8,961 | 11,179 | 9,835 | 10,302 | 11,356 | 12,047 | 14,465 |
| Health | 132,663 | 136,978 | 141,033 | 145,899 | 156,501 | 5,836 | 5,611 | 6,304 | 7,019 | 7,629 | 138,499 | 142,589 | 147,337 | 152,918 | 164,130 |
| Recreation, culture and religion | 9,326 | 9,382 | 9,306 | 9,267 | 9,144 | 2,041 | 2,224 | 2,173 | 2,120 | 2,417 | 11,367 | 11,606 | 11,479 | 11,387 | 11,561 |
| Education and training | 75,595 | 77,319 | 77,088 | 79,051 | 83,800 | 9,319 | 7,586 | 8,967 | 8,999 | 8,596 | 84,914 | 84,905 | 86,055 | 88,050 | 92,395 |
| Social protection | 264,585 | 264,975 | 268,245 | 274,261 | 274,876 | 317 | 451 | 483 | 551 | 470 | 264,902 | 265,426 | 268,728 | 274,812 | 275,346 |
| EU transactions | 7,671 | 4,723 | 5,360 | 7,874 | 6,132 | 0 | 0 | 0 | 0 | 0 | 7,671 | 4,723 | 5,360 | 7,874 | 6,132 |
| Accounting adjustments | 59,951 | 65,148 | 65,386 | 65,720 | 67,957 | 15,677 | 20,534 | 18,995 | 13,009 | 14,171 | 75,628 | 85,682 | 84,380 | 78,729 | 82,128 |
| Total | 713,108 | 725,339 | 741,737 | 758,722 | 784,420 | 80,387 | 87,292 | 93,316 | 92,975 | 97,011 | 793,495 | 812,631 | 835,053 | 851,697 | 881,431 |
| £ million | |||||||||||||||
|---|---|---|---|---|---|---|---|---|---|---|---|---|---|---|---|
| Scottish Government, LAs and Public Corporations | Other UK Government | Total | |||||||||||||
| 2015-16 | 2016-17 | 2017-18 | 2018-19 | 2019-20 | 2015-16 | 2016-17 | 2017-18 | 2018-19 | 2019-20 | 2015-16 | 2016-17 | 2017-18 | 2018-19 | 2019-20 | |
| General public services | |||||||||||||||
| Public and common services | 1,048 | 1,002 | 1,089 | 1,075 | 1,203 | 503 | 495 | 557 | 535 | 606 | 1,551 | 1,496 | 1,646 | 1,611 | 1,809 |
| International services | 0 | 0 | 1 | 1 | 1 | 845 | 893 | 861 | 978 | 965 | 845 | 893 | 862 | 979 | 966 |
| Public sector debt interest | 0 | 0 | 0 | 0 | 0 | 4,439 | 4,663 | 5,110 | 4,643 | 4,533 | 4,439 | 4,663 | 5,110 | 4,643 | 4,533 |
| Defence | 4 | 4 | 3 | 3 | 3 | 3,019 | 3,053 | 3,173 | 3,290 | 3,448 | 3,023 | 3,057 | 3,176 | 3,293 | 3,451 |
| Public order and safety | 2,592 | 2,515 | 2,626 | 2,756 | 2,912 | 226 | 223 | 219 | 228 | 241 | 2,818 | 2,738 | 2,845 | 2,984 | 3,153 |
| Economic affairs | |||||||||||||||
| Enterprise and econ development | 632 | 831 | 851 | 971 | 960 | 419 | 417 | 475 | 640 | 835 | 1,051 | 1,249 | 1,326 | 1,612 | 1,795 |
| Science and technology | 2 | 3 | 3 | 2 | 2 | 476 | 492 | 562 | 717 | 753 | 478 | 494 | 564 | 720 | 754 |
| Employment policies | 0 | 0 | 0 | 0 | 0 | 219 | 219 | 239 | 250 | 209 | 219 | 219 | 239 | 250 | 209 |
| Agriculture, forestry and fisheries | 804 | 922 | 901 | 915 | 856 | 8 | 11 | 11 | 8 | 8 | 812 | 932 | 911 | 923 | 864 |
| Transport | 2,359 | 2,397 | 2,518 | 2,466 | 2,753 | 803 | 1,014 | 1,074 | 1,038 | 1,217 | 3,162 | 3,411 | 3,592 | 3,505 | 3,970 |
| Environment protection | 949 | 938 | 925 | 998 | 1,078 | 295 | 265 | 288 | 259 | 280 | 1,244 | 1,203 | 1,213 | 1,257 | 1,358 |
| Housing and community amenities | 1,570 | 1,588 | 1,848 | 2,242 | 2,443 | 0 | 0 | 0 | 0 | 0 | 1,570 | 1,588 | 1,848 | 2,242 | 2,443 |
| Health | 12,002 | 12,508 | 12,660 | 13,002 | 13,680 | 152 | 155 | 167 | 87 | 85 | 12,154 | 12,662 | 12,827 | 13,089 | 13,765 |
| Recreation, culture and religion | 997 | 971 | 914 | 999 | 887 | 407 | 431 | 406 | 406 | 436 | 1,404 | 1,403 | 1,320 | 1,405 | 1,323 |
| Education and training | 7,814 | 8,247 | 8,467 | 8,632 | 9,184 | 23 | 25 | 27 | 16 | 16 | 7,837 | 8,272 | 8,494 | 8,648 | 9,201 |
| Social protection | 5,734 | 5,420 | 5,295 | 5,815 | 5,887 | 17,568 | 17,662 | 17,987 | 18,386 | 18,388 | 23,302 | 23,082 | 23,281 | 24,201 | 24,275 |
| EU transactions | 0 | 0 | 0 | 0 | 0 | 315 | 156 | 207 | 270 | 210 | 315 | 156 | 207 | 270 | 210 |
| Accounting adjustments | 5,694 | 6,266 | 6,422 | 6,351 | 6,299 | 685 | 1,218 | 940 | 616 | 637 | 6,379 | 7,484 | 7,362 | 6,968 | 6,936 |
| Total | 42,201 | 43,611 | 44,521 | 46,229 | 48,147 | 30,402 | 31,390 | 32,302 | 32,369 | 32,868 | 72,603 | 75,001 | 76,823 | 78,598 | 81,015 |
Scotland’s Notional Contributions to the European Union Budget
While a member of the European Union (EU), the UK contributed to the EU budget and receives funding from the EU via a number of programmes. Although the UK left the EU on 31 January 2020, it continues to make payments to, and receive funding from, the EU under transitional arrangements.
Scotland does not contribute directly to the EU budget. In GERS, Scotland is assigned an estimated share of the UK contribution. In contrast, Scotland receives funding directly from the EU, through the Common Agricultural Policy, European Structural Funds, and European Regional Development Funding. Actual amounts are used for these items.
The EU Transactions lines in the tables above are produced on a National Accounts basis, and exclude traditional own resource payments. These are payments collected by the UK on behalf of the EU, and therefore are excluded from the UK Public Sector Finances. However, they are normally included when reporting on the UK’s net contribution to EU budgets. Table 3.9 shows net payments to the EU including these contributions.
Although contributions to the EU are made by the public sector, funding from the EU is received by both public and non-public sector bodies. The EU Transactions line in the GERS tables report only on transactions with the EU by the public sector. EU payments to Higher Education Institutions, which are not part of the public sector, are discussed in Box 3.2.
Funding the EU Budget
There are three key sources of funding for the EU, which come from each member state:[23]
- Traditional own resource (TOR) - Agriculture duties and customs duties levied on agriculture and non-agriculture products from outside the EU
- VAT based own resource – Calculated as a percentage of countries’ VAT tax base.
- Gross National Income (GNI) based own resource – Calculated as a percentage of countries’ GNI. This is the EU’s single largest source of revenue.
Since 1985, the UK has received a rebate on its contribution, broadly equal to 66% of its net contribution in the previous year. Scotland is apportioned a population share of the rebate.
Net Contribution to the EU
The UK’s net contribution to the EU is calculated as the difference between the UK’s gross contribution to the EU budget (less the rebate) and public sector EU receipts.
The table below sets out these transactions for Scotland and the UK.
| Scotland | UK | |||||||||
|---|---|---|---|---|---|---|---|---|---|---|
| 2015-16 | 2016-17 | 2017-18 | 2018-19 | 2019-20 | 2015-16 | 2016-17 | 2017-18 | 2018-19 | 2019-20 | |
| GNI based contribution | 1,039 | 927 | 945 | 1,174 | 1,045 | 12,570 | 11,440 | 11,761 | 14,599 | 13,003 |
| UK abatement | -336 | -392 | -374 | -397 | -339 | -4,068 | -4,757 | -4,547 | -4,846 | -4,149 |
| VAT-based contribution to the EU | 227 | 204 | 244 | 257 | 225 | 2,751 | 2,477 | 2,974 | 3,138 | 2,696 |
| Expenditure transfers to the EU | 930 | 739 | 816 | 1,034 | 931 | 11,253 | 9,160 | 10,188 | 12,892 | 11,549 |
| Receipts to cover collection costs of TOR | -64 | -29 | -57 | -54 | -54 | -771 | -357 | -698 | -664 | -663 |
| TOR | 254 | 277 | 280 | 270 | 272 | 3,085 | 3,366 | 3,413 | 3,304 | 3,320 |
| Gross contribution to the EU budget | 1,121 | 987 | 1,039 | 1,250 | 1,148 | 13,567 | 12,169 | 12,903 | 15,531 | 14,206 |
| Public sector EU receipts | -551 | -554 | -552 | -710 | -666 | -2,811 | -4,081 | -4,130 | -4,360 | -4,754 |
| Net contributions to the EU budget | 570 | 433 | 487 | 540 | 482 | 10,756 | 8,088 | 8,773 | 11,171 | 9,452 |
| EU transactions (net contributions to EU institutions less TOR) | 315 | 156 | 207 | 270 | 210 | 7,671 | 4,722 | 5,360 | 7,867 | 6,132 |
Box 3.3: EU Payments to Higher Education Institutions
The figures above covered the transactions that the Scottish and UK public sector have with the EU. However, the EU also makes payments to bodies outside the public sector, such as Higher Education Institutions (HEIs), which are considered private sector not-for-profit institutions. The Higher Education Statistics Agency produces statistics on these payments. These payments are not included in the tables shown above as they are not transactions with the public sector and are therefore out of the scope of public sector finances.
Payments to HEIs from the EU include:
- Payments from EU government bodies
- Payments from EU-based charities through an open competitive process
- Payments from EU industry, commerce and public corporations
- Payments from other EU bodies
To illustrate the size of these payments, the table below shows research grants and contracts income from the EU to HEIs for Scotland and the UK for academic years 2014-15 to 2018-19, which is the latest year for which figures are available. This spending is outside the public sector, and therefore has no impact on the figures reported in GERS.
| £ million | |||||
|---|---|---|---|---|---|
| 2014-15 | 2015-16 | 2016-17 | 2017-18 | 2018-19 | |
| Scotland | 94.1 | 97.4 | 104.8 | 116.3 | 111.1 |
| UK | 836.1 | 840.6 | 877.2 | 924.4 | 990.8 |
Note: The academic year runs from 1 August to 31 July
Box 3.4: Private Finance Initiative and Non-Profit Distributing Financing support for Public Private Partnerships (PPPs)
This box gives an introduction to Public Private Partnerships (PPPs) and the funding models that have been used in Scotland. It also breaks down unitary charge payments by scheme type, by type of procuring authority and by the sector of the project. This analysis uses sources of publicly available data, all brought together into an accompanying spreadsheet. The spreadsheet is available from the GERS website.
Introduction to PFI, PPPs, and NPD
Public Private Partnerships (PPPs) are long-term contracts for services that include the provision of associated facilities or properties. Under the contract, the private sector is generally responsible for various roles, including designing and constructing a building or facility, and maintaining and servicing it throughout the contract term. The public sector retains accountability for the main public services. The private sector is responsible for financing the project up front and only receives payment from the public sector once construction has been completed and the services have commenced.
The Private Finance Initiative (PFI) used to be the UK’s preferred form of PPP. In Scotland, the Non-Profit Distributing (NPD) model has been the Scottish Government’s preferred procurement option since 2007. For more information on these schemes, and the data sources used in this box, please see the Scottish Government website:
http://www.gov.scot/Topics/Government/Finance/18232/12308
Unitary Charge Payments
Payments for both PFI and NPD projects take the form of a unitary charge which is usually paid annually over the lifetime of the contract. It is worth emphasising that these payments are already fully reflected in the GERS spending figures. In addition, the table below includes Ministry of Defence projects in Scotland which are procured by and entirely funded by the Ministry of Defence. Scotland is assigned a population share of this expenditure in GERS. Unitary charge payments cover repayment of capital, interest payments, and in some cases service charge payments. Figures are shown here for the years 2015-16 to 2019-20 to be consistent with other tables in this report. The underlying spreadsheets on the GERS website have data covering the period back to 1998-99 as well as estimated payments into the 2040s. Additional information about the individual procuring authority (e.g. individual local authority and health board information) and comparisons with the UK are also provided
| £ million | |||||
|---|---|---|---|---|---|
| 2015-16 | 2016-17 | 2017-18 | 2018-19 | 2019-20 | |
| By scheme type | |||||
| Private Finance Initiative | 995 | 998 | 1,013 | 1,027 | 1,046 |
| Non-Profit Distributing models1 | 72 | 107 | 189 | 271 | 333 |
| Total Unitary Charge payments | 1,067 | 1,106 | 1,202 | 1,298 | 1,379 |
| By procuring authority | |||||
| Further Education | 9 | 27 | 35 | 35 | 35 |
| Local Government | 507 | 514 | 548 | 586 | 606 |
| NHS | 247 | 258 | 273 | 303 | 328 |
| Other Scottish Government | 136 | 133 | 169 | 194 | 226 |
| Ministry of Defence | 21 | 25 | 26 | 26 | 24 |
| Scottish Water | 146 | 148 | 151 | 155 | 160 |
| Total Unitary Charge payments | 1,067 | 1,106 | 1,202 | 1,298 | 1,379 |
| By sector of project | |||||
| Energy | 5 | 5 | 5 | - | - |
| Further Education | 9 | 27 | 35 | 35 | 35 |
| Health | 247 | 258 | 273 | 303 | 328 |
| IT | - | - | - | - | - |
| Ministry of Defence | 21 | 25 | 26 | 26 | 24 |
| Offices | 3 | 3 | 3 | 3 | 3 |
| Police | 4 | 4 | 4 | 5 | 5 |
| Prisons | 49 | 47 | 47 | 48 | 50 |
| Schools | 462 | 469 | 502 | 546 | 565 |
| Transport | 104 | 102 | 138 | 161 | 192 |
| Waste | 163 | 165 | 169 | 172 | 178 |
| Total Unitary Charge payments | 1,067 | 1,106 | 1,202 | 1,298 | 1,379 |
| UK Total Unitary Charge Payments | 10,502 | 10,471 | 10,715 | 10,099 | 10,152 |
| Scotland as % UK | 10.2% | 10.6% | 11.2% | 12.9% | 13.6% |
1 Non-profit distributing models includes projects delivered by the hub model and projects commissioned prior to 2010. Further detail is available at: http://www.gov.scot/Topics/Government/Finance/18232/12308
Source: HM Treasury and Scottish Government figures. See the accompanying spreadsheet for full details of all sources
Contact
Email: Economic.Statistics@gov.scot
There is a problem
Thanks for your feedback