Coronavirus (COVID-19) vaccine certification: evidence paper
This paper summarises the range of evidence available on vaccination certification schemes. Evidence is drawn from clinical and scientific literature, from public opinion and from international experience.
2. The current state of the epidemic.
2.1 Cases, hospitalisations and deaths
In late August 2021, COVID-19 cases reached a higher peak than the last wave of cases in July 2021. Cases are currently decreasing but remain high across most local authorities[1]. Case rates are lower in fully vaccinated individuals, than unvaccinated and partially vaccinated individuals (Figure 1).
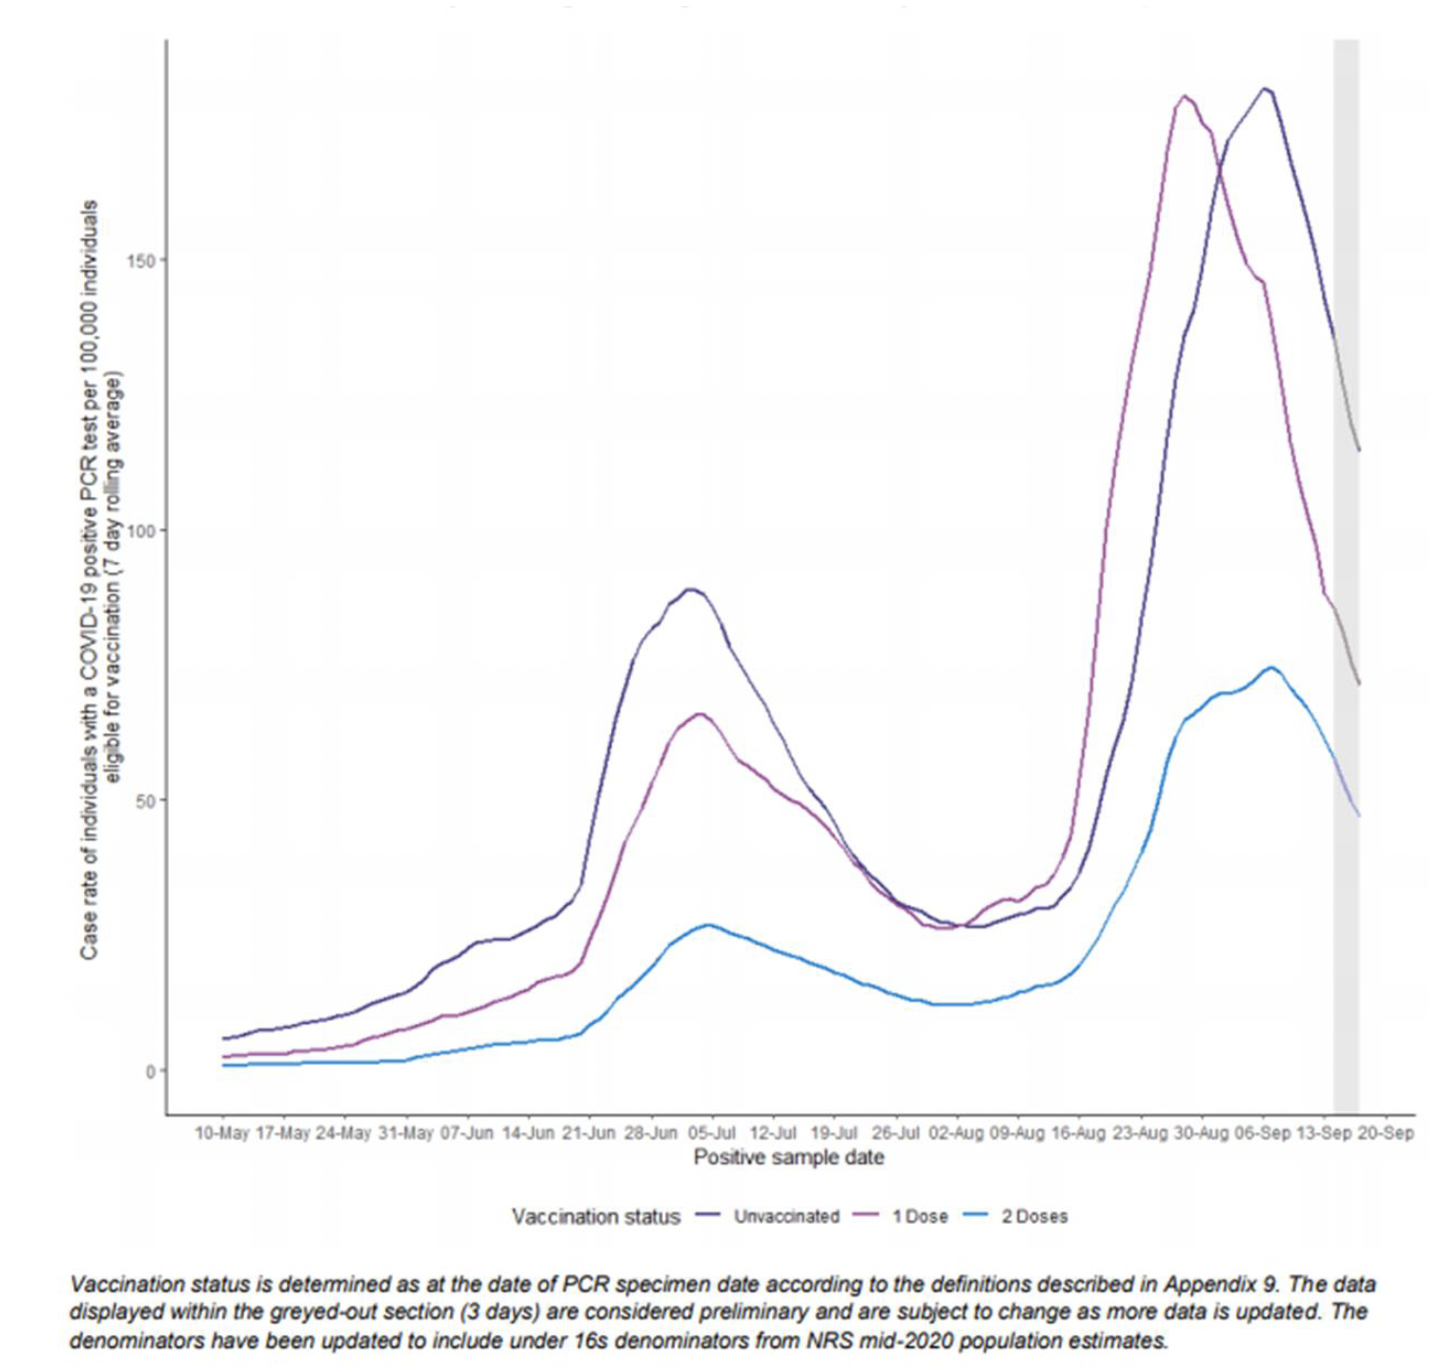
Source: Public Health Scotland COVID-19 Statistical Report 22 September 2021
COVID-19 related acute hospital admissions have also increased over the past month but are now decreasing[2]. Hospitalisation rates are higher among unvaccinated individuals (Figure 2).
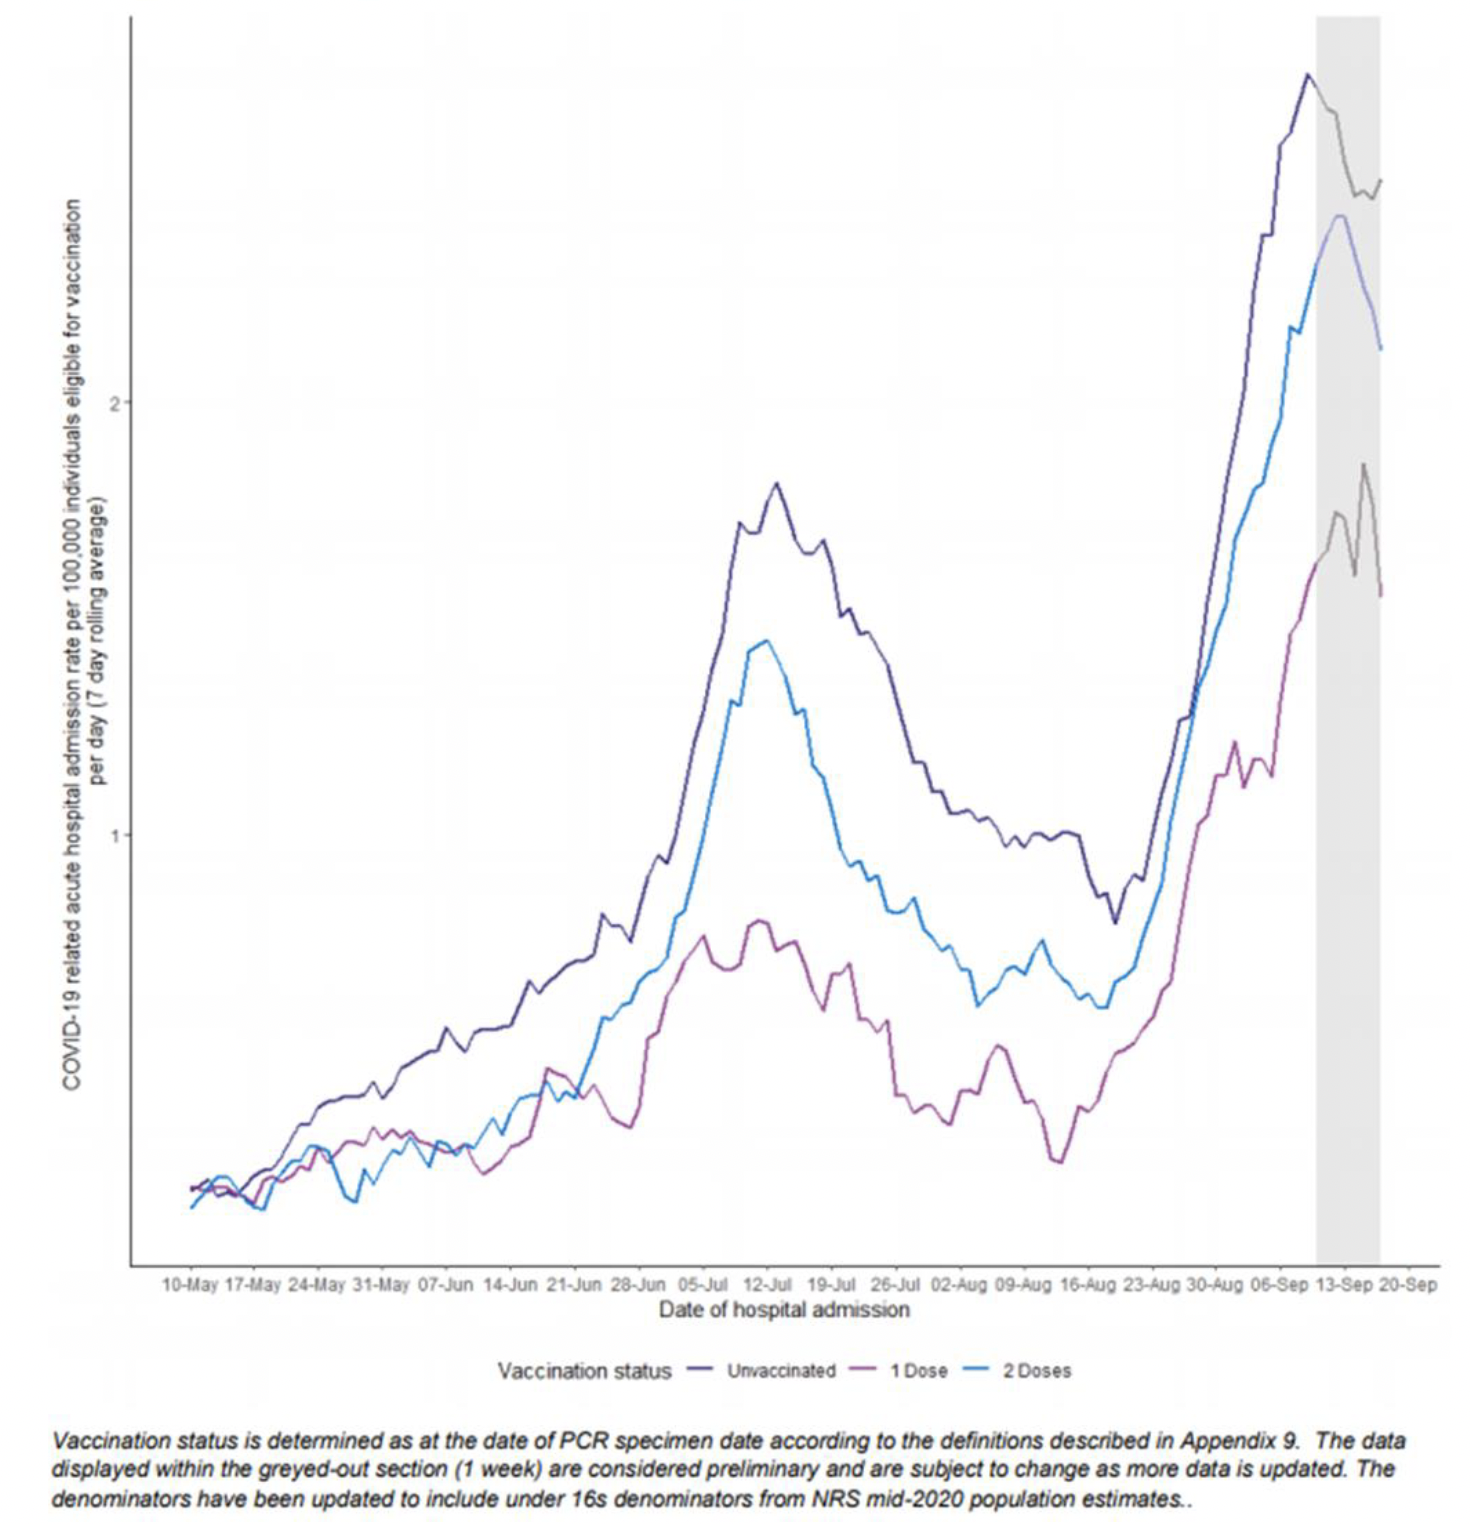
Source: Public Health Scotland COVID-19 Statistical Report 22 September 2021
Of those individuals that have been fully vaccinated, from 29 December to 10 September, 0.01% have died with COVID-19 recorded as an underlying or contributory cause of death[3].
More information on the current situation as of 24th September in Scotland can be found in the State of the Epidemic report which is updated and published on a weekly basis[4].
2.2 Forecasts for the medium term
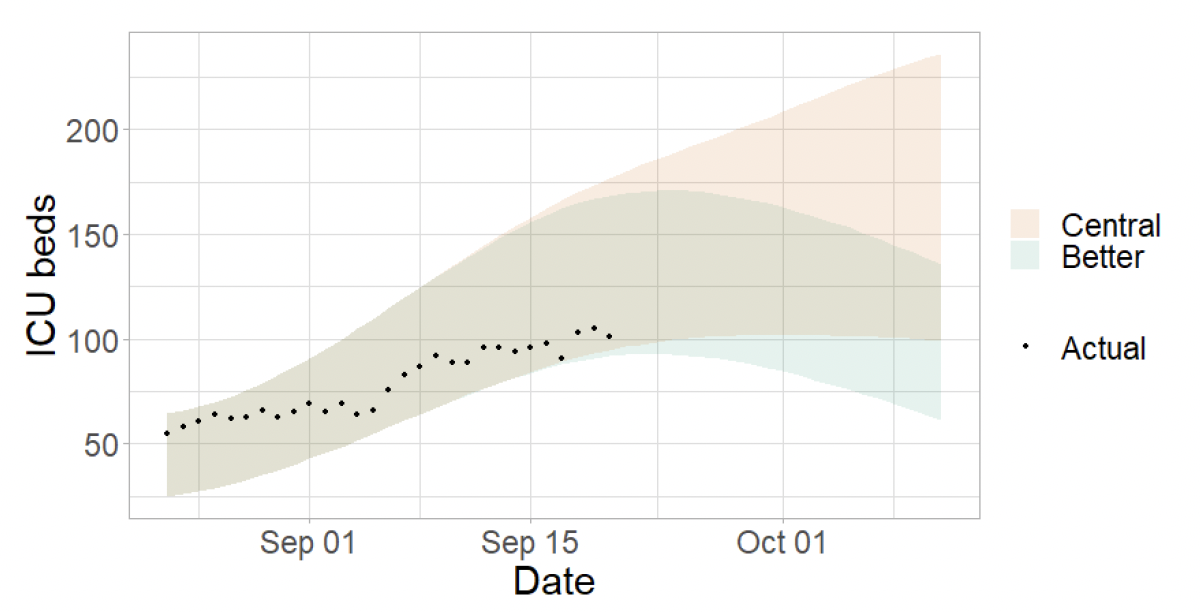
Predictions of the impact of COVID-19, in terms of estimated number of infections, hospitalisations and ICU, on the NHS over the coming weeks are modelled by Scottish Government analysts (Figures 3, 4 & 5) and show two projections over the three weeks to 10th October. 'Central' assumes that infections have plateaued. 'Better' assumes that infections continue to fall[5].
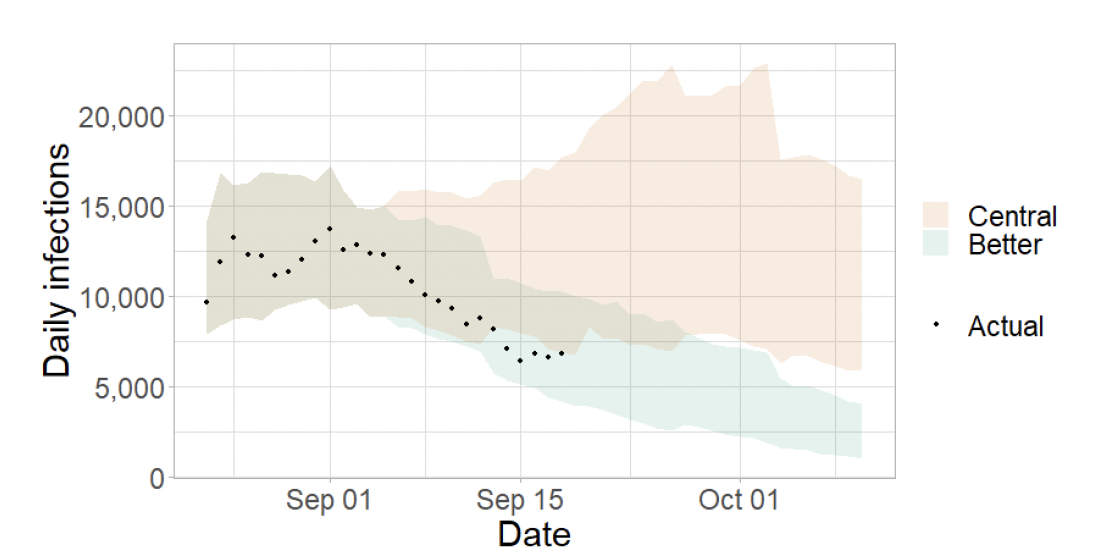
Source: Coronavirus (COVID-19): modelling the epidemic (issue no. 70) - gov.scot (www.gov.scot)
There is uncertainty as to how much infections will increase or decrease in coming weeks.
Figure 4 shows the impact of the projections on the number of people in hospital. The modelling includes all hospital stays, whereas the actuals only include stays up to 28 days duration that are linked to COVID-19. Hospital and ICU occupancies have plateaued. The scale of any future increase or decrease in hospital occupancy and intensive care use is highly uncertain, and depends on the number of infections.
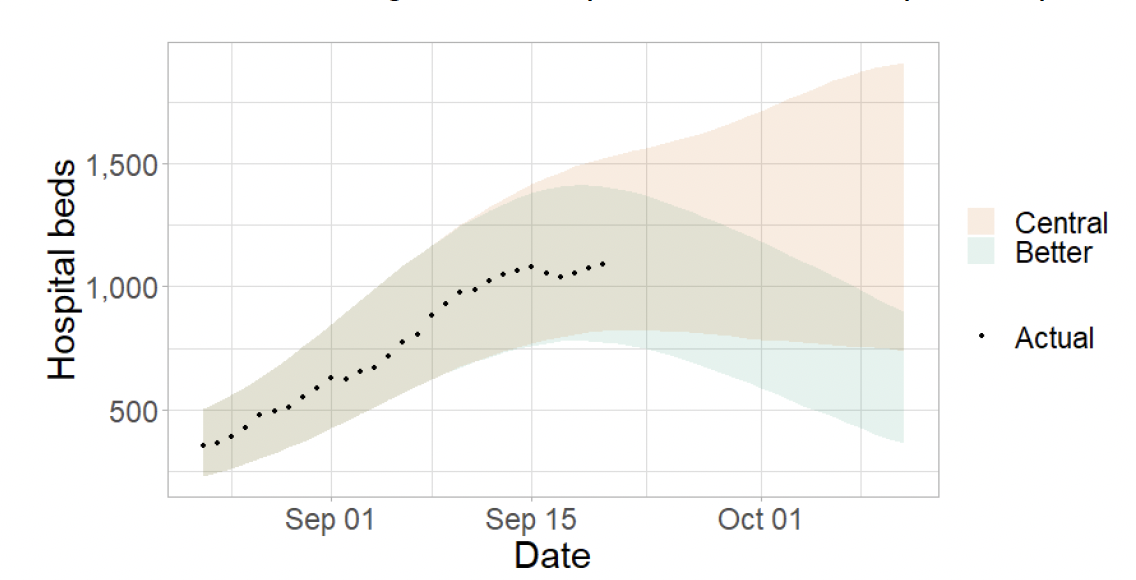
Source: Coronavirus (COVID-19): modelling the epidemic (issue no. 70) - gov.scot (www.gov.scot)
Source: Coronavirus (COVID-19): modelling the epidemic (issue no. 70) - gov.scot (www.gov.scot)
More information on Scottish Government modelling can be found in the Coronavirus (COVID-19): modelling the epidemic in Scotland report which is updated and published on a weekly basis[8].
What the above predictions tell us is that there is still a degree of uncertainty about the future and we cannot be assured that the current positive position will continue.
2.3 Vaccination progress
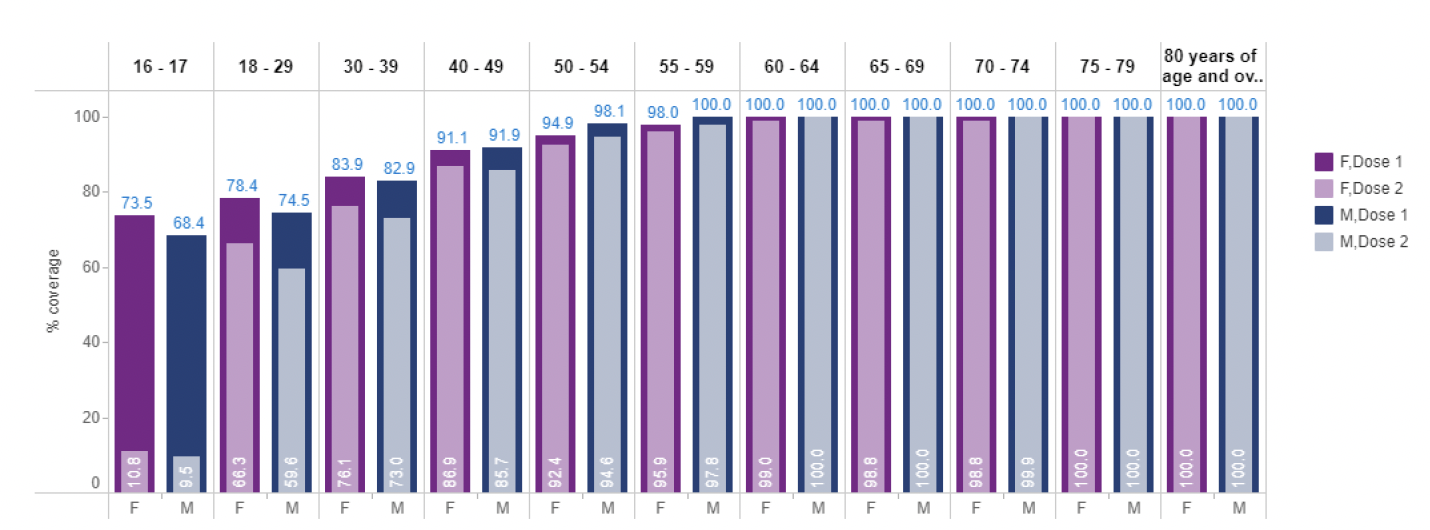
Vaccine uptake has progressed extremely well in the Scottish adult population with approximately 76% of 18 to 29 year olds and 71% of 16 to 17 year olds having received the first dose of the vaccine. Around 96% of people aged 40 and over have received two doses of the vaccine[9] [10], see Figure 6. This puts Scotland in a different position to a number of other countries where vaccination rates were much lower on the introduction of certification, see section 5.3.
Source: COVID-19 Daily Dashboard | Tableau Public. Updated 27th September 2021, data related to 26th Sept
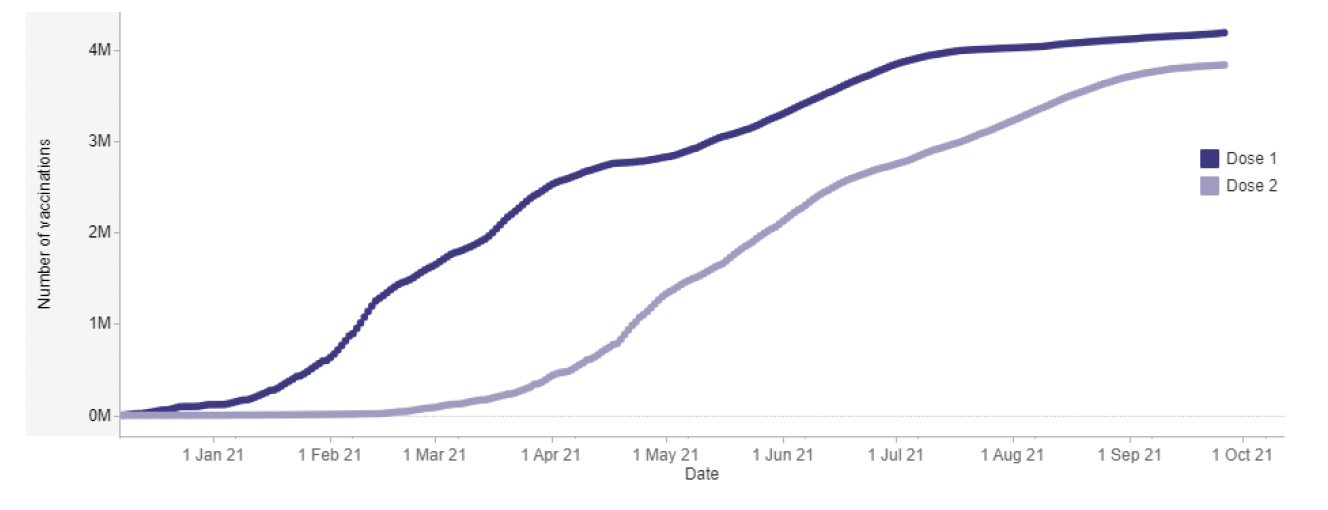
In recent months the rate of first doses of vaccination has been slowing, see Figure 7. On 26 September 91.3% of those aged 16+ had received a first dose of the vaccination, there has been an increase of 1.2 percentage points in the latest 4 weeks compared to an increase of 11.1 percentage points in the 4 weeks leading up to 1 July. In recent weeks the rate of second doses of vaccination has been slowing, on 26 September 84.2% of those aged 16+ had received a second dose of the vaccination, there has been an increase of 3.5 percentage points in the latest 4 weeks compared to 12.4 percentage points in the 4 weeks leading up to 1 July[11].
It was announced on 4 August that 16-17 year olds would be offered the vaccine from 6 August. The proportion of people aged over 16+ that had received a first dose increased from 72.4% to 81.6% in the first four weeks of 16-17 years olds being offered the vaccine.
Source: COVID-19 Daily Dashboard | Tableau Public. Updated 27th September 2021, data related to 26th Sept
Forecasting suggests a second dose coverage of the 16+ population of between 83.9% and 86%, with a central estimate of 84.3% by 30 September. Trend analysis suggests that first dose coverage of 16 and 17 year olds may reach between 73.1% and 78% (central estimate: 76.1%) by 30 September. Applying forecasting to 18 to 29 year olds indicates a second dose coverage of between 62.6% and 66.4% by 30 September. Similarly, for 30 to 39 year olds, second dose coverage is estimated to reach between 74.6% and 76.2% by 30 September.
2.4 The impact on the Health service
The COVID-19 pandemic is having an impact on our health and social care in Scotland in a number of ways. This includes the impact on our health and social care services, how people are using those services, and how this impacts on health. As we prepare for autumn and winter our primary and secondary health and social care services face significant and increasing pressures and demands. The rapid rise in COVID-19 cases and hospitalisations in Scotland over recent weeks illustrates the need to take action to reduce transmission in high risk settings in order to reduce the risk of serious illness and death and alleviate pressures on the NHS.
For example, elective inpatient and day case activity reduced by 46.8% during April 20 - June 21(circa 164,000 surgical procedures), compared to pre-pandemic (April 18 – June 19). Elective inpatient and day case activity for quarter ending June 2020 was at 20.7% of pre-COVID-19 activity when compared to June 2019. For quarter ending June 2021, inpatient and day case activity was at 72.8% of pre-COVID-19 activity (June 2019).
There is uncertainty as to how much infections will increase or decrease in coming weeks. Hospital and ICU occupancies appear to be plateauing but the scale of any future change in hospital occupancy and intensive care use is highly uncertain, and depends on the number of infections[12].