Coronavirus (COVID-19) state of the epidemic 26 May 2022
This report brings together the different sources of evidence and data about the Covid epidemic to summarise the current situation, why we are at that place, and what is likely to happen next.
Covid-19 Prevalence
R value, Growth Rate and Estimated New Daily Infections
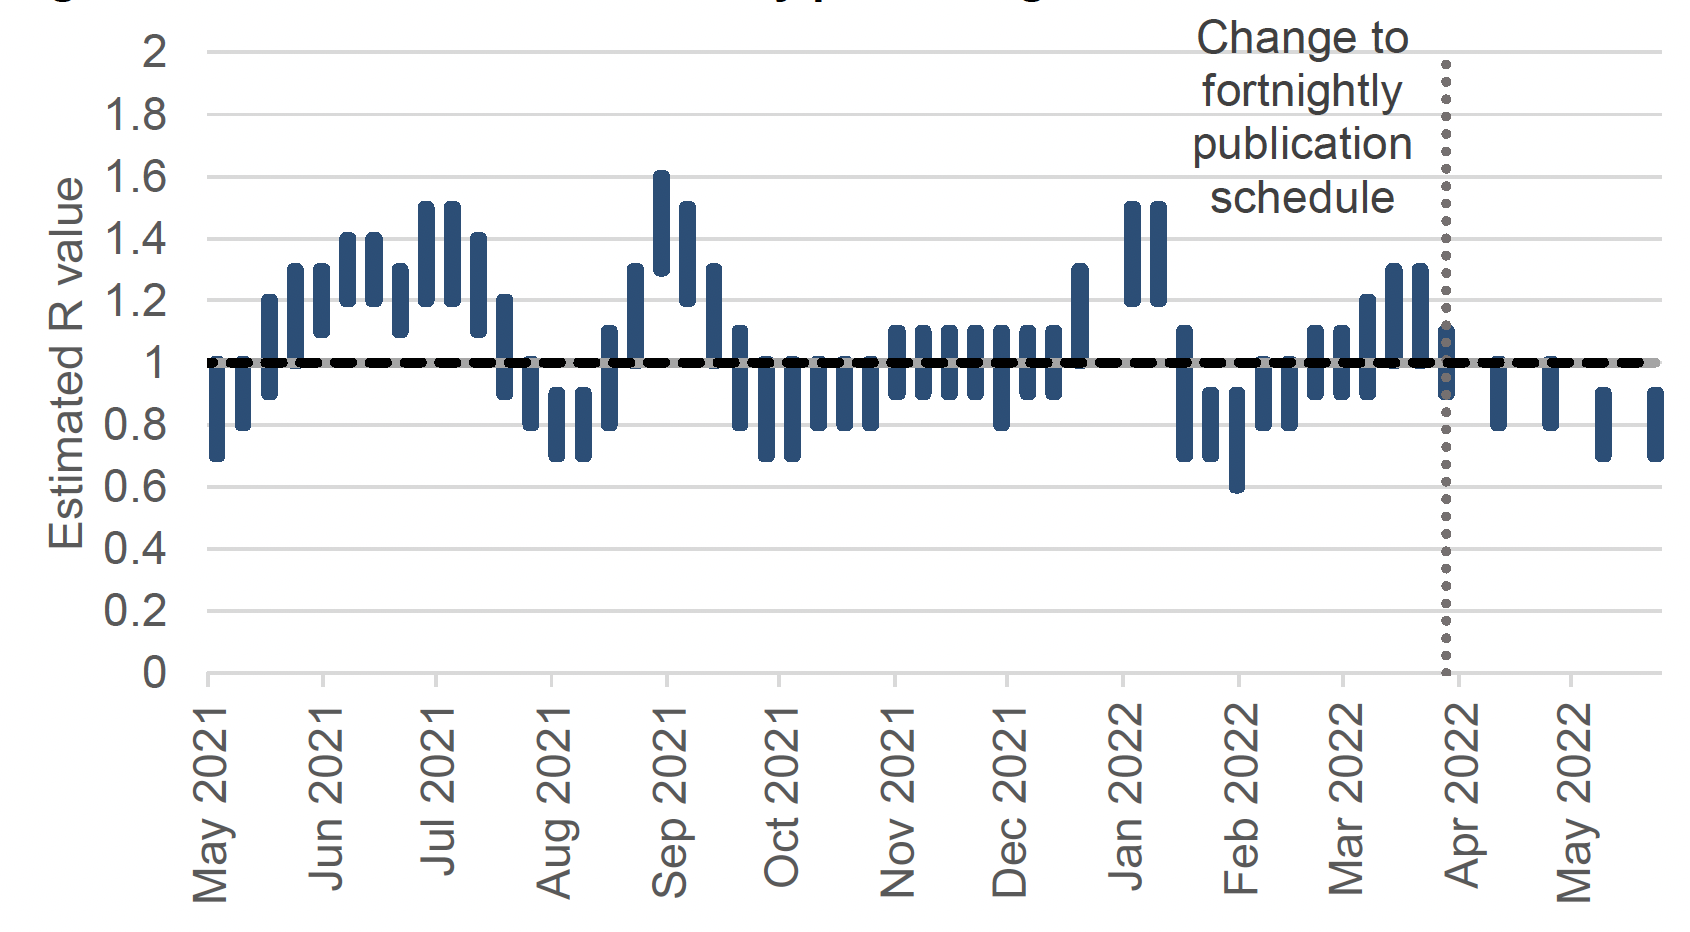
The reproduction number (R) is the average number of secondary infections produced by a single infected person. If R is greater than one the epidemic is growing, if R is less than one the epidemic is shrinking. The higher R is above one, the more people one infectious person might further infect and so the faster the epidemic grows. Please note that R is an indicator that lags by two or three weeks. For more information please visit the UK government website.
The UK Health Security Agency's (UKHSA) consensus estimate for R in Scotland as at 10 May is between 0.7 and 0.9. The lower and upper limits of the R value are unchanged since the previous publication (Figure 1)[4] [5].
UKHSA was unable to form a consensus view on the incidence of new daily infections in Scotland as at 10 May[7].
The growth rate reflects how quickly the numbers of infections are changing day by day. It is an approximation of the percentage change in the number of new infections each day. More information can be found on the UK government website.
The latest growth rate for Scotland as at 10 May was between -5% and -2%. The upper growth and lower growth limit have both increased since the last published figure[8] [9].
Covid-19 Infection Survey – Headline Estimates
The Covid-19 Infection Survey is a UK wide study carried out by the Office for National Statistics (ONS) and the University of Oxford. The survey invites people living in private households to test whether they have the infection, regardless of whether they have symptoms, using a PCR test. This means the study is unaffected by testing policy changes. Participants are also asked to provide a blood sample to test for antibodies.
To accommodate the earlier State of the Epidemic report publication this week, we present the Covid-19 Infection Survey results released last Friday, 20 May 2022, relating to the week 7 to 13 May 2022. These are the latest available results at the time of publication.
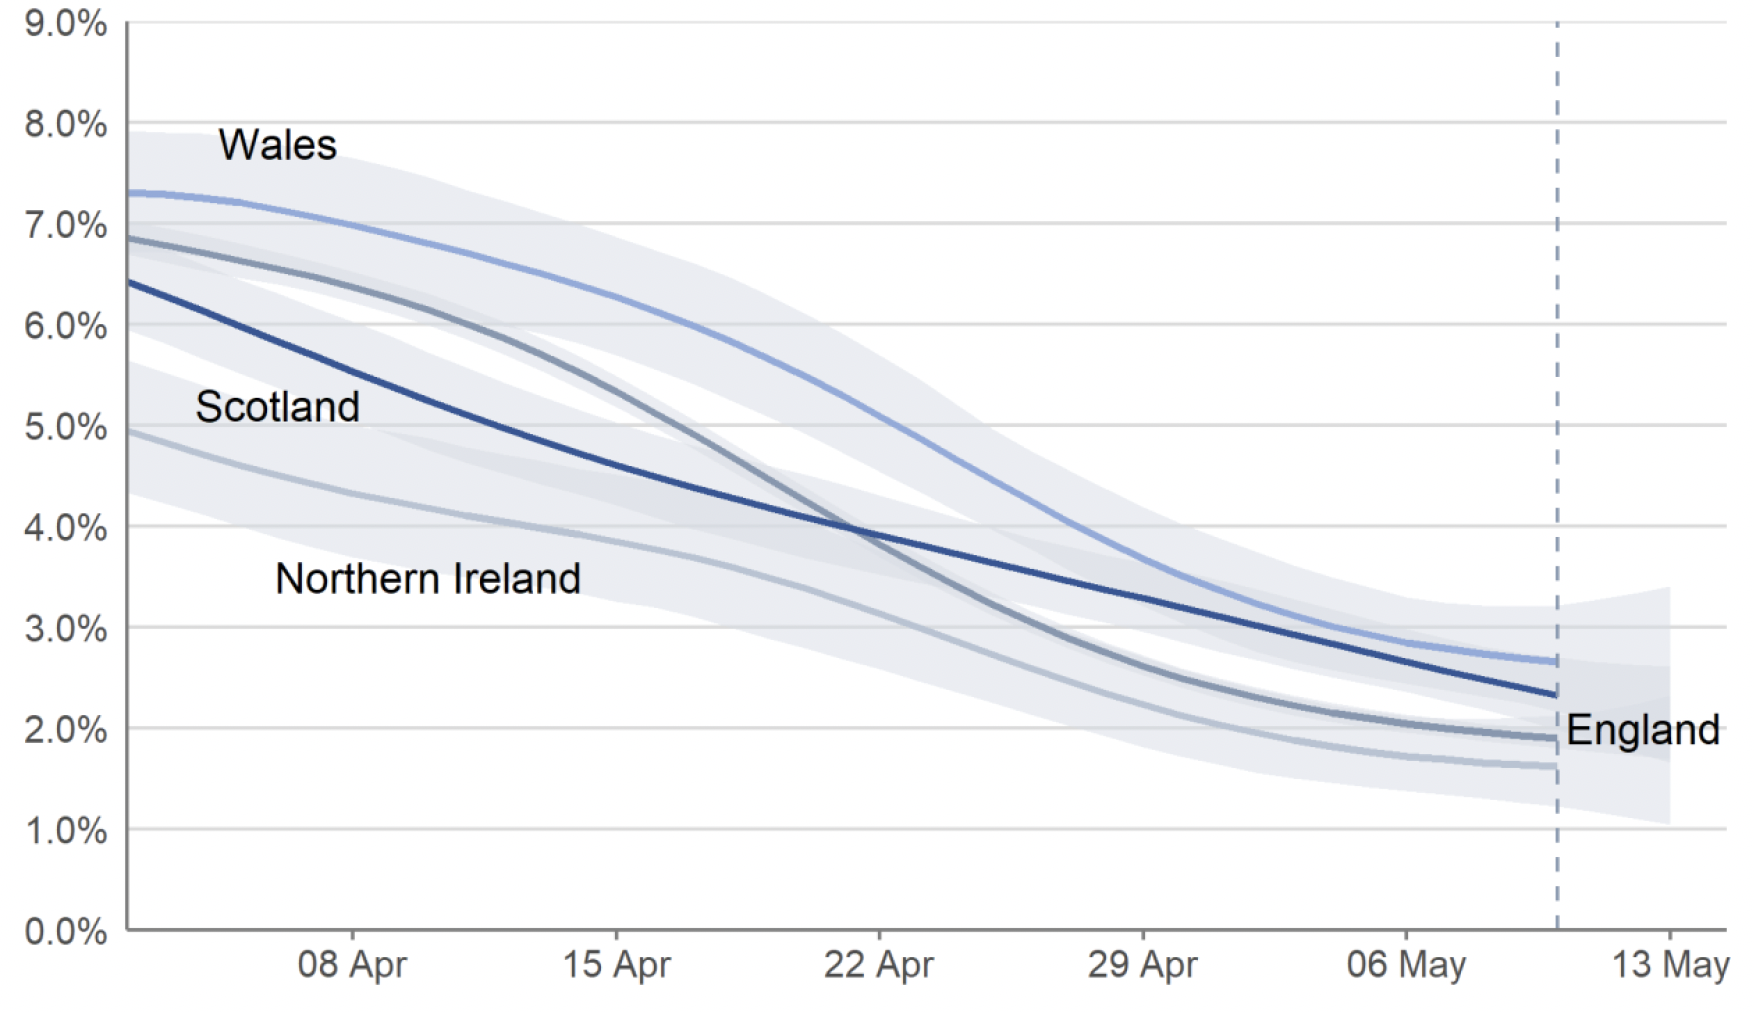
In Scotland, the percentage of people living in private households testing positive for Covid-19, as estimated by the Covid-19 Infection Survey, continued to decrease in the most recent week (7 to 13 May), as seen in Figure 2[10]. The estimated percentage of people testing positive in Scotland has been decreasing since late-March. This follows a peak in the week 14 to 20 March 2022 which saw the highest estimate for Scotland since the survey began. The estimated percentage of people testing positive for Covid-19 in the week 7 to 13 May in Scotland is 2.32% (95% credible interval: 1.98% to 2.70%)[11], equating to around 1 in 45 people (95% credible interval: 1 in 50 to 1 in 35).
In the week 7 to 13 May 2022, estimates for the other nations of the UK are as follows and can be seen in Figure 2:
- In England, the percentage of people testing positive continued to decrease: 1.90% (95% credible interval: 1.80% to 2.00%), equating to around 1 in 55 people (95% credible interval: 1 in 55 to 1 in 50).
- In Wales, the percentage of people testing positive continued to decrease: 2.66% (95% credible interval: 2.16% to 3.22%), equating to around 1 in 40 people (95% credible interval: 1 in 45 to 1 in 30).
- In Northern Ireland, the percentage of people testing positive continued to decrease: 1.62% (95% credible interval: 1.22% to 2.13%), equating to around 1 in 60 people (95% credible interval: 1 in 80 to 1 in 45).
The estimated percentage of people living in private households in Scotland testing positive for Covid-19 has decreased for all age groups in recent weeks[13].
Covid-19 Infection Survey – Regional Analysis
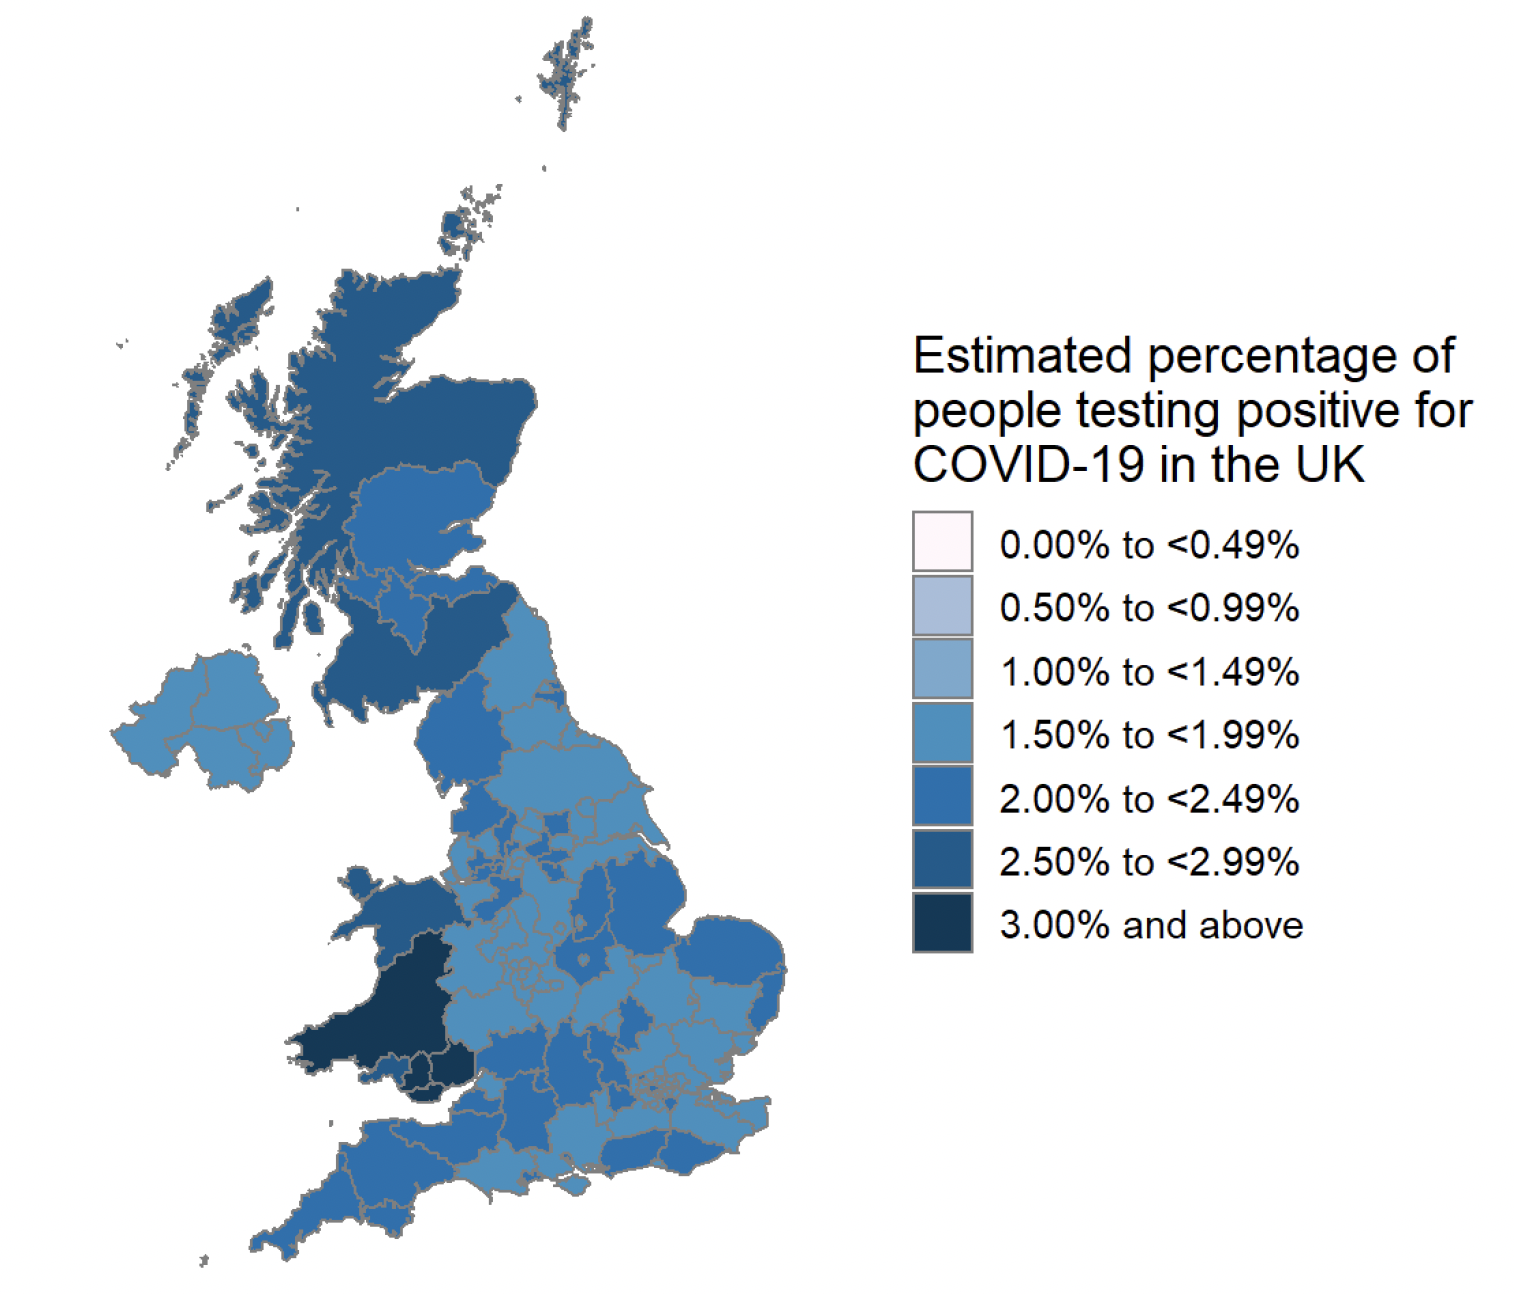
The ONS have created sub-regions across the UK for the purposes of providing Covid-19 positivity estimates for the residential populations on a lower level than the four nations. In Scotland, these sub-regions are comprised of Health Boards (for an overview on how these align with local authorities, please see Table 1 in the Technical Annex).
To accommodate the earlier State of the Epidemic report publication this week, we present the Covid-19 Infection Survey results released last Friday 20 May 2022, relating to the week 7 to 13 May 2022. These are the latest available results at the time of publication.
In the most recent week (7 to 13 May 2022), estimates for the percentage of people testing positive were similar for all CIS Regions in Scotland and ranged from 2.27% in CIS Region 126 (NHS Lothian) (95% credible interval: 1.81% to 2.85%) to 2.65% in CIS Region 123 (NHS Grampian, NHS Highland, NHS Orkney, NHS Shetland and NHS Western Isles) (95% credible interval: 2.13% to 3.36%).
Overlapping credible intervals indicate that there may not be a true difference between the estimates (Figure 3)[14] [15]. Figure 3 is also available as a dynamic map.
Covid-19 Wastewater Estimates
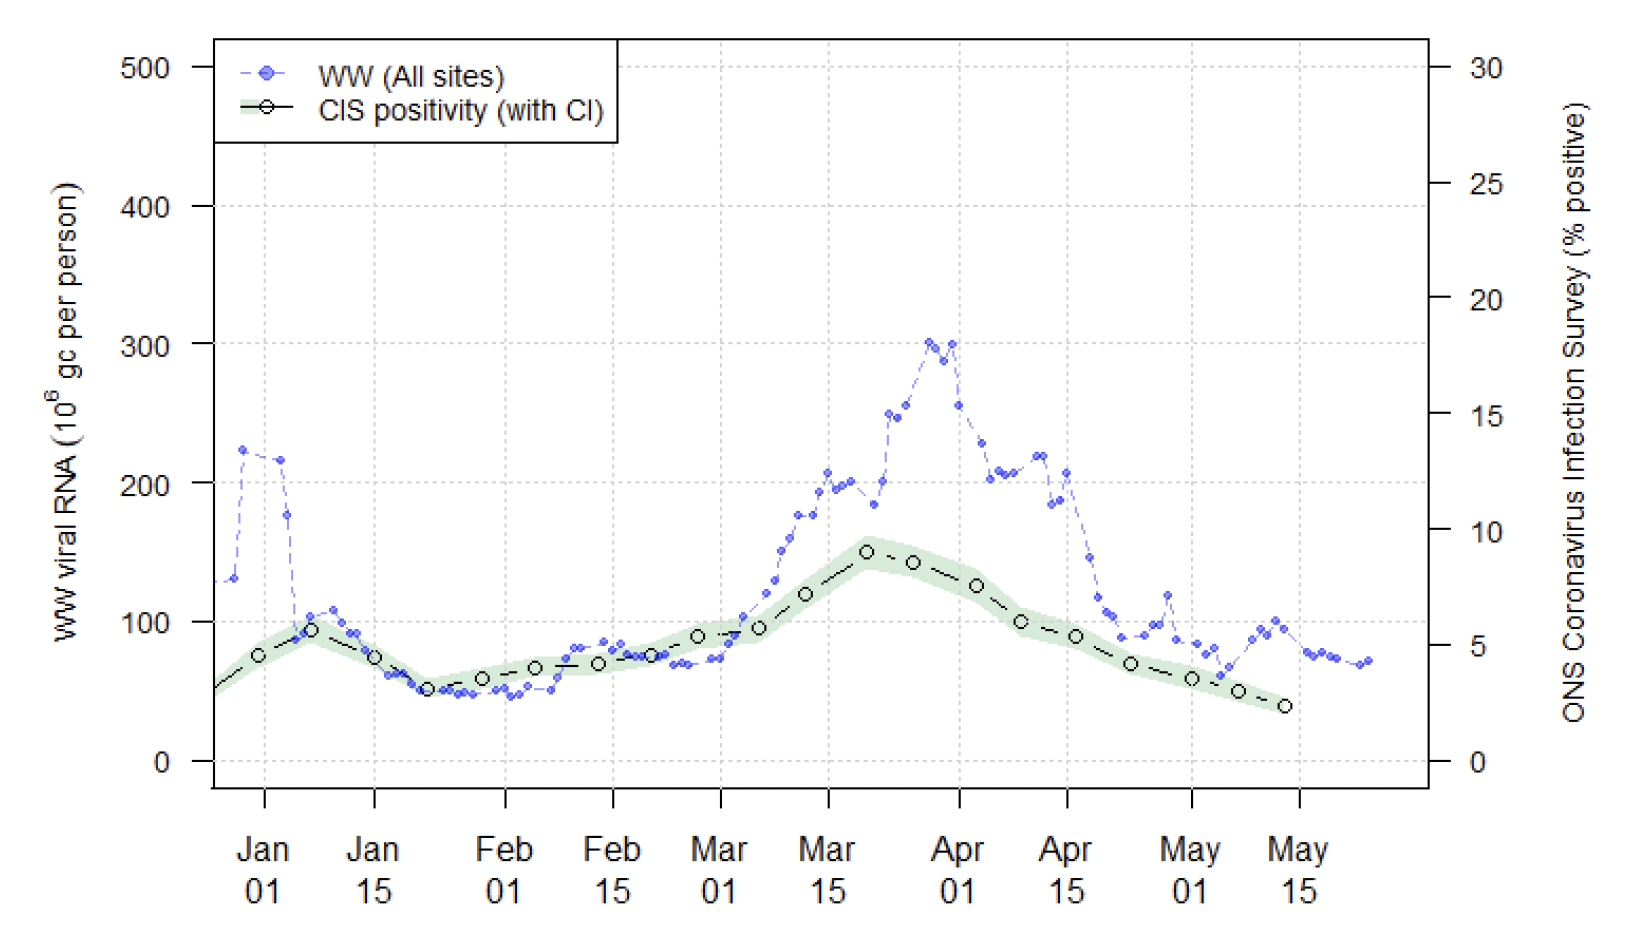
The Scottish Government has been working with the Scottish Environment Protection Agency (SEPA) to detect and analyse fragments of Covid-19 virus RNA in wastewater. The levels of SARS-CoV-2 in wastewater are monitored at 141 sites around Scotland. In contrast to Covid-19 case records, virus shedding into wastewater is a biological process. This means that wastewater data is unaffected by factors that impact whether testing is done.
Nationwide, wastewater Covid-19 RNA levels in the past two weeks have had a similar average level as in our previous report. In the two weeks from 11 to 24 May, the medial level of Covid-19 in wastewater was 76 million gene copies per person per day (Mgc/p/d), compared to 82 Mgc/p/d previously. There is no significant difference between the two weeks (Figure 4)[17].
Although overall wastewater Covid-19 levels have remained at a similar level in Scotland over the last two weeks, 16 local authorities have increased their levels over the past week. Increases were reported in Aberdeen City, Angus, Argyll and Bute, Clackmannanshire, Dumfries and Galloway, East Lothian, East Renfrewshire, Fife, Midlothian, Moray, North Lanarkshire, Perth and Kinross, Scottish Borders, South Lanarkshire, Stirling and West Lothian. Please note that comparisons for Na h-Eileanan Siar and Orkney are not possible due to sampling coverage.
Reported Covid-19 Cases
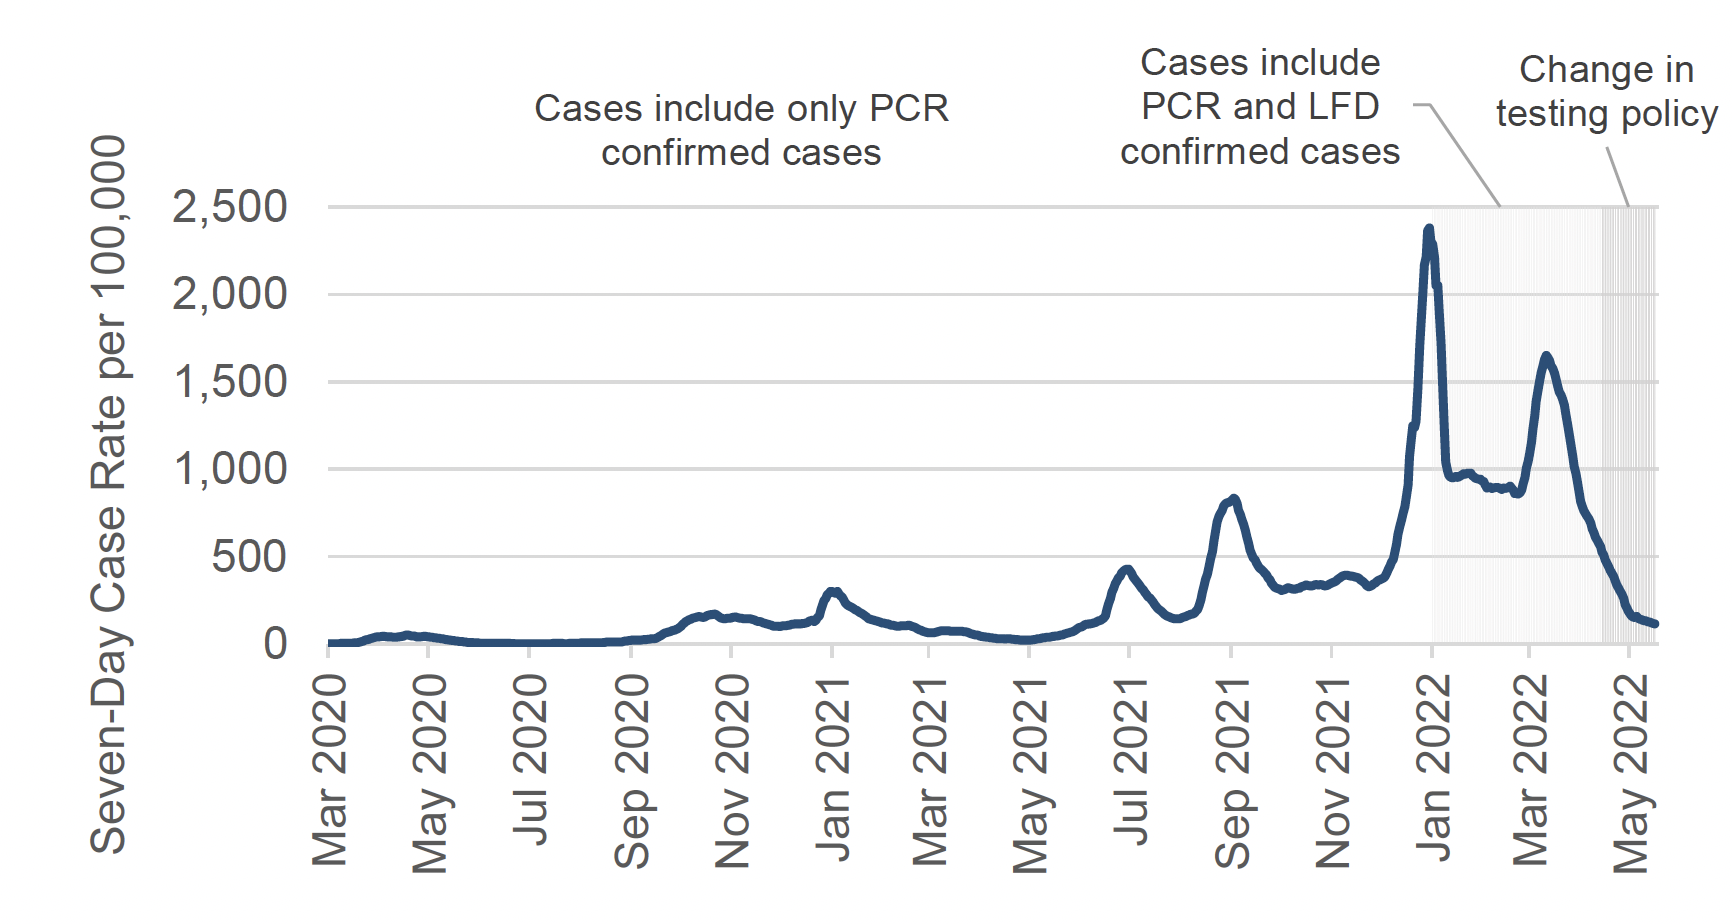
The LFD Universal Offer for asymptomatic testing came to an end on 18 April 2022. In addition, on 1 May 2022 the purpose of COVID-19 testing shifted from population-wide testing to reduce transmission, to targeted testing and surveillance. Reported cases will no longer be representative of all COVID-19 cases in Scotland, and caution is advised when comparing trends in cases over time. For more information, see the Scottish Government Covid-19 Test and Protect Transition Plan.
Please note that due to testing policy changes, reported cases will no longer be representative of all COVID-19 cases in Scotland, and caution is advised when comparing trends in cases over time. The regular analyses on case rates in different age groups and among care home residents are no longer included in this report. By specimen date, there were 114 weekly combined PCR and LFD cases (including reinfections) per 100,000 population in the week to 20 May (Figure 5)[21].
The proportion of reinfections among the total weekly cases has increased in the most recent week. By specimen date, there was a total number of 870 reinfection cases confirmed by either a PCR or LFD test in the week leading up to 20 May. This represents 13.9% of reported cases, which is an increase from 13.4% in the week leading up to 13 May[24]. However, this number is likely affected by testing changes and this figure may no longer be comparable over time. The proportion of reinfections have increased rapidly since December 2021 and the emergence of the Omicron variant.
While the LFD Universal Offer for asymptomatic testing came to an end on 18 April 2022 in Scotland, 103,956 LFD tests were reported in the week to 22 May. This is a 10% decrease from the week previously (week to 15 May), when 114,918 LFD tests were reported. This compared to a peak of 865,561 tests being reported in the week to 26 December 2021, while the LFD Universal Offer was still in place[25].
The Scottish Contact Survey[26] continues to ask whether people use LFD tests and if so how often. Approximately 40% of individuals had taken at least one lateral flow test within the last 7 days for the survey pertaining to the period 12 May to 18 May, decreasing from 51% two weeks prior[27].
Antimicrobial Resistance and Healthcare Associated Infection Scotland (ARHAI Scotland) provide analyses on hospital onset acquired Covid-19 infections, where patients are likely to have been infected after being admitted to hospital, based on the date when the sample was collected for a first positive Covid-19 test. Cases where the sample was collected before a hospital admission are considered community onset cases, while samples collected on day eight or later are considered nosocomial cases, or cases likely to have been acquired in a hospital setting. For more information, see this ARHAI weekly publication.
According to data from ARHAI Scotland, 96.8% of the 14,210 Covid-19 cases reported in the week ending 1 May 2022 were reported as community onset cases. 180 cases in the same period were reported as nosocomial cases[28]; this is a 33% decrease from the previous week ending 24 April (269 nosocomial cases). The number of nosocomial cases peaked in early-January and again in late-March, and has since been decreasing. The number of cases in all categories of inpatient diagnosed COVID-19 cases have shown similar trends during the same time period, including those diagnosed on day one or two, reflecting the high levels of transmission in the community[29].
In line with recent changes to testing policy and transitions to long term strategies in the four UK nations, cases comparison between countries will no longer be included in the report. For more information see following links for England, Scotland, Wales, and Northern Ireland.
To compare trends in estimated infection levels in private residential households across the UK, please see the previous section on the Covid-19 Infection Survey.