Building standards verification services - performance and workforce: national annual report 2024-2025
Provides an overview of the performance of building standards verification services across Scotland and information on the professional workforce employed by local authorities to provide verification services.
5. Workforce
5.1 Workforce summary
| Workforce Summary | 2023 | 2024 | 2025 |
|---|---|---|---|
| Supply | 598 | 583 | 585 |
| Current Demand | 637 | 630 | 637 |
| Longer term demand (10yrs) | 698 | 714 | 729 |
| Under 40s (Age range 16-39) | 33.6% | 32.3% | 31.8% |
| Age range 40-49 | 19.7% | 21.3% | 21.7% |
| Over 50s (Age range 50-61+) | 46.7% | 46.4% | 46.5% |
| Qualifications being studied | 41 | 43 | 42 |
|
Apprentices (graduate, modern and foundation) |
26 (9 GA, 17 MA) |
27 (14 GA, 13 MA) |
25 (12 GA, 13 MA) |
| Memberships held | 250 | 235 | 217 |
| Leavers (incl. short service) | 40 | 52 | 54 |
| Leavers with short service | 10 | 21 | 11 |
Supply and Demand
- Overall workforce up by 2 compared to 2024.
- Supply increased slightly from 583 in 2024 to 585 in 2025, however this is still lower than the supply in 2023 of 598.
- The current demand has increased by seven, and the longer-term demand has steadily increased over the last three years.
Age Profile
- The age profile has remained broadly similar in the last three years.
- There is a slight drop in the under 40 age range compared to 2024.
- Over 60 range is down by 4 and accounts for 9.6% of the total workforce.
Qualifications, apprenticeships and memberships
- Qualifications being studied and apprenticeship numbers similar to 2024.
- The split in apprenticeships has changed, with more modern apprentices now than graduate apprentices.
- Professional memberships held is down by 18. Worth noting there was also a decrease of 15 between 2023 and 2024.
Leavers
- The number of leavers in 2025 is up by 2, from 52 in 2024 to 54 this year.
- Leavers in the under 40s age range is down from 20 in 2024 to 16 in 2025.
- People leaving to go into another public sector role or the private sector has decreased from 26 in 2024 to 15 in 2025.
- The number of leavers with short service has also decreased, from 21 in 2024 to 11 in 2025.
5.2 Workforce Demand
5.2.1 Overall demand has increased by seven from 2024. See Table 2.
5.2.2 The roles with an increase in demand are Team Leader, Senior Surveyor, Surveyor, Graduate Surveyor, Building Inspector, Technician and Administrator roles. There remains a demand in the medium to longer term for most job roles. See Chart 11.
5.2.3 There has been a drop in demand in the Manager and Assistant Surveyor roles.
| Role | 2023 | 2024 | 2025 | Difference from 2024 (+/-) |
|---|---|---|---|---|
| Manager | 31 | 30 | 28 | -2 |
| Team Leader | 44 | 44 | 45 | +1 |
| Lead Surveyor | 23 | 23 | 23 | 0 |
| Senior Surveyor | 56 | 61 | 62 | +1 |
| Surveyor | 212 | 208 | 210 | +2 |
| Assistant Surveyor | 52 | 50 | 44 | -6 |
| Graduate Surveyor | 17 | 20 | 23 | +3 |
| Building Inspector | 41 | 39 | 43 | +4 |
| Technician | 24 | 22 | 26 | +4 |
| Administrator (dedicated resource) | 39 | 39 | 38 | -1 |
| Administrator (pooled resource) | 70 | 70 | 75 | +5 |
| Other Specialist (structure, fire, etc) | 7 | 7 | 5 | -2 |
| Other Role | 21 | 17 | 15 | -2 |
| Total | 637 | 630 | 637 | +7 |
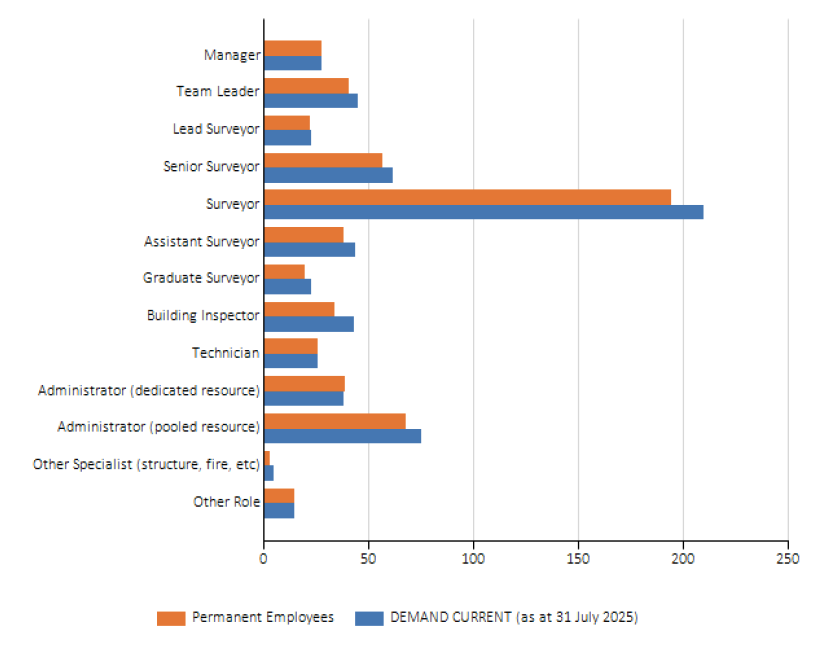
5.3 Workforce Supply
5.3.1 The current number of staff (supply) has increased by 2 (0.3%) from 2024. See Table 3.
5.3.2 There is an increase in the Lead Surveyor, Graduate Surveyor, Building Inspector, Technician and Administrator job roles.
5.3.2 Manager, Senior Surveyor and the Other job roles have remained unchanged and the number of people in Team Leader, Surveyor and Assistant Surveyor roles has decreased.
| Role | 2023 | 2024 | 2025 | Difference from 2024 (+/-) |
|---|---|---|---|---|
| Manager | 31 | 28 | 28 | 0 |
| Team Leader | 40 | 43 | 41 | -2 |
| Lead Surveyor | 21 | 20 | 22 | +2 |
| Senior Surveyor | 55 | 57 | 57 | 0 |
| Surveyor | 198 | 198 | 194 | -4 |
| Assistant Surveyor | 45 | 41 | 38 | -3 |
| Graduate Surveyor | 16 | 18 | 20 | +2 |
| Building Inspector | 35 | 33 | 34 | +1 |
| Technician | 23 | 21 | 26 | +5 |
| Administrator (dedicated resource) | 39 | 38 | 39 | +1 |
| Administrator (pooled resource) | 71 | 67 | 68 | +1 |
| Other Specialist (structure, fire, etc) | 4 | 4 | 3 | -1 |
| Other Role | 20 | 15 | 15 | 0 |
| Total | 598 | 583 | 585 | +2 |
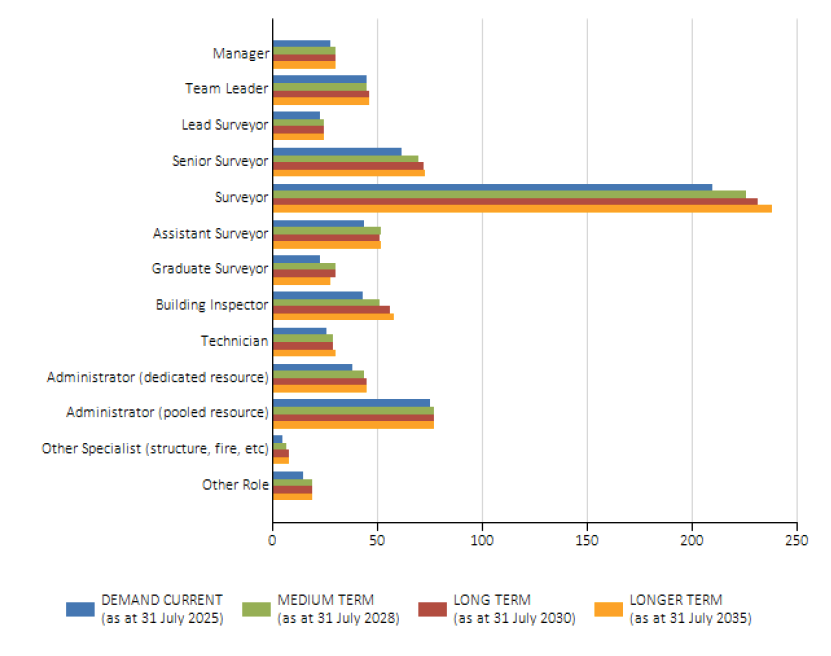
5.4 Supply and Demand – current, medium, long and longer term
5.4.1 There remains demand for staff in most roles in the building standards profession. The gap between supply and demand has increased from 2024 to 2025 and supply remains insufficient to meet levels of future demand. See Table 4 and Chart 12.
5.4.2 The current demand is 637 in 2025, which represents a supply gap of 52 (8.2%) staff. It is estimated that demand will continue to increase by an additional 68 (10.7%) staff by 2028 (medium demand). This represents a shortfall of 120 staff on the current supply level.
5.4.3 The overall level of demand in the next 10 years (2025 to 2035) remains high with 92 new posts required. This represents a shortfall of 144 (19.8%) staff by 2035 if the current supply level remains consistent in the longer term (2035).
| Role | Supply 2025 | Current demand 2025 (+/-) | Medium demand 2028 (change from 2025) (+/-) | Long demand 2030 (change from 2028) (+/-) | Longer demand 2035 (change from 2030) (+/-) | Demand between 2025–2035 (+/-) |
|---|---|---|---|---|---|---|
| Manager | 28 | 28 (0) | 30 (+2) | 30 (0) | 30 (0) | +2 |
| Team Leader | 41 | 45 (+4) | 45 (0) | 46 (+1) | 46 (0) | +1 |
| Lead Surveyor | 22 | 23 (+1) | 25 (+2) | 25 (0) | 25 (0) | +2 |
| Senior Surveyor | 57 | 62 (+5) | 70 (+8) | 72 (+2) | 73 (+1) | +11 |
| Surveyor | 194 | 210 (+16) | 226 (+16) | 231 (+5) | 238 (+7) | +28 |
| Assistant Surveyor | 38 | 44 (+6) | 52 (+8) | 51 (-1) | 52 (+1) | +8 |
| Graduate Surveyor | 20 | 23 (+3) | 30 (+7) | 30 (0) | 28 (-2) | +5 |
| Building Inspector | 34 | 43 (+9) | 51 (+8) | 56 (+5) | 58 (+2) | +15 |
| Technician | 26 | 26 (0) | 29 (+3) | 29 (0) | 30 (+1) | +4 |
| Administrator (dedicated resource) | 39 | 38 (-1) | 44 (+6) | 45 (+1) | 45 (0) | +7 |
| Administrator (pooled resource) | 68 | 75 (+7) | 77 (+2) | 77 (0) | 77 (0) | +2 |
| Other Specialist (structure, fire, etc) | 3 | 5 (+2) | 7 (+2) | 8 (+1) | 8 (0) | +3 |
| Other Role | 15 | 15 (0) | 19 (+4) | 19 (0) | 19 (0) | +4 |
| Total | 585 | 637 (+52) | 705 (+68) | 719 (+14) | 729 (+10) | +92 |
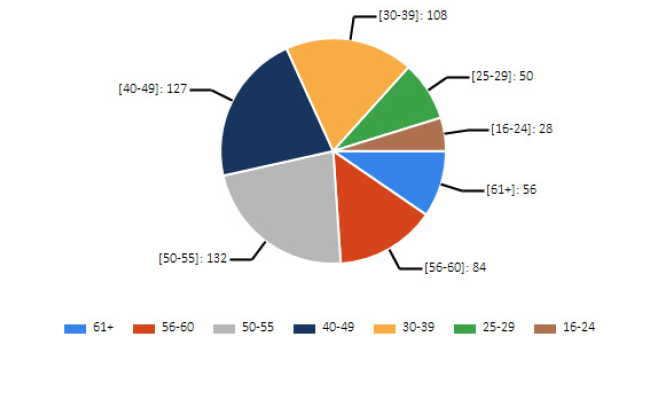
5.5 Age Profile
5.5.1 There is a reduction in the number of staff in all age ranges with the exception of 50-55, 40-49, and 25-29.
5.5.2 There is a notable increase in the 25-29 age range, this has increased by 7 from 43 in 2024 to 50 in 2025 and now accounts for 8.5% of the total workforce. See Table 5.
| Age Range | No. 2023 | No. 2024 | No. 2025 | Difference from 2024 (+/-) | |
|---|---|---|---|---|---|
| 61+ | 46 | 60 | 56 | 140 | -4 |
| 56-60 | 95 | 85 | 84 | -1 | |
| 50-55 | 138 | 126 | 132 | 445 | +6 |
| 40-49 | 118 | 124 | 127 | +3 | |
| 30-39 | 119 | 116 | 108 | -8 | |
| 25-29 | 46 | 43 | 50 | +7 | |
| 16-24 | 36 | 29 | 28 | -1 | |
| Total | 598 | 583 | 585 | - | +2 |
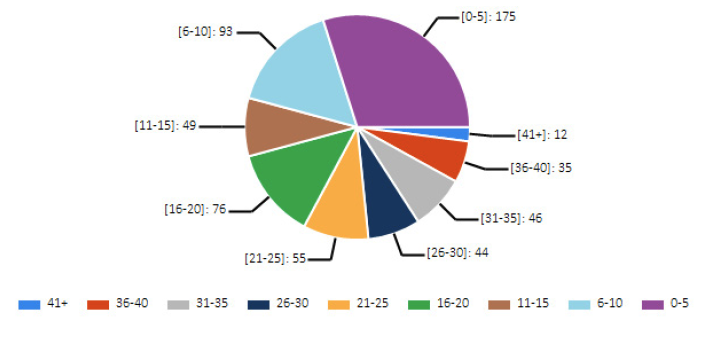
5.6 Length of Service
5.6.1 The percentage of workforce having a length of service 10 years or less is 45.8% of the workforce, which is similar to 2024. See Table 6 and Chart 14.
5.6.2 There has been a slight increase in the number of staff with 21-25 years service and a notable decrease in the number of staff with between 16 and 20 year service from 88 in 2024 to 76 in 2025.
| Year Range | 2023 | 2024 | 2025 | Difference from 2024 (+/-) |
|---|---|---|---|---|
| 41+ | 8 | 11 | 12 | +1 |
| 36-40 | 28 | 39 | 35 | -4 |
| 31-35 | 57 | 48 | 46 | -2 |
| 26-30 | 48 | 44 | 44 | 0 |
| 21-25 | 43 | 41 | 55 | +14 |
| 16-20 | 89 | 88 | 76 | -12 |
| 11-15 | 55 | 52 | 49 | -3 |
| 6-10 | 80 | 92 | 93 | +1 |
| 0-5 | 190 | 168 | 175 | +7 |
| Total | 598 | 583 | 585 | +2 |
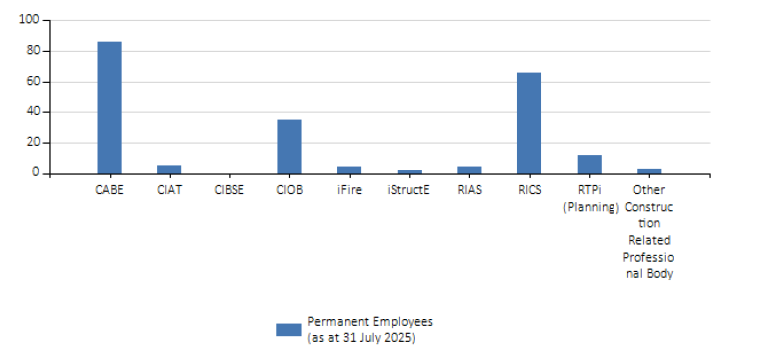
5.7 Professional membership
5.7.1 The number of professional memberships held continues to decline and is down by 18 in 2025. After a slight increase in 2023 to 250, this number has fallen to 217 in 2025. See Table 7 and Chart 15.
5.7.2 The number of RICS memberships continues to fall, from 81 in 2023 to 66 in 2025, around 30% of memberships held. There is also another drop in CABE memberships, down from 93 in 2024 to 86 in 2025.
5.7.3 The only increase is in CIOB memberships, which has increased by 20.7% from 29 to 35.
| Membership | 2023 | 2024 | 2025 | Difference from 2024 (+/-) |
|---|---|---|---|---|
| CABE | 94 | 93 | 86 | -7 |
| CIAT | 4 | 7 | 5 | -2 |
| CIBSE | 0 | 0 | 0 | 0 |
| CIOB | 33 | 29 | 35 | +6 |
| iFire | 5 | 4 | 4 | 0 |
| iStructE | 2 | 2 | 2 | 0 |
| RIAS | 5 | 5 | 4 | -1 |
| RICS | 81 | 77 | 66 | -11 |
| RTPi (Planning) | 17 | 12 | 12 | 0 |
| Other Construction Related Professional Body | 9 | 6 | 3 | -3 |
| Total | 250 | 235 | 217 | -18 |
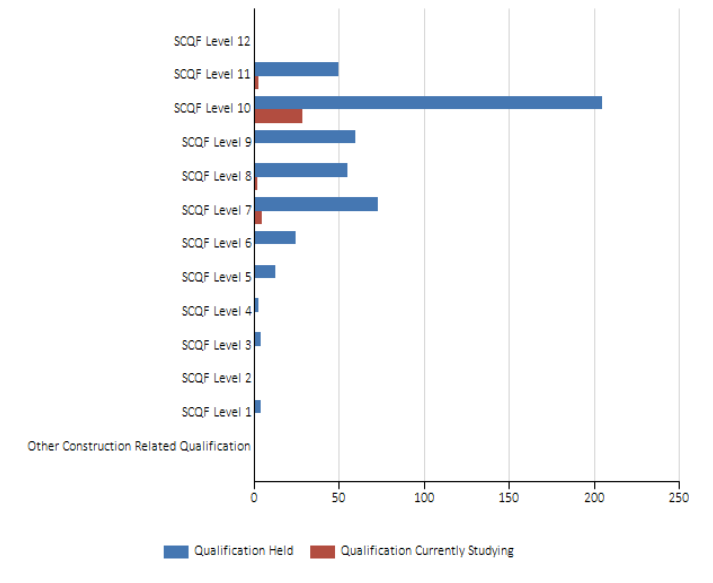
5.8 Qualifications held
5.8.1 The number of qualifications held by staff has decreased by 40 since 2024. See Table 8.
5.8.2 There is a noticeable increase is the Higher National Diploma (level 8) (+8) with increases also seen in National Award level 1, 3, 11 and 12. However, there has been a significant drop in the number of qualifications held at levels 9 (-25) and 10 (-11).
| SCQF Level | Level | SVQs / MAs | 2023 | 2024 | 2025 | Difference from 2024 (+/-) |
|---|---|---|---|---|---|---|
| Level 12 | Doctoral Degree | Professional Apprenticeship | 0 | 0 | 1 | +1 |
| Level 11 | Master’s Degree, Post Graduate | Professional Apprenticeship SVQ 5 | 53 | 47 | 50 | +3 |
| Level 10 | Honours Degree | Professional Apprenticeship | 192 | 216 | 205 | -11 |
| Level 9 | Professional Award, Bachelor Degree | Technical Apprenticeship SVQ 4 | 86 | 85 | 60 | -25 |
| Level 8 | Higher National Diploma | Technical Apprenticeship SVQ 4 | 49 | 47 | 55 | +8 |
| Level 7 | Higher National Certificate | Modern Apprenticeship SVQ 3 | 76 | 80 | 73 | -7 |
| Level 6 | National Award | Modern Apprenticeship Foundation Apprenticeship SVQ 3 | 33 | 31 | 25 | -6 |
| Level 5 | National Award | Modern Apprenticeship SVQ 2 | 12 | 19 | 13 | -6 |
| Level 4 | National Award | SVQ 1 | 3 | 3 | 3 | 0 |
| Level 3 | National Award | N/A | 2 | 1 | 4 | +3 |
| Level 2 | National Award | N/A | 1 | 1 | 0 | -1 |
| Level 1 | National Award | N/A | 4 | 3 | 4 | +1 |
| Other Construction Related Qualification | - | - | 1 | 0 | 0 | 0 |
| Total | - | - | 512 | 533 | 493 | -40 |
5.9 Qualifications – Currently Studying
5.9.1 The number of staff currently studying for a qualification has decreased slightly from 43 in 2024 to 42 in 2025.
5.9.2 The biggest increase can be seen in the Honours degree level, rising from 23 in 2024 to 29 in 2025. See Table 9.
5.9.3 The level which represents the largest percentage of qualifications held (41.6%) and studying (69.0%) is level 10 honours degree. See Tables 8 & 9 and Chart 16.
| SCQF Level | Level | SVQs / MAs | 2023 | 2024 | 2025 | Difference from 2024 (+/-) |
|---|---|---|---|---|---|---|
| Level 12 | Doctoral Degree | Professional Apprenticeship | 0 | 0 | 0 | 0 |
| Level 11 | Master’s Degree, Post Graduate | Professional Apprenticeship SVQ 5 | 2 | 4 | 3 | -1 |
| Level 10 | Honours Degree | Professional Apprenticeship | 22 | 23 | 29 | +6 |
| Level 9 | Professional Award, Bachelor Degree | Technical Apprenticeship SVQ 4 | 2 | 6 | 1 | -5 |
| Level 8 | Higher National Diploma | Technical Apprenticeship SVQ 4 | 2 | 1 | 2 | +1 |
| Level 7 | Higher National Certificate | Modern Apprenticeship SVQ 3 | 10 | 5 | 5 | 0 |
| Level 6 | National Award | Modern Apprenticeship Foundation Apprenticeship SVQ 3 | 0 | 2 | 0 | -2 |
| Level 5 | National Award | Modern Apprenticeship SVQ 2 | 1 | 1 | 1 | 0 |
| Level 4 | National Award | SVQ 1 | 1 | 0 | 1 | +1 |
| Level 3 | National Award | N/A | 0 | 1 | 0 | -1 |
| Level 2 | National Award | N/A | 0 | 0 | 0 | 0 |
| Level 1 | National Award | N/A | 1 | 0 | 0 | 0 |
| Total | - | - | 41 | 43 | 42 | -1 |
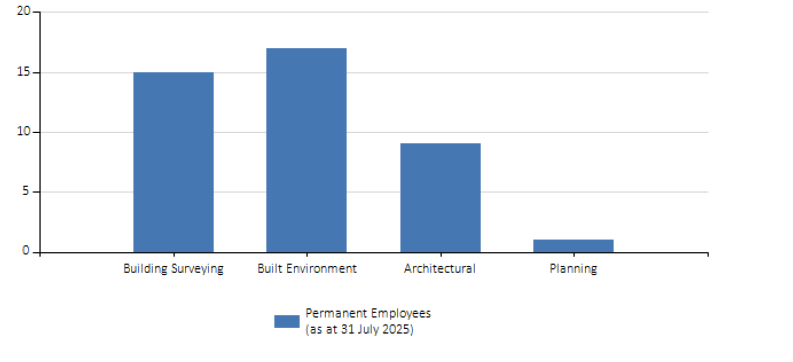
5.10 Types of qualifications currently being studied
5.10.1 The most popular qualification type being studied is Built Environment, accounting for 40.5%.
5.10.2 The number studying Building Surveying has seen a marked decreased from 24 in 2024 to 15 in 2025. See Table 10 and Chart 17.
| Currently Studying Qualification Type | 2023 | 2024 | 2025 | Difference from 2024 (+/-) |
|---|---|---|---|---|
| Building Surveying | 17 | 24 | 15 | -9 |
| Built Environment | 11 | 9 | 17 | +8 |
| Fire Engineering | 3 | 2 | 0 | -2 |
| Engineering | 0 | 0 | 0 | 0 |
| Construction Management | 0 | 0 | 0 | 0 |
| Quantity Surveying | 0 | 0 | 0 | 0 |
| Architectural | 7 | 7 | 9 | +2 |
| Planning | 0 | 0 | 1 | +1 |
| Other Construction Related Qualification | 3 | 1 | 0 | -1 |
| Total | 41 | 43 | 42 | -1 |
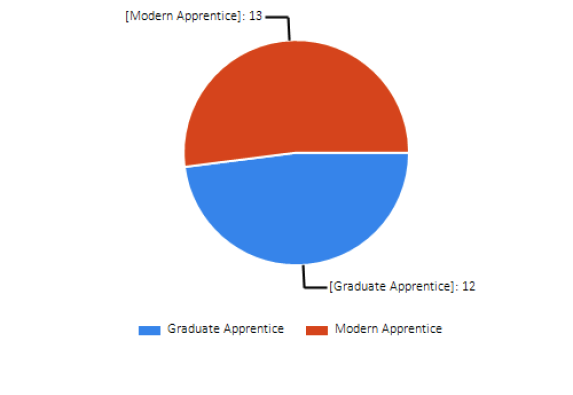
5.11 Apprenticeships
5.11.1 The number of apprenticeships has decreased by 2 since 2024. See Table 11.
5.11.2 The split in apprenticeships has changed, with more Modern Apprentices (13) than Graduate Apprentices (12).
5.11.3 There are currently no Foundation Apprentices in the workforce.
| Apprenticeship Level | 2023 | 2024 | 2025 | Role as % of total employees | Role as % of total currently studying level |
|---|---|---|---|---|---|
| Graduate Apprentice | 9 (-4) | 14 (+5) | 12(-2) | 2.01% | 28.57% |
| Modern Apprentice | 17 (+11) | 13 (-4) | 13 (0) | 2.17% | 30.95% |
| Foundation Apprentice | 0 (-1) | 0 (0) | 0 (0) | 0.00% | 0.00% |
| Total | 26 (+6) | 27 (+1) | 25 (-2) | 4.18% | 59.52% |
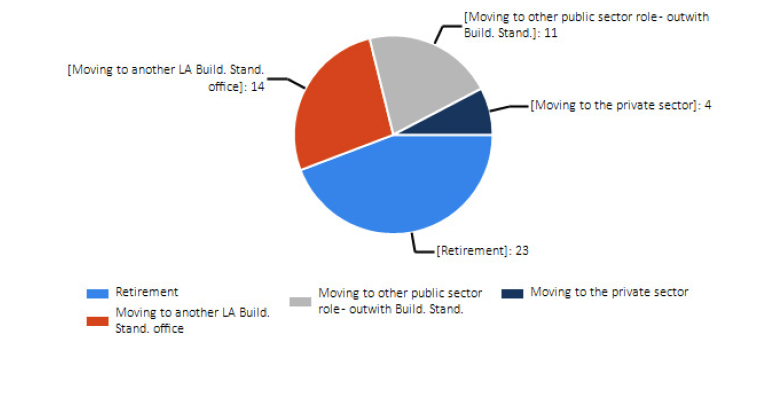
5.12 Staff moving within or leaving the profession by reason
5.12.1 The number of staff moving within or leaving the profession in 2025 with a given reason is 52 which is an increase of 2 from 2024 to 2025.
5.12.2 The reasons include retirement (23), a public sector role outside the profession (11) and a move into the private sector (4). Those moving to another local authority building standards office (14) are recorded as leavers in this data even though these staff have not left the profession. See Table 12.
5.12.3 The number of staff leaving to go into the private sector has decreased significantly from eleven in 2024 to 4 in 2025.
5.12.4 An additional two staff left the profession in 2025 but no reason was given and therefore are not reflected in the table below.
| Reason | 2023 | 2024 | 2024 | Difference from 2024 (+/-) |
|---|---|---|---|---|
| Retirement | 17 | 12 | 23 | +11 |
| Local Authority Building Standards Office | 10 | 12 | 14 | +2 |
| Public sector role – out with Building Standards | 4 | 15 | 11 | -4 |
| Private Sector | 4 | 11 | 4 | -7 |
| Total | 35 | 50 | 52 | +2 |
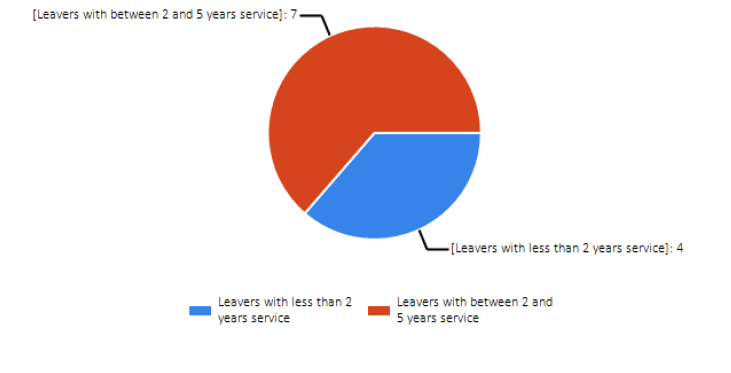
5.13 Leavers with short service
5.13.1 The number of staff leaving the profession with short service has decreased significantly by 10, from 21 in 2024 to 11 in 2025. Notably the majority (7) are those in the range 2 to 5 years service.
| Permanent employee leavers with short service | 2023 | 2024 | 2025 | Difference from 2024 (+/-) |
|---|---|---|---|---|
| Leavers with less than 2 years service | 3 | 13 | 4 | -9 |
| Leavers with between 2 and 5 years service | 7 | 8 | 7 | -1 |
| Total | 10 | 21 | 11 | -10 |
Contact
Email: buildingstandards@gov.scot