Attainment Scotland Fund evaluation: fifth interim report - year 6
This report focuses on the Year 6 (2020 to 2021) evaluation of Attainment Scotland Fund (ASF) across Pupil Equity Funding (PEF), Challenge Authority and Schools Programme Funding streams.
Chapter 5 Long-term Outcomes: Contribution to improvement and reduction of the poverty-related attainment gap
Chapter 5 highlights
Quantitative data on attainment and wellbeing
- The analysis of quantitative data on attainment and wellbeing shows some positive signs in closing the attainment gap but the impact of the pandemic on children and young peoples' learning is clear, and it is a varied picture on progress depending on the measure under consideration.
- This is illustrated by data from Achievement of Curriculum for Excellence Levels (ACEL) in primary schools, where the proportion of pupils achieving expected levels in both literacy and numeracy increased steadily until 2020/21, including a period of school building closures, when these figures decreased and the gap between pupils from most and least deprived areas widened.
- Data on school leaver attainment (SCQF levels) shows a clearer picture in terms of positive trends, although these figures are affected by the changed SQA approach to certification as a result of the pandemic, which affects comparability. The proportion of school leavers attaining one pass or more increased in 2020/21, while the gap between school leavers from the most and least deprived areas reduced.
- Measures of participation and positive destinations are consistently positive, with the proportion of 16-19 year olds participating in education, training or employment (the 'Participation Measure'), increasing year on year with the exception of a slight drop in 2019, and reaching its highest ever levels in 2021. The participation gap between those living in the most deprived areas and those in the least deprived areas continues to show narrowing year on year. Looking specifically at the participation rate in the Challenge Authorities, all nine authorities recorded an increase between 2016 and 2021.
Reported evidence of impact
- Perceptions of progress towards closing the poverty-related attainment gap were identified at both local authority and school level.
- At the local authority level, the majority of local authorities responding to the 2021 Survey perceived they had seen improvement towards closing the poverty-related attainment gap over the 2020/21 year as a result of ASF although there were clear indications of the impact of COVID-19.
- At the school level, of 597 headteachers responding to the 2021 Headteacher Survey:
- 87% reported seeing an improvement in closing the poverty-related attainment gap as a result of ASF supported approaches in the previous year and 94% expected to see improvements over the next few years;
- 94% of headteachers in receipt of Challenge Authority or Schools Programme funding, in addition to PEF, reported seeing an improvement specifically as a result of PEF.
- COVID-19 emerged as the key factor influencing perceptions of progress towards closing the poverty-related attainment gap.
- A number of factors were associated with schools' experiences and positive perceptions of progress were identified: change of culture or ethos (such as embedding the approach to equity); tailoring use of ASF to local needs; effective use of data and evidence; and engagement with families and communities.
- Sustained and embedded practices as a result of the fund included: staff skills and capacity; developing capacity to use evidence to inform approaches/embedding use of evidence; developing whole school approaches to equity; and embedding approaches to achieving equity.
- Staffing levels and the potential loss of skills should staffing levels reduce were seen as barriers to sustainability.
- Continuation of funding was the primary factor associated with ensuring sustainability of focus on equity. Other factors identified included: ongoing professional learning; continued focus on understanding the challenges associated with poverty for children and their families; focus on data and evidence; creating a culture of embedding sustainable approaches; and a focus on collaboration.
5.1 This chapter explores evidence around improvement in attainment and health and wellbeing, and the gap between pupils from the most and least deprived areas. Evidence of impact draws on both analysis of quantitative data on attainment and wellbeing, based on agreed measures for monitoring progress on closing the poverty-related attainment gap, and on reported impacts from ASF survey evidence.
5.2 The first section provides analysis of quantitative data on attainment and wellbeing based on the measures for monitoring progress on closing the poverty-related attainment gap as set out in the National Improvement Framework. For 2020/21 Achievement of the Curriculum for Excellence (ACEL) data was collected for Primary school (P1, P4 and P7) pupils only. Secondary school and special school data was not collected due to other pressures on these schools including implementation of the SQA National Qualifications Alternative Certification Model which was used to award National 5s, Highers and Advanced Highers in 2021. For health and wellbeing data, the impact of COVID-19 on data collection means there is no update available for 2020/21 for the Total Difficulties Score and the Mental Wellbeing score (SALSUS/WEMWBS). The current available data was reported on in the ASF Year 5 Report (2019/20).
5.3 The second section explores reported impact provided by local authorities and schools, based primarily on survey data drawn from the Headteacher Survey 2021 and the Local Authority Survey 2021. This is followed by consideration of evidence around sustainability.
Evidence of impact: attainment and wellbeing
5.4 Evidence of impact draws on analysis of quantitative data on attainment and wellbeing based on the agreed measures for monitoring progress towards closing the poverty-related attainment gap set out in the National Improvement Framework. This sets out a basket of key measures and sub-measures to assess progress. The measures with available data for this (and previous) reporting periods are shown in Table 5.1 below.
| Pre ASF 2014/15 | Year 1 (2015/16) | Year 2 (2016/17) | Year 3 (2017/18) | Year 4 (2018/19) | Year 5 (2019/20) | Year 6 (2020/21) | |||
|---|---|---|---|---|---|---|---|---|---|
| Attainment | Achievement of Curriculum for Excellence Levels | P1, P4 and P7 S3 | ✓ | ✓ | ✓ | ✓ (P1,P4,P7 only) | |||
| School leaver attainment in National Qualifications – SCQF Level 5 and 6 or better* | School leavers | ✓ | ✓ | ✓ | ✓ | ✓ | ✓ | ||
| Annual Participation Measure | 16-19 year olds | ✓ | ✓ | ✓ | ✓ | ✓ | |||
| Health & Wellbeing | Attendance rates | Primary, Secondary | ✓ | ✓ | ✓ | ✓ | |||
| Exclusion rates | Primary, Secondary | ✓ | ✓ | ✓ | ✓ | ||||
| Total difficulties score | Primary, Secondary | ✓ | ✓ | ✓ | ✓ | ||||
| Mental Wellbeing Score (SALSUS) | Primary, Secondary | ✓ | ✓ | ✓ |
* Level 4 is not included within the attainment related measures – see Evaluation Strategy for Year 3 and 4 Table 2.1.
5.5 All of the measures are available at both Scotland and local authority level. Patterns of attainment in Challenge Authorities, who have been involved with ASF since 2015[13], and non-Challenge Authorities are outlined in this analysis.
5.6 To address the research questions, each of the measures outlined in the above table are considered in terms of:
- Overall attainment
- Attainment for pupils from most and least deprived SIMD quintiles
- Percentage point gap between the most and least deprived
5.7 In addition, data for the following groups will be shown:
- Each of the nine Challenge Authorities and Challenge Authority total
- Non-Challenge Authorities
- Scotland Level
5.8 It is important to note that the evaluation is retrospective, in that data reported has been collected for the previous year. Whilst the refreshed SAC Programme has an allocation to all 32 local authorities through the Strategic Equity Fund, given that this report is focused on a retrospective evaluation of 2020/21 the consideration of NIF measures focuses on the funding structure that was previously in place for the SAC Programme i.e. nine Challenge Authorities and the Schools Programme.
Primary school attainment
5.9 The attainment of primary pupils (P1, P4 and P7 pupils combined) for literacy and numeracy is outlined below, based on analysis of Achievement of Curriculum for Excellence (CfE) Levels 2020/21 data. When considering the data it is important to note that the Scottish Government did not collect Achievement of CfE Levels data for any pupils in 2019/20; schools were closed in Scotland between March 2020 and the end of the academic year as a result of the COVID-19 pandemic meaning that they were closed on the planned ACEL census date of 8th June 2020. It was concluded that it would not be possible to collect consistent data that was fit for purpose and that any attempt to do so would add considerably to other pressures on school and education authority staff. The decision was therefore taken to suspend the data collection. For 2020/21 data was collected for Primary school (P1, P4 and P7) pupils only. Secondary school and special school data was not collected due to other pressures on these schools including implementation of the SQA National Qualifications Alternative Certification Model which was used to award National 5s, Highers and Advanced Highers in 2021.
5.10 In terms of primary school pupils' literacy and numeracy performance, Table 5.2 presents data for Challenge Authorities (Challenge Authorities combined and Scotland overall), from 2016/17 to 2020/21. As Table 5.2 shows, the proportion of primary pupils achieving the expected level in literacy steadily increased until 2020/21 where it decreased.
- In Challenge Authorities, the proportion increased from 67.5 per cent in 2016/17 to 69.1 per cent in 2017/18, and 70.8 per cent in 2018/19, dropping to 65.1 percent in 2020/21.
- Over the same period of time, there has been a similar pattern in non-Challenge Authorities (70.1 per cent in 2016/17 to 73.0 per cent in 2018/19, 67.7 percent in 2020/21) and Scotland overall (69.2 per cent in 2016/17 to 72.3 per cent in 2018/19 and 66.9 per cent in 2020/21).
For numeracy the proportion of primary pupils achieving the expected level steadily increased until 2020/21 where it decreased:
- In Challenge Authorities the proportion increased from 74.8 per cent in 2016/17, to 76.8 per cent in 2017/18, 78.2 per cent in 2018/19 before decreasing to 73.5 per cent in 2020/21. A similar pattern was seen in Scotland overall (76.4 per cent in 2016/17 to 79.1 per cent in 2018/19 and 74.7 per cent in 2020/21).
- There was also an increase in non-Challenge Authorities between 2016/17 and 2018/19 followed by a decrease in 2020/21 (77.1 per cent in 2016/17 to 79.5 per cent in 2018/19 and 75.2 per cent in 2020/21).
| Local Authority | Literacy | Numeracy | ||||||||
|---|---|---|---|---|---|---|---|---|---|---|
| 2016/17 | 2017/18 | 2018/19 | 2020/21 | Percentage point change between 2016/17 and 2020/21 | 2016/17 | 2017/18 | 2018/19 | 2020/21 | Percentage point change between 2016/17 and 2020/21 | |
| Clackmannanshire | 56.8 | 72.1 | 71.2 | 59.6 | 2.8 | 64.0 | 77.0 | 76.8 | 68.6 | 4.6 |
| Dundee | 64.6 | 65.5 | 71.8 | 68.0 | 3.4 | 70.2 | 73.8 | 77.7 | 76.8 | 6.6 |
| East Ayrshire | 61.3 | 58.6 | 65.0 | 52.4 | -8.9 | 67.3 | 68.0 | 72.5 | 61.7 | -5.7 |
| Glasgow | 68.4 | 68.8 | 68.9 | 65.5 | -2.9 | 76.8 | 77.8 | 77.1 | 73.4 | -3.5 |
| Inverclyde | 72.3 | 73.5 | 75.7 | 67.9 | -4.4 | 79.0 | 80.0 | 82.2 | 74.5 | -4.5 |
| North Ayrshire | 69.5 | 72.4 | 73.8 | 58.6 | -10.9 | 77.2 | 79.5 | 79.4 | 67.4 | -9.8 |
| North Lanarkshire | 67.6 | 69.0 | 71.1 | 68.6 | 1.0 | 74.0 | 75.8 | 78.7 | 76.1 | 2.1 |
| Renfrewshire | 72.7 | 76.4 | 76.1 | 69.6 | -3.1 | 79.7 | 82.8 | 83.7 | 80.2 | 0.5 |
| West Dunbartonshire | 63.7 | 66.8 | 68.2 | 62.4 | -1.3 | 72.1 | 74.0 | 76.2 | 71.8 | -0.3 |
| Challenge Authorities | 67.5 | 69.1 | 70.8 | 65.1 | -2.4 | 74.8 | 76.8 | 78.2 | 73.5 | -1.3 |
| Non-Challenge | 70.1 | 72.5 | 73.0 | 67.7 | -2.4 | 77.1 | 79.1 | 79.5 | 75.2 | -1.8 |
| Scotland | 69.2 | 71.4 | 72.3 | 66.9 | -2.4 | 76.4 | 78.4 | 79.1 | 74.7 | -1.7 |
The robustness and consistency of these statistics have increased over time. This should be kept in mind when making comparisons between years.
Secondary school and special school data were not collected for 2020/21 and data was not collected for any pupils in 2019/20.
5.11 Tables 5.3 and 5.4 below show the size of the gap between the proportion of primary pupils (P1, P4 and P7 pupils combined) from the most and least deprived areas that have achieved the expected level in literacy and numeracy.
For literacy:
- For Challenge Authorities overall, the gap in literacy fluctuated between 2016/17 and 2020/21.
- At Scotland level, the gap narrowed between 2016/17 and 2018/19 and widened again in 2020/21 to 24.7 per cent.
- The literacy attainment gap for non-Challenge Authorities decreased year on year before widening to 27.0 per cent in 2020/21.
For numeracy:
- The gap widened slightly for Challenge Authorities each year with the largest increase between 2018/19 and 2020/21.
- Similarly, at Scotland level the gap reduced between 2016/17 to 2018/19 before widening again in 2020/21.
- For non-Challenge Authorities the numeracy attainment gap fluctuated between 2016/17 and 2018/19 before increasing to 23.4 per cent in 2020/21.
| Most deprived (bottom 20% SIMD) | Least deprived (top 20% SIMD) | Percentage point gap | ||||||||||
|---|---|---|---|---|---|---|---|---|---|---|---|---|
| 2016/17 | 2017/18 | 2018/19 | 2020/21 | 2016/17 | 2017/18 | 2018/19 | 2020/21 | 20/1617 | 20/1718 | 20/1819 | 2020/21 | |
| Clackmannanshire | 47.5 | 63.3 | 62.4 | 53.3 | 65.3 | 78.4 | 84.8 | 73.9 | 17.8 | 15.0 | 22.4 | 20.7 |
| Dundee | 58.1 | 58.9 | 65.5 | 61.6 | 75.0 | 79.8 | 84.5 | 82.0 | 16.9 | 20.8 | 19.2 | 20.4 |
| East Ayrshire | 49.8 | 47.4 | 54.6 | 42.3 | 77.1 | 77.1 | 77.2 | 72.4 | 27.3 | 29.7 | 22.6 | 30.1 |
| Glasgow | 64.1 | 64.5 | 64.5 | 60.7 | 86.5 | 84.9 | 85.4 | 85.8 | 22.3 | 20.3 | 20.9 | 25.1 |
| Inverclyde | 64.8 | 62.6 | 67.4 | 55.0 | 86.4 | 88.9 | 88.1 | 82.6 | 21.6 | 26.3 | 20.7 | 27.5 |
| North Ayrshire | 62.6 | 65.5 | 67.6 | 49.2 | 82.1 | 83.2 | 89.6 | 70.7 | 19.5 | 17.6 | 22.0 | 21.5 |
| North Lanarkshire | 57.7 | 59.8 | 63.0 | 59.9 | 78.2 | 83.1 | 81.7 | 82.3 | 20.5 | 23.3 | 18.7 | 22.4 |
| Renfrewshire | 62.7 | 67.6 | 66.2 | 56.2 | 84.6 | 85.6 | 86.7 | 84.8 | 21.9 | 18.1 | 20.4 | 28.5 |
| West Dunbartonshire | 59.2 | 60.3 | 62.2 | 56.5 | 71.8 | 81.4 | 75 | 74.4 | 12.5 | 21.1 | 12.8 | 17.9 |
| Challenge Authorities | 61.0 | 62.2 | 64.1 | 57.6 | 80.8 | 83.1 | 84.3 | 81.5 | 19.8 | 20.9 | 20.2 | 23.9 |
| Non-Challenge Authorities | 56.8 | 60.7 | 61.4 | 53.5 | 81.5 | 83.3 | 83.6 | 80.5 | 24.7 | 22.6 | 22.2 | 27.0 |
| Scotland | 59.3 | 61.6 | 63.1 | 56.0 | 81.4 | 83.3 | 83.7 | 80.7 | 22.1 | 21.6 | 20.7 | 24.7 |
The robustness and consistency of these statistics have increased over time. This should be kept in mind when making comparisons between years. Secondary school and special school data were not collected for 2020/21 and data was not collected for any pupils in 2019/20.
| Most deprived (bottom 20% SIMD) | Least deprived (top 20% SIMD) | Percentage point gap | ||||||||||
|---|---|---|---|---|---|---|---|---|---|---|---|---|
| 2016/17 | 2017/18 | 2018/19 | 2020/21 | 2016/17 | 2017/18 | 2018/19 | 2020/21 | 2016/17 | 2017/18 | 2018/19 | 2020/21 | |
| Clackmannanshire | 51.9 | 69.1 | 68.2 | 64.3 | 75.3 | 81.8 | 85.9 | 77.3 | 23.4 | 12.7 | 17.7 | 13.0 |
| Dundee | 65.7 | 68.7 | 71.8 | 71.0 | 76.6 | 85.3 | 88.0 | 88.2 | 10.9 | 16.6 | 16.2 | 17.3 |
| East Ayrshire | 56.8 | 58.8 | 62.7 | 50.1 | 78.4 | 81.7 | 84.1 | 80.6 | 21.6 | 22.8 | 21.4 | 30.5 |
| Glasgow | 74.0 | 75.0 | 73.7 | 69.6 | 91.4 | 88.9 | 88.6 | 88.0 | 17.4 | 13.9 | 14.9 | 18.4 |
| Inverclyde | 70.4 | 70.7 | 75.7 | 62.9 | 91.5 | 94.5 | 93.2 | 91.4 | 21.0 | 23.8 | 17.5 | 28.6 |
| North Ayrshire | 72.4 | 74.7 | 74.5 | 58.4 | 84.7 | 88.6 | 91.6 | 82.0 | 12.3 | 13.9 | 17.1 | 23.6 |
| North Lanarkshire | 66.0 | 68.3 | 72.2 | 67.6 | 85.0 | 87.8 | 87.2 | 88.3 | 18.9 | 19.4 | 15.0 | 20.7 |
| Renfrewshire | 70.3 | 75.0 | 75.7 | 68.3 | 89.4 | 90.4 | 92.9 | 91.6 | 19.1 | 15.4 | 17.3 | 23.3 |
| West Dunbartonshire | 68.0 | 67.4 | 71.1 | 65.2 | 83.1 | 87.6 | 88.0 | 82.0 | 15.1 | 20.3 | 16.9 | 16.7 |
| Challenge Authorities | 68.7 | 71.7 | 72.7 | 66.5 | 85.5 | 87.9 | 89.1 | 87.6 | 15.8 | 16.2 | 16.4 | 21.0 |
| Non-Challenge Authorities | 67.3 | 69.8 | 70.1 | 62.8 | 86.4 | 87.7 | 88.4 | 86.2 | 19.2 | 17.9 | 18.3 | 23.4 |
| Scotland | 68.7 | 70.9 | 71.7 | 65.0 | 86.3 | 87.7 | 88.5 | 86.5 | 17.6 | 16.8 | 16.8 | 21.4 |
The robustness and consistency of these statistics have increased over time. This should be kept in mind when making comparisons between years. Secondary school and special school data were not collected for 2020/21 and data was not collected for any pupils in 2019/20.
School leaver attainment: percentage of school leavers achieving awards by Scottish Credit and Qualifications Framework (SCQF) level
5.12 The attainment of school leavers in Scotland is based on the Summary Statistics for Attainment and Initial Leaver Destinations, No. 4: 2022 Edition published 22 February 2022.
5.13 When considering the school leaver attainment data it is important to be aware of the underlying National Qualification certification. The coronavirus (COVID-19) pandemic led to the cancellation of 2020 and 2021 National 5 (SCQF Level 5), Higher (SCQF Level 6) and Advanced Higher (SCQF Level 7) external assessment and exams and alternative approaches were taken to determine attainment. This will have affected the attainment of many 2019/20 and 2020/21 school leavers.
5.14 A dashed line break in the series has been placed between 2018/19 and 2019/20. This indicates that care must be taken when comparing attainment of school leavers in 2018/19 and before, with that of school leavers in 2019/20 and beyond. In addition, care should also be taken when comparing the attainment of 2019/20 and 2020/21 school leavers.
5.15 Interpretation of changes must take full account of the different certification methods used in different years, and changes in the attainment levels in 2019/20 and 2020/21 should not be seen as an indication that performance has improved or worsened, without further evidence.
5.16 This section will consider the proportion of school leavers attaining one or more pass at SCQF Level 5 to 7 or better in Challenge Authorities (combined), non-Challenge Authorities (combined) and Scotland overall, from 2016/17 to 2020/21.
5.17 As seen in Table 5.5:
- The proportion of school leavers attaining one pass or more at SCQF Level 5 or better for Challenge Authorities (combined) has generally shown a downward trend until 2019/20 and 2020/21.
- Similarly, at Scotland level there was a slight decrease year on year from 2016/17 to 2018/19 before increasing in 2019/20 and 2020/21.
- Non-Challenge Authorities saw fluctuations with an increase in 2017/18, a slight decrease 2018/19 before increasing again in 2019/20 and 2020/21.
| 2016/17 | 2017/18 | 2018/19 | 2019/20 | 2020/21 | |
|---|---|---|---|---|---|
| Clackmannanshire | 79.4 | 76.1 | 78.8 | 77.1 | 84.7 |
| Dundee | 82.7 | 76.8 | 78.8 | 80.1 | 81.9 |
| East Ayrshire | 83.4 | 82.4 | 80.0 | 83.0 | 85.0 |
| Glasgow | 83.2 | 83.8 | 83.2 | 82.0 | 85.5 |
| Inverclyde | 88.9 | 89.1 | 89.5 | 89.3 | 91.7 |
| North Ayrshire | 84.7 | 86.2 | 83.3 | 89.4 | 87.3 |
| North Lanarkshire | 85.5 | 85.2 | 84.4 | 85.2 | 87.1 |
| Renfrewshire | 88.3 | 88.2 | 88.2 | 89.7 | 92.3 |
| West Dunbartonshire | 87.9 | 83.1 | 85.6 | 85.6 | 85.9 |
| Challenge Authorities | 84.8 | 84.2 | 83.7 | 84.2 | 86.7 |
| Non-Challenge Authorities | 86.6 | 86.7 | 85.6 | 86.4 | 88.1 |
| Scotland | 86.1 | 85.9 | 85.1 | 85.7 | 87.7 |
Note: A dashed line break has been placed between the attainment figures for 2018/19 and 2019/20 school leavers reflecting the impact of the change to the assessment approach in 2020 and 2021 on 2019/20 and 2020/21 school leaver attainment. It indicates that care must be taken when comparing attainment of school leavers in 2018/19 and before, with that of school leavers in 2019/20 and beyond. In addition, care should also be taken when comparing the attainment of 2019/20 and 2020/21 school leavers.
5.18 Table 5.6 shows the proportion of school leavers attaining one or more pass at SCQF Level 6 or better has seen a similar trend across Challenge Authorities (combined), and Scotland overall, from 2016/17 to 2020/21; there has been a general upward trend with the exception of a drop in 2018/19.
| 2016/17 | 2017/18 | 2018/19 | 2019/20 | 2020/21 | |
|---|---|---|---|---|---|
| Clackmannanshire | 53.5 | 49.7 | 54.4 | 53.2 | 60.5 |
| Dundee | 58.1 | 48.9 | 53.6 | 58.0 | 56.2 |
| East Ayrshire | 58.4 | 60.5 | 58.1 | 59.2 | 60.3 |
| Glasgow | 55.9 | 59.6 | 58.5 | 60.6 | 64.3 |
| Inverclyde | 64.8 | 68.0 | 67.4 | 70.3 | 70.6 |
| North Ayrshire | 57.6 | 59.9 | 56.6 | 61.4 | 64.3 |
| North Lanarkshire | 59.3 | 60.7 | 59.0 | 63.5 | 64.7 |
| Renfrewshire | 65.6 | 65.7 | 63.1 | 66.5 | 73.1 |
| West Dunbartonshire | 64.2 | 57.6 | 58.1 | 59.9 | 62.2 |
| Challenge Authorities | 59.1 | 59.8 | 58.7 | 61.9 | 64.5 |
| Non-Challenge Authorities | 62.1 | 63.1 | 61.3 | 64.7 | 66.6 |
| Scotland | 61.2 | 62.2 | 60.5 | 63.9 | 66.0 |
Note: A dashed line break has been placed between the attainment figures for 2018/19 and 2019/20 school leavers reflecting the impact of the change to the assessment approach in 2020 and 2021 on 2019/20 and 2020/21 school leaver attainment. It indicates that care must be taken when comparing attainment of school leavers in 2018/19 and before, with that of school leavers in 2019/20 and beyond. In addition, care should also be taken when comparing the attainment of 2019/20 and 2020/21 school leavers.
5.19 As seen in Table 5.7, from 2016/17 to 2020/21, the proportion of school leavers attaining one or more passes at SCQF Level 7 for Challenge Authorities (combined), non-Challenge authorities (combined) and Scotland have shown a general upward trend with the exception of a drop in 2018/19.
| 2016/17 | 2017/18 | 2018/19 | 2019/20 | 2020/21 | |
|---|---|---|---|---|---|
| Clackmannanshire | 13.9 | 14.9 | 19.1 | 19.1 | 25.3 |
| Dundee | 15.9 | 12.8 | 14.4 | 20.6 | 18.2 |
| East Ayrshire | 15.0 | 16.9 | 15.4 | 15.7 | 18.5 |
| Glasgow | 13.7 | 15.0 | 13.7 | 17.4 | 18.3 |
| Inverclyde | 19.1 | 19.1 | 17.9 | 22.4 | 23.7 |
| North Ayrshire | 17.1 | 17.5 | 15.5 | 21.7 | 20.6 |
| North Lanarkshire | 13.9 | 15.2 | 12.3 | 17.3 | 14.9 |
| Renfrewshire | 19.2 | 19.3 | 20.6 | 21.6 | 25.8 |
| West Dunbartonshire | 16.9 | 14.8 | 14.3 | 19.2 | 21.1 |
| Challenge Authorities | 15.4 | 15.9 | 14.8 | 18.7 | 19.1 |
| Non-Challenge Authorities | 21.0 | 22.0 | 20.9 | 25.1 | 26.4 |
| Scotland | 19.3 | 20.2 | 19.1 | 23.2 | 24.2 |
Note: A dashed line break has been placed between the attainment figures for 2018/19 and 2019/20 school leavers reflecting the impact of the change to the assessment approach in 2020 and 2021 on 2019/20 and 2020/21 school leaver attainment. It indicates that care must be taken when comparing attainment of school leavers in 2018/19 and before, with that of school leavers in 2019/20 and beyond. In addition, care should also be taken when comparing the attainment of 2019/20 and 2020/21 school leavers.
5.20 At SCQF Level 5 or better (Table 5.8), the percentage point gap between the proportion of school leavers from the most and least deprived areas attaining one or more pass has reduced for Challenge Authorities, non-Challenge Authorities and at Scotland level between 2019/20 and 2020/21.
5.21 The gap at SCQF Level 5 widened for Challenge Authorities (combined) from 2016/17 to 2017/18 (18.3 to 18.8 percentage points) before decreasing again slightly in 2018/19 (18.5 percentage points) widening to 19.4 percentage points in 2019/20 and reducing to 17.3 percentage points in 2020/21. A similar pattern is seen at Scotland level.
5.22 In non-Challenge authorities (combined), the gap at SCQF Level 5 has increased slightly year on year between 2016/17 and 2019/20 from 21.7 percentage points in 2016/17, to 22.7 percentage points in 2017/18, 22.9 percentage points in 2018/19 and 23.2 percentage points in 2019/20 before reducing to 21.2 percentage points in 2020/21.
5.23 At SCQF Level 6 or better (Table 5.9), the gap between the proportion of school leavers from the most and least deprived areas that have attained one pass or more narrowed across Challenge Authorities (combined) every year between 2016/17 and 2020/21. The gap declined steadily from 2016/17 (37.9 percentage points), 2017/18 (36.3 percentage points), 2018/19 (35.2 percentage points) to 2019/20 (35.1 percentage points), reducing again to 32.4 per cent in 2020/21. At Scotland level there was a similar pattern between 2016/17 and 2018/19: the gap narrowed slightly each year from 2016/17 to 2018/19 but widened slightly in 2019/20 before reducing again to 34.4 per cent in 2020/21.
5.24 The gap at SCQF Level 6 widened in non-Challenge Authorities (combined) from 2016/17 to 2017/18 (40.3 to 41.1 percentage points), and subsequently decreased in 2018/19 (39.6 percentage points) and again in 2019/20 (39.5 percentage points) and in 2020/21 (38.6 per cent).
5.25 At SCQF Level 7 (table 5.10), across Challenge Authorities, non-Challenge Authorities and Scotland in 2020/21 there has been a slight increase in the gap from the 2019/20 figures.
5.26 The gap at SCQF Level 7 (Table 5.10) narrowed for Challenge Authorities (combined) from 2016/17 to 2017/18 (20.9 to 20.4 percentage points), and decreased again in 2018/19 (18.8 percentage points), rising to 23.4 percentage points in 2019/20 and rising again to 24/9 percentage points in 2020/21. A similar pattern was seen at Scotland level between 2017/18 and 2020/21. In non-Challenge Authorities (combined), the gap widened very slightly from 26.5 percentage points in 2016/17, to 26.6 percent in 2017/18 before narrowing to 24.3 percentage points in 2018/19 before increasing to 28.6 percentage points in 2019/20 and increasing again to 29.9 per cent in 2020/21.
5.27 The time period covered by these statistics means that the results will be affected by the coronavirus (COVID-19) pandemic. In particular, the cancellation of exams and external assessment of coursework in 2020, and the use of the Alternative Certification Model in 2021, will have affected the attainment of many 2019/20 and 2020/21 school leavers.
| Most deprived (bottom 20% SIMD) | Least deprived (top 20% SIMD) | Percentage point gap | |||||||||||||
|---|---|---|---|---|---|---|---|---|---|---|---|---|---|---|---|
| 2016/17 | 2017/18 | 2018/19 | 2019/20 | 2020/21 | 2016/17 | 2017/18 | 2018/19 | 2019/20 | 2020/21 | 2016/17 | 2017/18 | 2018/19 | 2019/20 | 2020/21 | |
| Clackmannanshire | 63.6 | 64.0 | 64.2 | 60.1 | 74.1 | 96.6 | 95.0 | 94.5 | * | * | 33.0 | 31.0 | 30.4 | * | * |
| Dundee | 71.7 | 65.0 | 68.0 | 67.4 | 73.8 | 94.8 | 93.0 | 93.5 | 92.1 | 95.1 | 23.2 | 28.0 | 25.4 | 24.7 | 21.3 |
| East Ayrshire | 72.1 | 69.9 | 64.7 | 71.8 | 77.9 | 96.6 | 94.5 | 96.2 | 95.7 | * | 24.5 | 24.6 | 31.6 | 23.8 | * |
| Glasgow | 79.6 | 79.3 | 79.4 | 78.0 | 81.2 | 93.8 | 94.9 | 94.8 | 95.3 | * | 14.2 | 15.5 | 15.4 | 17.2 | * |
| Inverclyde | 83.6 | 83.4 | 82.3 | 83.6 | 87.6 | 94.9 | 95.4 | 96.3 | * | * | 11.4 | 12.0 | 14.1 | * | * |
| North Ayrshire | 76.1 | 79.8 | 74.6 | 77.0 | 81.1 | 96.1 | 97.7 | 95.5 | 95.3 | 95.7 | 20.0 | 17.9 | 20.9 | 18.3 | 14.7 |
| North Lanarkshire | 76.5 | 74.7 | 75.2 | 73.7 | 79.5 | 96.1 | 95.9 | 93.4 | 95.3 | 97.2 | 19.6 | 21.2 | 18.2 | 21.6 | 17.7 |
| Renfrewshire | 75.2 | 79.5 | 79.5 | 79.4 | 80.1 | 96.0 | 96.8 | 95.5 | 97.8 | 98.1 | 20.9 | 17.3 | 16.0 | 18.4 | 18.0 |
| West Dunbartonshire | 80.7 | 77.4 | 80.4 | 78.3 | 78.0 | 98.1 | 95.6 | 94.2 | * | * | 17.4 | 18.2 | 13.8 | * | * |
| Challenge Authorities | 77.3 | 76.7 | 76.2 | 76.1 | 80.1 | 95.6 | 95.5 | 94.7 | 95.5 | 97.3 | 18.3 | 18.8 | 18.5 | 19.4 | 17.3 |
| Non-Challenge Authorities | 72.8 | 72.6 | 71.6 | 72.0 | 74.6 | 94.6 | 95.3 | 94.5 | 95.2 | 95.9 | 21.7 | 22.7 | 22.9 | 23.2 | 21.2 |
| Scotland | 75.5 | 75.0 | 74.4 | 74.5 | 77.9 | 94.8 | 95.4 | 94.6 | 95.3 | 96.1 | 19.3 | 20.3 | 20.2 | 20.8 | 18.2 |
Note: A dashed line break has been placed between the attainment figures for 2018/19 and 2019/20 school leavers reflecting the impact of the change to the assessment approach in 2020 and 2021 on 2019/20 and 2020/21 school leaver attainment. It indicates that care must be taken when comparing attainment of school leavers in 2018/19 and before, with that of school leavers in 2019/20 and beyond. In addition, care should also be taken when comparing the attainment of 2019/20 and 2020/21 school leavers.
| Most deprived (bottom 20% SIMD) | Least deprived (top 20% SIMD) | Percentage point gap | |||||||||||||
|---|---|---|---|---|---|---|---|---|---|---|---|---|---|---|---|
| 2016/17 | 2017/18 | 2018/19 | 2019/20 | 2020/21 | 2016/17 | 2017/18 | 2018/19 | 2019/20 | 2020/21 | 2016/17 | 2017/18 | 2018/19 | 2019/20 | 2020/21 | |
| Clackmannanshire | 36.4 | 33.6 | 36.6 | 36.2 | 43.5 | 77.6 | 77.5 | 76.4 | 79.6 | 74.1 | 41.2 | 43.9 | 39.8 | 43.4 | 30.6 |
| Dundee | 42.3 | 33.3 | 39.0 | 39.3 | 41.3 | 82.0 | 75.5 | 75.7 | 81.8 | 80.5 | 39.7 | 42.2 | 36.7 | 42.4 | 39.2 |
| East Ayrshire | 38.2 | 45.3 | 39.5 | 41.6 | 50.6 | 84.2 | 82.8 | 80.6 | 82.0 | 83.7 | 46.0 | 37.5 | 41.2 | 40.4 | 33.1 |
| Glasgow | 48.6 | 51.3 | 51.7 | 52.7 | 55.4 | 82.2 | 87.4 | 83.3 | 84.5 | 91.7 | 33.6 | 36.1 | 31.6 | 31.9 | 36.3 |
| Inverclyde | 47.9 | 53.8 | 53.6 | 58.8 | 59.5 | 83.5 | 89.7 | 85.4 | 87.5 | 87.1 | 35.7 | 35.8 | 31.8 | 28.7 | 27.6 |
| North Ayrshire | 40.3 | 46.0 | 43.2 | 46.7 | 54.2 | 83.8 | 86.3 | 81.8 | 79.8 | 81.6 | 43.5 | 40.2 | 38.6 | 33.1 | 27.4 |
| North Lanarkshire | 43.5 | 45.0 | 42.7 | 48.7 | 50.6 | 82.8 | 83.1 | 83.2 | 84.6 | 82.1 | 39.3 | 38.1 | 40.5 | 36.0 | 31.6 |
| Renfrewshire | 41.0 | 47.9 | 43.6 | 46.6 | 51.5 | 84.1 | 84.4 | 82.1 | 87.7 | 86.6 | 43.1 | 36.4 | 38.5 | 41.1 | 35.1 |
| West Dunbartonshire | 53.2 | 46.9 | 46.8 | 48.3 | 48.9 | 88.5 | 80.0 | 88.5 | 84.6 | 85.3 | 35.3 | 33.1 | 41.6 | 36.3 | 36.4 |
| Challenge Authorities | 45.2 | 47.2 | 46.5 | 49.1 | 52.4 | 83.1 | 83.5 | 81.7 | 84.2 | 84.8 | 37.9 | 36.3 | 35.2 | 35.1 | 32.4 |
| Non-Challenge Authorities | 39.6 | 40.3 | 39.1 | 42.8 | 45.0 | 79.9 | 81.4 | 78.7 | 82.3 | 83.6 | 40.3 | 41.1 | 39.6 | 39.5 | 38.6 |
| Scotland | 43.0 | 44.4 | 43.5 | 46.6 | 49.5 | 80.6 | 81.8 | 79.3 | 82.7 | 83.9 | 37.6 | 37.4 | 35.8 | 36.1 | 34.4 |
Note: A dashed line break has been placed between the attainment figures for 2018/19 and 2019/20 school leavers reflecting the impact of the change to the assessment approach in 2020 and 2021 on 2019/20 and 2020/21 school leaver attainment. It indicates that care must be taken when comparing attainment of school leavers in 2018/19 and before, with that of school leavers in 2019/20 and beyond. In addition, care should also be taken when comparing the attainment of 2019/20 and 2020/21 school leavers.
| Most deprived (bottom 20% SIMD) | Least deprived (top 20% SIMD) | Percentage point gap | |||||||||||||
|---|---|---|---|---|---|---|---|---|---|---|---|---|---|---|---|
| 2016/17 | 2017/18 | 2018/19 | 2019/20 | 2020/21 | 2016/17 | 2017/18 | 2018/19 | 2019/20 | 2020/21 | 2016/17 | 2017/18 | 2018/19 | 2019/20 | 2020/21 | |
| Clackmannanshire | 9.3 | 6.4 | 9.0 | 10.1 | 13.9 | 22.4 | 22.5 | 30.9 | 35.2 | 38.9 | 13.1 | 16.1 | 22.0 | 25.0 | 25.0 |
| Dundee | 7.7 | 7.5 | 8.4 | 10.7 | 10.9 | 27.0 | 18.0 | 19.6 | 36.4 | 38.0 | 19.3 | 10.5 | 11.2 | 25.8 | 27.2 |
| East Ayrshire | 6.4 | 8.6 | 7.3 | 8.7 | 12.1 | 25.4 | 29.7 | 27.4 | 27.3 | 32.5 | 19.0 | 21.1 | 20.1 | 18.7 | 20.4 |
| Glasgow | 9.3 | 10.4 | 9.0 | 12.1 | 12.2 | 34.2 | 34.8 | 29.6 | 39.1 | 46.7 | 24.9 | 24.4 | 20.6 | 26.9 | 34.5 |
| Inverclyde | 8.8 | 9.6 | 7.2 | 14.8 | 15.5 | 34.2 | 37.9 | 34.1 | 40.9 | 39.8 | 25.4 | 28.3 | 27.0 | 26.1 | 24.3 |
| North Ayrshire | 9.9 | 9.0 | 7.8 | 13.6 | 13.3 | 31.2 | 35.9 | 27.3 | 31.8 | 33.3 | 21.3 | 26.9 | 19.5 | 18.2 | 20.0 |
| North Lanarkshire | 8.0 | 8.1 | 8.1 | 10.6 | 8.6 | 26.6 | 24.8 | 21.1 | 35.1 | 28.6 | 18.6 | 16.8 | 13.0 | 24.5 | 19.9 |
| Renfrewshire | 9.6 | 9.9 | 10.4 | 11.1 | 13.9 | 31.8 | 33.7 | 33.2 | 34.7 | 38.7 | 22.3 | 23.8 | 22.9 | 23.6 | 24.8 |
| West Dunbartonshire | 11.9 | 10.6 | 7.9 | 13.6 | 14.4 | 38.5 | 31.1 | 34.6 | 35.9 | 36.8 | 26.6 | 20.5 | 26.7 | 22.3 | 22.4 |
| Challenge Authorities | 9.0 | 9.4 | 8.5 | 11.8 | 12.0 | 29.8 | 29.8 | 27.4 | 35.2 | 36.8 | 20.9 | 20.4 | 18.8 | 23.4 | 24.9 |
| Non-Challenge Authorities | 8.0 | 8.8 | 8.8 | 11.4 | 11.9 | 34.5 | 35.3 | 33.1 | 40.0 | 41.8 | 26.5 | 26.6 | 24.3 | 28.6 | 29.9 |
| Scotland | 8.6 | 9.1 | 8.7 | 11.7 | 12.0 | 33.8 | 34.7 | 32.4 | 39.5 | 41.2 | 25.3 | 25.5 | 23.7 | 27.8 | 29.2 |
Note: A dashed line break has been placed between the attainment figures for 2018/19 and 2019/20 school leavers reflecting the impact of the change to the assessment approach in 2020 and 2021 on 2019/20 and 2020/21 school leaver attainment. It indicates that care must be taken when comparing attainment of school leavers in 2018/19 and before, with that of school leavers in 2019/20 and beyond. In addition, care should also be taken when comparing the attainment of 2019/20 and 2020/21 school leavers
Annual Participation Measure
5.28 The Annual Participation Measure (APM) is a measure for considering progress in closing the poverty-related attainment gap, as set out in the National Improvement Framework. Since August 2017 the APM has been the source of the National Performance Framework Indicator, 'Percentage of young adults (16-19 year olds) participating in education, training or employment'. It is produced by Skills Development Scotland (SDS) using a shared data set to report on the economic and employment activity of the wider 16-19 year old cohort, including those at school. A range of partners contribute to the shared dataset, including Local Authorities (schools), colleges, the Department of Work and Pensions (DWP) and SAAS. It allows all partners to better understand the impact of interventions and the outcomes they deliver at every transition point for 16-19 year olds.
5.29 When considering the APM as a measure in the ASF Evaluation it is important to highlight that the ASF funding started in 2015, therefore a lag occurs between intervention at school level and impact on APM (mostly post school). The APM is also measured from 1st April - 31st March, as opposed to the academic year considered in the ASF evaluation. As such the figures are not considered across a directly comparable time period.
5.30 This section reports on the participation rate for Scotland overall and at local authority level. For school pupils, local authority relates to the location of the school they are attending. For those who have left school local authority continues to relate to location of their school up to 12 months after leaving, and thereafter the individual is reported against the local authority linked to their postcode.
5.31 All local authority level data disaggregated by SIMD is available online; the focus in this report is specifically on the Challenge Authorities, who have been involved with the ASF for the longest period of time.
5.32 Table 5.11 below shows the proportion of 16-19 year olds participating in education, training or employment was 92.2% in 2021 which represents an increase of 0.1 percentage points compared to 92.1% in 2020 and is the highest rate since the inception of the APM. Previous figures showed a slight increase year on year from 90.4 percentage points in 2016, 91.1 percentage points in 2017, 91.8 percentage points in 2018, decreasing slighting in 2019 to 91.6 percentage points.
5.33 The participation gap between those who lived in the 20% most deprived areas and those in the 20% least deprived areas continues to show narrowing with a gap of 9.3 percentage points in 2021 (compared to 12.9 percentage points in 2016, 11.5 percentage points in 2017, 10.8 percentage points in 2018, 10.5 percentage points in 2019 and 9.9 percentage points in 2020).
5.34 Looking specifically at the participation rate in the Challenge Authorities (Table 5.11), all nine authorities recorded an increase between 2016 and 2021, however North Ayrshire Council's participation rate reduced slightly by 0.5 percentage points between 2020 and 2021.
| Participation rate | Percentage point change between 2016 and 2021 | ||||||
|---|---|---|---|---|---|---|---|
| 2016 | 2017 | 2018 | 2019 | 2020 | 2021 | ||
| Clackmannanshire | 88.2 | 89.7 | 89.3 | 90.1 | 89.3 | 90 | 1.8 |
| Dundee | 87.7 | 87.6 | 88.7 | 88.2 | 90 | 89.9 | 2.2 |
| East Ayrshire | 89.3 | 88.1 | 89.3 | 88.7 | 90 | 91 | 1.7 |
| Glasgow | 86.8 | 88.2 | 88.8 | 89.2 | 89.5 | 90.5 | 3.7 |
| Inverclyde | 91.2 | 91.9 | 91.6 | 91.8 | 92.9 | 93.3 | 2.1 |
| North Ayrshire | 89.9 | 90.3 | 91.1 | 90.5 | 90.6 | 90.1 | 0.2 |
| North Lanarkshire | 89.3 | 90.2 | 90.5 | 90.1 | 90.7 | 91.5 | 2.2 |
| Renfrewshire | 90.7 | 91.4 | 91.6 | 91.7 | 92.4 | 93 | 2.3 |
| West Dunbartonshire | 88.4 | 88.3 | 90.1 | 90.3 | 90.2 | 90.8 | 2.4 |
| Challenge Authorities | 89 | 89.3 | 89.9 | 89.9 | 90.6 | 91.1 | 2.1 |
| Non-Challenge Authorities | 92 | 91.9 | 92.8 | 92.4 | 93.5 | 93.2 | 1.2 |
| Scotland | 90.4 | 91.1 | 91.8 | 91.6 | 92.1 | 92.2 | 1.8 |
Source: Annual Participation Measure, Skills Development Scotland
5.35 At Scotland level, as shown in Table 5.12, between Year 4 (2019) and 5 (2020) of the ASF, there was an overall reduction in the participation gap between those living in the most deprived areas compared to those living in the least deprived areas (9.9 percentage points in 2020, 10.5 percentage points in 2019, 10.8 percentage points in 2018, 11.5 percentage points in 2017). Between 2020-2021 the participation rate increased for those living in the least deprived areas (86.6 percentage points in 2020 to 87.1 percentage points in 2021), but decreased slightly for those living in the least deprived areas (96.5 percentage points in 2020 to 96.4 percentage points in 2021). With regards Challenge Authorities Table 5.12 shows the following:
- In Year 6 of the ASF (2021), four Challenge Authorities had a smaller or similar participation gap compared to Scotland.
- Between Year 5 and 6 of the ASF, the participation gap narrowed in six Challenge Authorities.
- In Year 6 of the ASF, the participation rate for those living in the 20% most deprived areas was higher in three Challenge Authorities, compared to Scotland.
- Between Year 5 and 6 of the ASF, the participation rate for those living in the 20% most deprived areas increased or was maintained in eight Challenge Authorities - an increase from six in 2020.
| Most deprived (bottom 20% SIMD) | Least deprived (top 20% SIMD) | Gap Percentage points | ||||||||||||||||
|---|---|---|---|---|---|---|---|---|---|---|---|---|---|---|---|---|---|---|
| 2016 | 2017 | 2018 | 2019 | 2020 | 2021 | 2016 | 2017 | 2018 | 2019 | 2020 | 2021 | 2016 | 2017 | 2018 | 2019 | 2020 | 2021 | |
| Clackmannanshire | 79.1 | 82.0 | 81.6 | 84.5 | 83.9 | 85.9 | 97 | 95.6 | 93.9 | 96.6 | 96.3 | 94.8 | 17.9 | 13.6 | 12.3 | 12.1 | 12.4 | 8.9 |
| Dundee | 81.1 | 82.4 | 82.9 | 83.4 | 85.4 | 85.5 | 97.3 | 96.2 | 95.6 | 96 | 96.2 | 97 | 16.2 | 13.8 | 12.7 | 12.6 | 10.8 | 11.5 |
| East Ayrshire | 83.2 | 82.7 | 83 | 83.1 | 84.8 | 86 | 95.6 | 94.2 | 97.2 | 96.2 | 96.3 | 97.3 | 12.4 | 11.5 | 14.1 | 13.1 | 11.5 | 11.3 |
| Glasgow | 84.4 | 85.5 | 86.1 | 86.3 | 86.8 | 88.4 | 95.2 | 96.3 | 96.1 | 95.5 | 95.6 | 96.2 | 10.8 | 10.9 | 10.0 | 9.2 | 8.8 | 7.8 |
| Inverclyde | 86.9 | 88.2 | 87.4 | 88.3 | 89.9 | 90.8 | 97.2 | 96.4 | 96.3 | 96.3 | 96.3 | 97.6 | 10.3 | 8.2 | 8.9 | 8.1* | 6.4 | 6.8 |
| North Ayrshire | 85.6 | 85.9 | 87.6 | 87.8 | 86.9 | 85.3 | 97.7 | 97.5 | 96.4 | 94.7 | 96.7 | 96.1 | 12.1 | 11.6 | 8.8 | 6.9 | 9.8 | 10.8 |
| North Lanarkshire | 83.1 | 85.0 | 85.6 | 84.3 | 85.9 | 87 | 96.6 | 96.2 | 95.8 | 96.7 | 96.5 | 96.5 | 13.5 | 11.2 | 10.2 | 12.4 | 10.6 | 9.5 |
| Renfrewshire | 83.6 | 85.5 | 86.6 | 85.1 | 87.3 | 87.9 | 96.9 | 96.5 | 96.9 | 97.3 | 97.6 | 97.6 | 13,3 | 11.0 | 10.3 | 12.1* | 10.3 | 9.7 |
| West Dunbartonshire | 83.7 | 84.8 | 85.7 | 85.7 | 85.4 | 86.9 | 98.4 | 95.5 | 96.9 | 98.9 | 95.3 | 95.5 | 14.7 | 10.7 | 11.2 | 13.2 | 9.9 | 8.6 |
| Scotland | 83.3 | 84.8 | 85.7 | 85.8 | 86.6 | 87.1 | 96.2 | 96.3 | 96.5 | 96.3 | 96.5 | 96.4 | 12.9 | 11.5 | 10.8 | 10.5 | 9.9 | 9.3 |
Source: Annual Participation Measure, Skills Development Scotland (SDS). Note that 2016-19 APM uses the SIMD 2016 whereas the 2020 APM uses the SIMD 2020.
The Annual Participation Measure report may refer to a percentage point (pp) increase or decrease, which means the absolute change between two percentages e.g., the proportion of 16-19 year olds participating increased by x pp. These have been calculated using unrounded percentages. Calculating percentage point differences from the data presented in the report may differ slightly from figures cited in the text, due to rounding. Similarly, percentages within the report may not sum to 100%, due to rounding.
Health and wellbeing
5.36 This section reports on two health and wellbeing related measures: attendance and exclusions rates.
5.37 Information on attendance and exclusion from schools is collected on a biennial basis. In the first interim report, data was analysed for 2014/15 – the year prior to the ASF. In this section, consideration is given to how these figures changed between Years 1- 6 of the ASF. It is important to note that policy around exclusions changed in 2017 following Scottish Government guidance and this has resulted in a reduction in exclusions. As a result of this some local authority figures have been suppressed in the official statistics, so as not to be disclosive. It is therefore difficult to draw conclusions from the exclusions data.
5.38 During 2020/21 there was disruption to school attendance caused by the COVID-19 pandemic. This included:
- pupils being absent after testing positive for COVID-19 or when required to self-isolate
- school closures following local outbreaks or when there were COVID-19 related staff absences
- the closure of most school buildings between January and April 2021
5.39 During periods where school buildings were closed to pupils, education continued via home-learning for the majority of pupils. For those vulnerable pupils who would benefit from being in school, and for children of key workers, provision was made to allow them to attend school buildings. To account for these changed circumstances, new attendance and absence codes were made available to schools to allow them to capture COVID-19 related absence and home learning provision. Due to the fast pace of their introduction, it was anticipated that use of these codes may be inconsistent between different schools and local authorities.
5.40 Some of these expected inconsistencies were evident during the preparation of these statistics alongside evidence that the usage of the new codes varied over the course of the year within individual schools and authorities, including underreporting of absence from home learning. This should be borne in mind when interpreting these statistics.
5.41 There was a particularly notable decrease in exclusion between 2018/19 and 2020/21, with cases of exclusion falling 44%. This decrease is partly attributable to the COVID-19 pandemic, with many local authorities citing the lower amount of time spent in school as a reason for the reduction in their case numbers.
Attendance rates
5.42 Figure 5.13 shows the attendance levels for primary and secondary schools, by deprivation and by year.
5.43 As the attendance data shows, pupils from the most deprived areas had lower attendance rates; this pattern was more prominent in secondary schools.
5.44 The gap in attendance rates gradually increased over time for primary school children. The attendance of pupils from the least deprived areas remained fairly stable over time, especially in primary schools. The attendance rate of the most deprived pupils decreased in 2020/21.
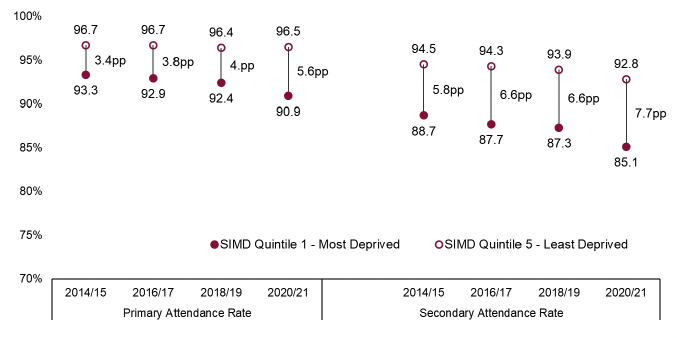
Source: Summary Statistics for Schools, Scottish Government
5.45 Table 5.14 below shows attendance rates for primary pupils, disaggregated by deprivation and Challenge Authority.
| Primary attendance rates | Most deprived (bottom 20% SIMD) % | Least deprived (top 20% SIMD) % | Gap Percentage points | |||||||||
|---|---|---|---|---|---|---|---|---|---|---|---|---|
| 2014/15 | 2016/17 | 2018/19 | 2020/21 | 2014/15 | 2016/17 | 2018/19 | 2020/21 | 2014/15 | 2016/17 | 2018/19 | 2020/21 | |
| Clackmannanshire | 93.4 | 93.7 | 93.1 | c | 96.1 | 96.2 | 95.8 | c | 2.7 | 2.5 | 2.7 | c |
| Dundee City | 93.3 | 92.9 | 92.6 | 91.3 | 96.5 | 96.6 | 96.2 | 96.4 | 3.2 | 3.7 | 3.6 | 5.1 |
| East Ayrshire | 93.8 | 93.6 | 92.4 | 91.0 | 96.5 | 96.6 | 96.0 | 96.3 | 2.7 | 3.0 | 3.6 | 5.3 |
| Glasgow City | 93.1 | 92.8 | 92.3 | 90.2 | 96.8 | 96.5 | 96.4 | 96.2 | 3.7 | 3.7 | 4.0 | 6.0 |
| Inverclyde | 93.3 | 93.2 | 93.1 | 92.8 | 96.9 | 96.3 | 96.0 | 96.5 | 3.6 | 3.1 | 2.9 | 3.7 |
| North Ayrshire | 94.2 | 93.5 | 93.0 | 91.9 | 96.3 | 96.7 | 96.5 | 95.9 | 2.1 | 3.2 | 3.5 | 4.0 |
| North Lanarkshire | 92.8 | 92.3 | 91.9 | 90.2 | 96.7 | 96.5 | 96.4 | 95.8 | 3.9 | 4.2 | 4.5 | 5.6 |
| Renfrewshire | 94.2 | 94.0 | 93.3 | 92.2 | 97.1 | 96.8 | 96.7 | 96.9 | 2.9 | 2.8 | 3.4 | 4.7 |
| West Dunbartonshire | 94.0 | 93.3 | 93.2 | 91.6 | 97.1 | 96.5 | 96.5 | 96.4 | 3.1 | 3.2 | 3.3 | 4.8 |
| Scotland | 93.3 | 92.9 | 92.4 | 90.9 | 96.7 | 96.7 | 96.4 | 96.5 | 3.4 | 3.8 | 4.0 | 5.6 |
Source: Summary Statistics for Schools, Scottish Government
c = suppression due to small numbers
5.46 In relation to the gap in attendance rates for primary pupils:
- In Year 6 of the ASF, six Challenge Authorities had a smaller gap compared to Scotland;
- Between 2014/15 (pre-ASF) and Year 6, the gap widened in eight Challenge Authorities.
5.47 The attendance rate for primary pupils from the least deprived areas was fairly consistent across Challenge Authorities (around 96-97%).
5.48 Attendance rates for primary pupils in the most deprived areas was somewhat more varied. In 2020/21, the attendance rate of pupils from the most deprived areas was higher or similar in six Challenge Authorities compared to Scotland overall (down from 8 in Year 4).
5.49 Table 5.15 below shows the attendance rates for secondary pupils, disaggregated by deprivation and Challenge Authority.
| Secondary attendance rates | Most deprived (bottom 20% SIMD) % | Least deprived (top 20% SIMD) % | Gap Percentage points | |||||||||
|---|---|---|---|---|---|---|---|---|---|---|---|---|
| 2014/15 | 2016/17 | 2018/19 | 2020/21 | 2014/15 | 2016/17 | 2018/19 | 2020/21 | 2014/15 | 2016/17 | 2018/19 | 2020/21 | |
| Clackmannanshire | 88.2 | 86.8 | 88.9 | 89.7 | 94.0 | 94.4 | 94.0 | 94.5 | 5.8 | 7.6 | 5.1 | 4.8 |
| Dundee City | 87.3 | 87.1 | 86.4 | 83.4 | 93.7 | 93.9 | 93.5 | 92.5 | 6.4 | 6.8 | 7.1 | 9.1 |
| East Ayrshire | 87.7 | 87.0 | 86.0 | 82.7 | 94.5 | 93.9 | 93.3 | 92.9 | 6.8 | 6.9 | 7.3 | 10.2 |
| Glasgow City | 90.1 | 89.6 | 89.4 | 87.1 | 95.1 | 95.0 | 94.9 | 94.8 | 5.0 | 5.4 | 5.5 | 7.6 |
| Inverclyde | 88.7 | 87.7 | 87.7 | 88.1 | 94.5 | 94.3 | 92.8 | 92.5 | 5.8 | 6.6 | 5.1 | 4.4 |
| North Ayrshire | 89.1 | 87.5 | 87.6 | 86.8 | 93.9 | 93.0 | 92.6 | 91.9 | 4.8 | 5.5 | 5 | 5.1 |
| North Lanarkshire | 87.8 | 85.3 | 84.2 | 82.1 | 94.5 | 92.7 | 92.2 | 90.1 | 6.7 | 7.4 | 8 | 8.1 |
| Renfrewshire | 87.5 | 87.1 | 86.8 | 83.2 | 93.7 | 93.4 | 93.3 | 91.6 | 6.2 | 6.3 | 6.5 | 8.3 |
| West Dunbartonshire | 87.3 | 86.1 | 86.2 | 83.6 | 93.4 | 92.6 | 92.7 | 90.3 | 5.3 | 6.5 | 6.5 | 6.7 |
| Scotland | 88.7 | 87.7 | 87.3 | 85.1 | 94.5 | 94.3 | 93.9 | 92.8 | 5.8 | 6.6 | 6.6 | 7.7 |
Source: Summary Statistics for Schools, Scottish Government
c = suppression due to small numbers
5.50 In relation to the gap in attendance rates for secondary pupils:
- In Year 6 of the ASF, five Challenge Authorities had a smaller gap compared to Scotland;
- From the year prior to ASF (2014/15) to Year 6 of the ASF, the gap between attendance rates in the most deprived and the least deprived areas narrowed in two Challenge Authorities.
Exclusion rates
5.51 Full details on exclusion rates disaggregated by local authority and SIMD are available on the National Improvement Framework Interactive Evidence Report.
5.52 In terms of the exclusion rates for Challenge Authorities, by deprivation and year, it is not possible to offer a full analysis of the gap in relation to exclusion rates due to disclosure control.
5.53 Overall, exclusion rates were higher for pupils from the most deprived areas compared to those from the least deprived.
5.54 From the year prior to ASF (2014/15) to Year 2 of the ASF (2016/17), the primary exclusion rate for pupils from the most deprived areas decreased for 4 Challenge Authorities (table 5.16).
| Primary exclusion rates per 1000 pupils | Most deprived (bottom 20% SIMD) % | Least deprived (top 20% SIMD) % | Gap Percentage points | |||||||||
|---|---|---|---|---|---|---|---|---|---|---|---|---|
| 2014/15 | 2016/17 | 2018/19 | 2020/21 | 2014/15 | 2016/17 | 2018/19 | 2020/21 | 2014/15 | 2016/17 | 2018/19 | 2020/21 | |
| Clackmannanshire | 68.0 | 48.5 | c | 0.0 | 5.7 | c | 0.0 | 0.0 | 62.3 | z | z | z |
| Dundee City | 29.9 | 20.4 | 9.0 | 4.7 | 2.1 | c | 7.7 | c | 27.8 | z | 1.3 | z |
| East Ayrshire | 54.2 | 52 | 37.2 | 9.4 | 3.8 | c | 0.0 | c | 50.4 | z | 37.2 | z |
| Glasgow City | 12.8 | 18.3 | 6.3 | 2.3 | 3.5 | 4.0 | c | c | 9.3 | 14.3 | z | z |
| Inverclyde | 3.9 | 3.1 | c | c | 0.0 | c | c | c | 3.9 | z | z | z |
| North Ayrshire | 8.8 | 9.1 | 10.8 | 3.0 | 0.0 | c | c | 0.0 | 8.8 | 9.1 | 10.8 | z |
| North Lanarkshire | 17.7 | 19.8 | 18.8 | 8.7 | 1.9 | 3.0 | c | c | 15.8 | 16.8 | z | z |
| Renfrewshire | 5.3 | 16.9 | 11.8 | 7.8 | 0.4 | 0.0 | c | c | 4.9 | 16.9 | 11.8 | z |
| West Dunbartonshire | 13.8 | 22.7 | 16.5 | 7.1 | 0.0 | 0.0 | 0.0 | 0.0 | 13.8 | 22.7 | 16.5 | z |
| Scotland | 19.0 | 22.0 | 14.4 | 6.5 | 2.1 | 3.0 | 2.36 | 1.0 | 16.9 | 19 | 12.0 | 5.5 |
Source: Summary Statistics for Schools, Scottish Government
c= suppression due to small numbers
z = unable to calculate figure due to suppression
5.55 Table 5.17 shows the secondary exclusion rates for Challenge Authorities, by deprivation and year. The gap in secondary exclusion rates narrowed in 5 of the 8 Challenge Authorities between 2014/15 and 2016/17. Due to suppression of the figures we cannot fully analyse the gap for year 6.
| Secondary exclusion rates per 1000 pupils | Most deprived (bottom 20% SIMD) % | Least deprived (top 20% SIMD) % | Gap Percentage points | |||||||||
|---|---|---|---|---|---|---|---|---|---|---|---|---|
| 2014/15 | 2016/17 | 2018/19 | 2020/21 | 2014/15 | 2016/17 | 2018/19 | 2020/21 | 2014/15 | 2016/17 | 2018/19 | 2020/21 | |
| Clackmannanshire | 110.3 | 42 | c | 0.0 | 36.7 | 24.1 | 0.0 | c | 73.6 | 17.9 | z | z |
| Dundee City | 228.1 | 123.5 | 70.2 | 38.8 | 22.8 | 32.1 | 24.0 | 12.0 | 205.3 | 91.4 | 46.2 | 26.8 |
| East Ayrshire | 131.8 | 147.1 | 21.7 | 32.2 | 26.7 | 15.5 | c | c | 105.1 | 131.6 | 21.7 | z |
| Glasgow City | 78.3 | 60.1 | 32.0 | 14.3 | 7.6 | 18.9 | 6.0 | 3.4 | 70.7 | 41.2 | 26 | 10.9 |
| Inverclyde | 61.2 | 54.7 | 51.7 | 35.7 | 9.6 | 20.9 | 13.1 | 12.6 | 51.6 | 33.8 | 38.6 | 23.1 |
| North Ayrshire | 66.4 | 57.4 | 27.9 | 27.7 | 19.9 | c | c | 7.9 | 46.5 | z | z | 19.8 |
| North Lanarkshire | 95.9 | 85.6 | 98.6 | 45.8 | 18.0 | 19.5 | 17.8 | 9.3 | 77.9 | 66.1 | 80.8 | 36.5 |
| Renfrewshire | 56.0 | 79.3 | 107.7 | 89.7 | 9.6 | 19.1 | 20.2 | 10.1 | 46.4 | 60.2 | 87.5 | 79.6 |
| West Dunbartonshire | 81.0 | 132.9 | 78.3 | 36.8 | 23.3 | 29.6 | c | c | 57.7 | 103 | z | z |
| Scotland | 95.2 | 85.0 | 64.7 | 35.1 | 15.1 | 18.0 | 15.9 | 9.6 | 80.1 | 67.0 | 48.8 | 25.5 |
Source: Summary Statistics for Schools, Scottish Government
c = suppression due to small numbers
z= unable to calculate figure due to suppression
Reported evidence of impact
Perceptions of improvement
5.56 Reported evidence of impact emerged from a variety of evidence sources. For the Year 6 evaluation, the evidence gathered on perceptions of impact also included a specific question in the Local Authority Survey 2021 on perceptions of impact for the first time, as well as additional questions in the Headteacher Survey 2021 related to perceptions of the specific impact of PEF, where their school was in receipt of Challenge Authority or Schools Programme support.
5.57 At the local authority level, responses to the 2021 Survey provide supporting evidence of reported impact of ASF. The majority of local authorities who responded to the 2021 Survey (17 of 26) were of the view that they had seen improvement in their local authority towards closing the poverty-related attainment gap over the 2020/21 year as a result of ASF, with three indicating this to a great extent, and 17 to some extent. Conversely, eight local authority respondents viewed a limited extent of improvement, and one (Challenge Authority respondent) reported that they had seen no improvement.
5.58 The impact of COVID-19 is clear in local authorities' open responses, and will be explored further in the section below. The influence of the pandemic on availability of data was also raised in terms of perceptions of progress, including perceptions of less reliable data and more limited availability of ACEL data[14]:
'Due to COVID-19, no schools were able to assess the levels for Curriculum for Excellence in 2019/20. However, SNSA and TPJ (Teacher Professional Judgements) continue to provide evidence of progress on closing the gap.' (Challenge Authority respondent)
5.59 However, there are also clearly perceptions of progress as a result of ASF, in particular in individual settings or cohorts, and some local authorities made reference to the importance of data-driven improvements:
'…Use of the authority tracker continues to be used by all primary schools which is allowing for head teachers and their senior management team to have professional dialogue around the assessment of learning, identifying learning gaps as a result of the pandemic.' (Challenge Authority respondent)
5.60 There were also perceptions that whilst it may not be possible to evidence progress through Curriculum for Excellence levels, there is evidence of progress available at the school level on a number of relevant indicators, including softer measures, indicating a positive trajectory of travel:
'Each school has their own improvement story to tell with clear data. Not all are at the stage of being able to demonstrate this using CFE levels, however they can demonstrate this in the reduction of behavioural referrals, increase in attendance, reduction of exclusions, wellbeing support, feedback from families, families now positively working with schools and not against, greater empathy and understanding of needs from staff towards families. All of these start to create a greater foundation to allow pupils to be in a position to learn, which in time will increase their attainment.' (Local Authority in receipt of Schools Programme funding)
5.61 Other local authorities highlighted the introduction of specific mechanisms as instrumental in driving forward progress. For example, one Challenge Authority pointed to the introduction of 'recovery associates' as a mechanism to 'increase the capacity within establishments to identify gaps and focus on how these gaps could be addressed has ensured that almost all schools are well on their way to recovery and beyond.'
5.62 Variability of progress across cohorts and schools is a key feature highlighted in local authority responses. As one Challenge Authority commented, progress was seen in individual establishments 'where the support for individual children over a short period of time has enabled children to be on track to achieve expected levels at P1, P4 and P7 who otherwise would not have been.' Another Challenge Authority respondent pointed to an overall picture of 'improvement with the attainment gap narrowing across some cohorts, although not all'. Variability of progress is illustrated by the following assessment of progress by one local authority respondent:
'Whilst we have seen some improvement in attainment we recognise that this has been impacted by school closures, inconsistent attendance and school staffing/absence issues. Inevitably, this combination resulted in a lack of consistency across year groups, subject areas and school communities, and ultimately on attainment and achievement.' (Challenge Authority)
5.63 At the school level, headteachers' positive perceptions of success in meeting long term outcomes continue to be identified, remaining broadly consistent over recent years[15]. Amongst headteachers who responded to the 2021 Headteacher Survey, the majority (87%) reported seeing an improvement in closing the poverty-related attainment gap as a result of ASF supported approaches in the previous year (90% in 2020 survey, 91% in 2019). This included 17% who perceived 'a lot' of improvement to date.
5.64 Those headteachers who had seen 'a lot' of improvement in the previous year in the 2021 survey highlighted their schools' capacity to implement approaches relevant to local needs, teaching and staffing resources, and the value of a focus on health and wellbeing, including through external staffing to provide mental health support. Conversely, for schools where headteachers did not perceive they had seen improvement, respondent comments were primarily related to the adverse impact of COVID-19 and for some there were perceptions that PEF allocations were not sufficient for improvements to follow.
5.65 Additionally, 94% of headteachers who responded to the 2021 Survey note they expected to see improvements in closing the poverty-related attainment gap over the next few years.
5.66 For schools in receipt of Challenge Authority or Schools Programme funding in addition to PEF, the Headteacher Survey 2021 invited headteachers' perceptions of the specific impact of PEF in addition to the impact of other ASF support. The majority (94%) of headteachers who responded to the survey in receipt of PEF funding and Challenge Authority or Schools Programme support reported seeing an improvement specifically as a result of their PEF funding. This included 20% who felt they had seen 'a lot' of improvement to date as a result of PEF funding.
Influencing Factors
5.67 Factors viewed as influencing success in progress towards closing the poverty-related attainment gap continued to emerge from across data sources.
5.68 Findings from the Headteacher Survey 2021 continue to suggest a number of factors associated with schools' experiences and positive perceptions of progress in closing the poverty-related attainment gap. This includes:
- Change of culture or ethos such as embedding the approach to equity;
- Tailoring use of ASF to local needs;
- Effective use of data and evidence;
- Engagement with families and communities.
5.69 The respondent group most likely to have seen progress in closing the poverty-related attainment gap were headteachers who indicated PEF had been used effectively to meet local needs, providing evidence in support of the importance of tailoring PEF to local circumstances. Those who felt that the approach to achieving equity has been embedded within their school community were the second most likely respondent group to have seen such progress.
COVID-19 as an influencing factor
5.70 The impact of COVID-19 emerged as the key factor influencing perceptions of progress towards closing the poverty-related attainment gap.
5.71 All twenty-six local authorities who responded to the 2021 Local Authority Survey were of the view that COVID-19 had impacted on progress towards closing the poverty-related attainment gap in their local authority. Seventeen indicated this was to a great extent, and nine to some extent. This broadly mirrors 2020 findings when similarly all respondents were of the view that COVID-19 had impacted on progress towards closing the poverty-related attainment gap.
5.72 Eight Challenge Authority respondents were of the view that COVID-19 had impacted on progress towards closing the poverty-related attainment gap to a great extent. The impact of COVID-19 is illustrated in the following from one Challenge Authority respondent to the Local Authority Survey 2021:
'In short there was definite and sustained improvement prior to the pandemic but there are long term implications as result of the continued difficulties.' (Challenge Authority respondent)
5.73 The unequal impact of the pandemic on the most vulnerable pupils was reinforced across responses to the Local Authority Survey 2021. However, respondents also pointed to increasing numbers of families moving into poverty, as illustrated below:
COVID-19 has had a significant impact on our progress in closing learning gaps. The pandemic has reinforced inequalities in society with the most vulnerable suffering the greatest impact throughout this time across all societal measures of lifestyle and wellbeing. In addition to our existing vulnerable families, we now have a greater number of families moving into poverty and experiencing the impact of poverty on their wellbeing. (Challenge Authority respondent)
5.74 The depth of impact of COVID-19 was highlighted by respondents, some of whom suggested the need for 'a reset' in terms of measures and outcomes. Other key points highlighted by respondents included:
- Equity related staff covering staff absences leading to 'less time to focus on supporting outcomes and measures in plans';
- Ongoing impact on pupils at key transition points;
- Ongoing impact on children and young people's mental health and wellbeing;
- Ongoing impact of school interruptions, and pupil absences;
- Ongoing impact of reduction in support services.
5.75 There was also a continued perception amongst headteachers of the impact of COVID-19 on perceived progress in closing the poverty-related attainment gap. As in 2020, nearly all (95%) Headteacher Survey 2021 respondents viewed COVID-19 and school building closures as having had at least some impact on their progress, although a lower proportion in 2021 felt that COVID-19 and school building closures had a 'significant impact' on their progress (54% in 2021 compared with 61% in 2020). There was some variation across key respondent groups, with headteachers from schools with lower PEF allocations, those in rural areas and PEF-only schools more likely to feel significant impact of COVID-19 and school building closures.
Embedded and sustained practices
5.76 Sustained and embedded practices related to addressing the impact of the poverty-related attainment gap remains one of the high level long term outcomes for the Scottish Attainment Challenge. The Year 6 evaluation considered the following evaluation question:
'To what extent did the fund contribute to equity becoming embedded at different levels of the education system?'
5.77 The section below considers stakeholder perceptions of the extent to which improvements achieved as a result of ASF are likely to be sustainable, and of the extent to which the focus on closing the poverty-related attainment gap is likely to be sustainable. Considerations of sustainability in the context of COVID-19 were also sought. In a change from previous years, sustainability was considered in a broader sense rather than specifically linked to considering sustainability beyond the years of funding, in light of the commitment to refresh the Scottish Attainment Challenge for a further parliamentary term.
Sustainability of improvements
5.78 At the school level, headteachers' reported perceptions of the extent to which improvements achieved as a result of ASF are likely to be sustainable have increased when compared to 2020. Just over half (54%) of 2021 survey respondents indicated they expected ASF supported improvements would be sustainable, compared to approximately one third (34%) of those responding to the 2020 survey. 2021 survey findings are more aligned to 2019 findings on headteacher perceptions of sustainability of improvements, although changes to question structures mean any direct comparison over time is not possible and as highlighted elsewhere there are caveats regarding the extent to which findings from the Headteacher Survey 2021 are generalisable to the wider population as a result of low response.
Sustainability of focus
5.79 At the local authority level, there continue to be broadly positive expectations that the focus on closing the poverty-related attainment gap will be sustainable. Nearly all respondents to the Local Authority Survey 2021 (25 of 26) indicated they viewed the focus would be sustainable to a great or to some extent. The remaining respondent viewed the focus would be sustainable to only a limited extent.
5.80 Continuation of funding was the primary factor associated with ensuring a sustainability of focus on equity from the perspective of local authorities. Changes to funding distribution which will be introduced with the refreshed SAC were key, with local authority responses reflecting the specific circumstances of how the refreshed SAC would affect allocations.
5.81 Local authority responses also made reference to a range of other factors associated with the sustainability of focus:
- ongoing professional learning;
- continued focus on understanding the challenges associated with poverty for children and their families (and associated understanding of the need for a focus on equity);
- focus on data and evidence;
- creating a culture of embedding sustainable approaches; and
- focus on collaboration.
5.82 The importance of strategic planning in promoting a sustainable focus towards closing the poverty-related attainment gap remained evident in local authority responses.
5.83 However, there was widespread acknowledgement that COVID-19 has had, and will continue to, impact on sustainability of focus to some extent. Nearly all respondents to the Local Authority Survey 2021 (25 of 26) were of the view that COVID-19 has impacted on their focus on sustainability. Six respondents viewed COVID-19 had impacted to a great extent on their focus on sustainability, and 19 reported the pandemic had impacted to some extent. The remaining one respondent viewed COVID-19 to have impacted on their focus on sustainability to a limited extent. Local authority perspectives reflected on the need to ensure a continued focus on sustainability.
5.84 Headteacher perspectives on the extent to which the focus on equity will be sustainable were more positive than views on sustainability of improvements. Almost two thirds (65%) of headteachers responding to the 2021 survey were of the view that the focus on equity will be sustainable. This represents an increase of seven percentage points on the 2020 survey (58%) and twenty-three percentage points on the 2019 survey (42%).
5.85 Headteachers who felt progress to date and/or the focus on equity will be sustainable provided a range of reasons in support of their view, most commonly suggesting staff skills and capacity developed with ASF support, developing capacity to use evidence to inform approaches and embedding use of evidence in monitoring progress as part of school culture, developing whole school approaches to equity, and embedding approaches to achieving equity through improved pedagogy. Headteachers who were less positive in terms of sustainability of progress and/or focus on equity highlighted concerns about staffing levels related to sustainability of initiatives and approaches, and potential loss of skills should staffing levels reduce.
Contact
Email: socialresearch@gov.scot
There is a problem
Thanks for your feedback