Scottish household survey 2019: culture and heritage - report
Reports on culture and heritage data from the 2019 Scottish Household Survey.
This document is part of a collection
3 Attendance at Cultural Events and Places
2019 data show that 81 per cent of adults in Scotland had attended or visited a cultural event or place in the last 12 months (Table 3.1). Cinema was the most common cultural event or place to visit (see below). When trips to the cinema are excluded, the attendance figure was lower at 74 per cent. Both attendance figures have been maintained since 2018.
Note that although the figures for years 2012 to 2017 are given in Table 3.1 in order to provide broader context for the trend data, these should not be used for drawing comparisons between pre-2018 data and data from 2018 onwards due to the changes made to the wording of the cultural attendance questions.
| Adults | 2012 | 2013 | 2014 | 2015 | 2016 | 2017 | * | 2018 | 2019 |
|---|---|---|---|---|---|---|---|---|---|
| Attendance (exc. cinema) | 70 | 72 | 73 | 75 | 75 | 77 | * | 74 | 74 |
| Attendance (inc. cinema) | 78 | 80 | 80 | 82 | 83 | 84 | * | 81 | 81 |
| Base | 9,890 | 9,920 | 9,800 | 9,410 | 9,640 | 9,810 | * | 9,700 | 9,780 |
* Due to the changes made to the cultural attendance questions in 2018, the previous years are not directly comparable.
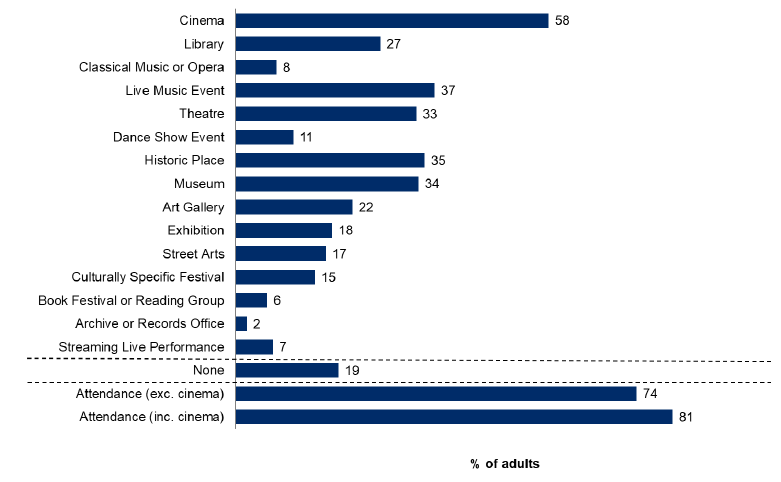
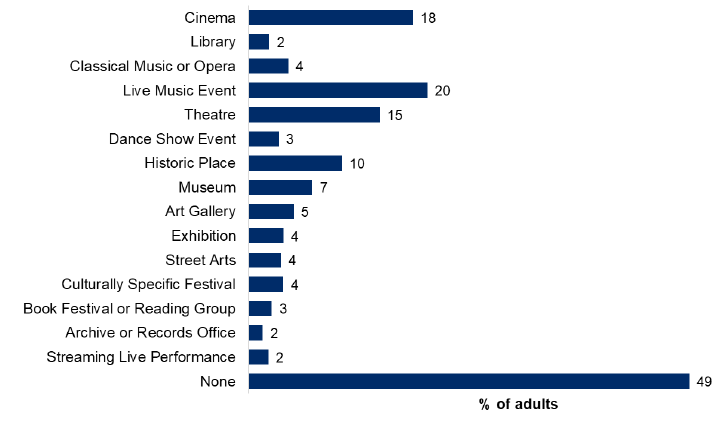
Figure 3.1 shows that over half of respondents (58 per cent) had been to the cinema in the last 12 months, making this the most common type of cultural attendance. The next most common types of cultural attendance were attendance at live music events (37 per cent) and visits to historic places (35 per cent), followed by museums (34 per cent) and theatres (33 per cent).
2019 data show the lowest levels of attendance from the list provided were at book festivals or reading groups, and archive or record offices (six and two per cent respectively).
Just under a fifth of adults (19 per cent) had not attended or visited a cultural event or place of culture in the last 12 months.
3.1 Attendance by Gender
2019 data show that more women than men attended or visited a cultural event or place in the last 12 months. Eighty-three per cent of women had attended or visited a cultural event or place compared to 79 per cent of men (Figure 3.2). Women also had higher cultural attendance than men after excluding trips to the cinema, with the gap between women and men increasing to six percentage points (77 per cent and 71 per cent).
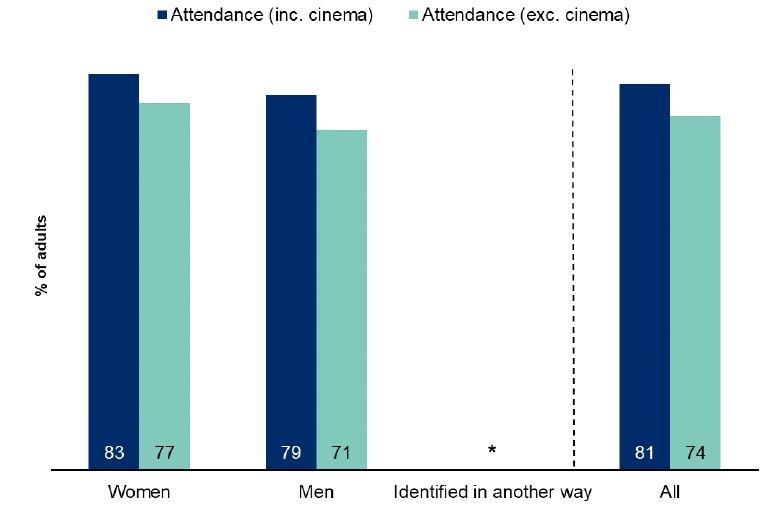
Table 3.2 shows that gender differences in attendance were more pronounced for particular cultural events and places. More women than men visited the theatre (39 per cent compared with 27 per cent), and women were also more likely than men to visit the library (31 per cent compared with 22 per cent). Women were more likely than men to attend or visit most individual cultural events and places; for some events and places, however, there were no significant differences in attendance between the groups (street arts and culturally specific festivals, for example).
| Adults | Women | Men | Identified in another way | Refused | All |
|---|---|---|---|---|---|
| Cinema | 61 | 55 | * | * | 58 |
| Library | 31 | 22 | * | * | 27 |
| Classical Music or Opera | 8 | 7 | * | * | 8 |
| Live Music Event | 37 | 37 | * | * | 37 |
| Theatre | 39 | 27 | * | * | 33 |
| Dance Show Event | 14 | 8 | * | * | 11 |
| Historic Place | 36 | 34 | * | * | 35 |
| Museum | 36 | 32 | * | * | 34 |
| Art Gallery | 23 | 20 | * | * | 22 |
| Exhibition | 19 | 17 | * | * | 18 |
| Street Arts | 17 | 16 | * | * | 17 |
| Culturally Specific Festival | 15 | 14 | * | * | 15 |
| Book Festival or Reading Group | 7 | 4 | * | * | 6 |
| Archive or Records Office | 2 | 2 | * | * | 2 |
| Streaming Live Performance | 8 | 6 | * | * | 7 |
| None | 17 | 21 | * | * | 19 |
| Attendance (exc. cinema) | 77 | 71 | * | * | 74 |
| Attendance (inc. cinema) | 83 | 79 | * | * | 81 |
| Base | 5,410 | 4,360 | 0 | 0 | 9,780 |
Columns may not add to 100 per cent since multiple responses were allowed.
3.2 Attendance by Age
2019 data show that younger age groups were noticeably more likely to have attended a cultural event or visited places of culture in the last 12 months than older age groups. Those aged 75 and over were particularly less likely to attend a cultural event or visit a cultural place. Ninety-two per cent of 16 to 24 year olds had attended or visited a cultural event or place compared to 55 per cent of those aged 75 and over (Figure 3.3). The pattern holds when cinema attendance is excluded (81 per cent and 52 per cent).
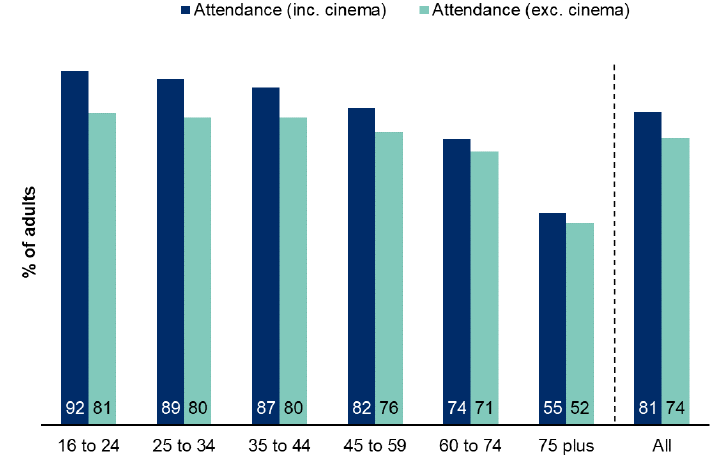
Table 3.3 shows that age differences in attendance were more pronounced for certain cultural events or places, but the patterns of attendance tended to vary across most individual events and places between age groups. Eighty per cent of adults aged 16 to 24 reported having been to the cinema in the previous 12 months, compared with 21 per cent of those aged 75 and over. Half of 16 to 24 year olds (50 per cent) had attended a live music event, compared with ten per cent of those aged 75 and over. However, the youngest age group was not the most likely to attend certain other events and places, such as the theatre, historic place and museum, for example.
| Adults | 16 to 24 | 25 to 34 | 35 to 44 | 45 to 59 | 60 to 74 | 75 plus | All |
|---|---|---|---|---|---|---|---|
| Cinema | 80 | 72 | 70 | 59 | 41 | 21 | 58 |
| Library | 28 | 29 | 36 | 22 | 26 | 22 | 27 |
| Classical Music Performance or Opera | 5 | 6 | 7 | 8 | 10 | 8 | 8 |
| Live Music Event | 50 | 45 | 39 | 42 | 29 | 10 | 37 |
| Theatre | 25 | 29 | 36 | 38 | 37 | 25 | 33 |
| Dance Show Event | 8 | 11 | 16 | 11 | 10 | 6 | 11 |
| Historic Place | 30 | 40 | 42 | 38 | 32 | 17 | 35 |
| Museum | 34 | 39 | 44 | 33 | 31 | 16 | 34 |
| Art Gallery | 19 | 24 | 24 | 23 | 23 | 12 | 22 |
| Exhibition | 14 | 18 | 20 | 20 | 20 | 9 | 18 |
| Street Arts | 19 | 20 | 22 | 19 | 12 | 4 | 17 |
| Culturally Specific Festival | 9 | 18 | 20 | 17 | 13 | 6 | 15 |
| Book Festival or Reading Group | 3 | 6 | 7 | 7 | 6 | 4 | 6 |
| Archive or Records Office | 1 | 1 | 2 | 2 | 4 | 2 | 2 |
| Streaming Live Performance to Venue | 12 | 8 | 6 | 7 | 6 | 4 | 7 |
| None | 8 | 11 | 13 | 18 | 26 | 45 | 19 |
| Attendance (exc. cinema) | 81 | 80 | 80 | 76 | 71 | 52 | 74 |
| Attendance (inc. cinema) | 92 | 89 | 87 | 82 | 74 | 55 | 81 |
| Base | 620 | 1,320 | 1,420 | 2,410 | 2,540 | 1,470 | 9,780 |
Columns may not add to 100 per cent since multiple responses were allowed.
3.3 Attendance by Highest Level of Qualification
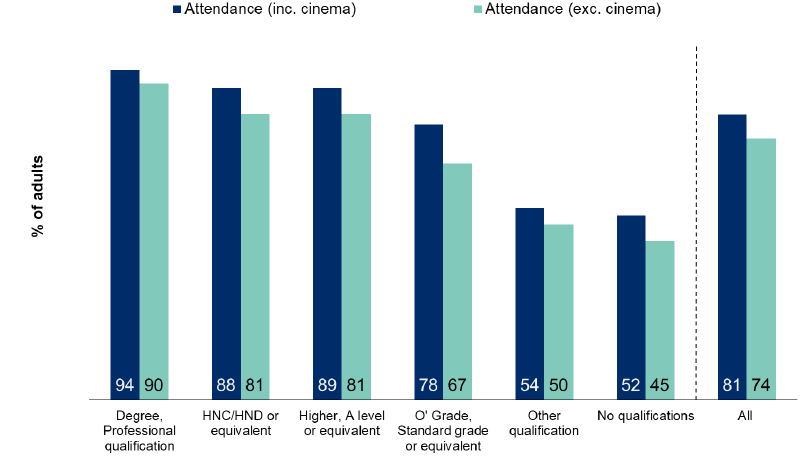
2019 data show that adults with degrees or professional qualifications were most likely to attend cultural events and visit places of culture; attendance was lowest for those with no qualifications (94 per cent compared to 52 per cent) (Figure 3.4). The pattern holds when cinema attendance is excluded (90 per cent compared to 45 per cent). In general, attendance declined with the level of qualifications.
As with the overall figure, attendance at individual events or places was consistently higher for adults with a degree or professional qualification (Table 3.4). There were significant differences between those with a degree or professional qualification, and those with no qualifications, for all individual events or places. Therefore, those with a degree or professional qualification were more likely than those with no qualification to attend or visit all individual events and places listed in the question. The most marked differences between these groups can be seen for trips to the cinema (73 per cent and 26 per cent respectively) and visits to historic places (56 per cent and 12 per cent respectively).
| Adults | Degree, Professional qualification | HNC/HND or equivalent | Higher, A level or equivalent | O' Grade, Standard grade or equivalent | Other qualification | No qualifications | All |
|---|---|---|---|---|---|---|---|
| Cinema | 73 | 68 | 67 | 54 | 26 | 26 | 58 |
| Library | 38 | 26 | 29 | 19 | 16 | 15 | 27 |
| Classical Music or Opera | 16 | 5 | 6 | 3 | 2 | 2 | 8 |
| Live Music Event | 51 | 43 | 44 | 29 | 14 | 12 | 37 |
| Theatre | 49 | 35 | 32 | 25 | 24 | 15 | 33 |
| Dance Show Event | 16 | 13 | 11 | 7 | 5 | 4 | 11 |
| Historic Place | 56 | 37 | 35 | 22 | 15 | 12 | 35 |
| Museum | 51 | 39 | 35 | 22 | 17 | 13 | 34 |
| Art Gallery | 38 | 21 | 20 | 12 | 9 | 6 | 22 |
| Exhibition | 33 | 21 | 14 | 7 | 7 | 3 | 18 |
| Street Arts | 28 | 17 | 16 | 10 | 7 | 5 | 17 |
| Culturally Specific Festival | 23 | 15 | 14 | 11 | 7 | 5 | 15 |
| Book Festival or Reading Group | 12 | 4 | 5 | 2 | 2 | 1 | 6 |
| Archive or Records Office | 4 | 2 | 1 | 1 | 1 | 0 | 2 |
| Streaming Live Performance | 11 | 7 | 8 | 5 | 2 | 1 | 7 |
| None | 6 | 12 | 11 | 22 | 46 | 48 | 19 |
| Attendance (exc. cinema) | 90 | 81 | 81 | 67 | 50 | 45 | 74 |
| Attendance (inc. cinema) | 94 | 88 | 89 | 78 | 54 | 52 | 81 |
| Base | 2,960 | 1,130 | 1,460 | 1,710 | 640 | 1,810 | 9,780 |
Columns add to more than 100 per cent since multiple responses allowed.
3.4 Attendance by Scottish Index of Multiple Deprivation (SIMD)
2019 data show that levels of cultural attendance increased as deprivation as measured by the Scottish Index of Multiple Deprivation (SIMD 2020) decreased. Figure 3.5 shows there was a 20 percentage point difference in cultural attendance (including cinema) between those living in the 20 per cent most and 20 per cent least deprived areas (71 per cent compared with 91 per cent). When cinema attendance is excluded, the difference was even greater, with 63 per cent of those living in the most deprived areas and 86 per cent in the least deprived areas attending or visiting a cultural event or place.
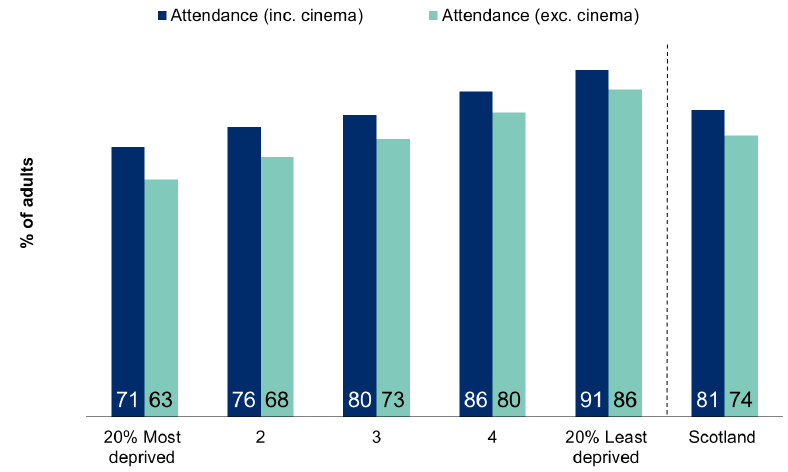
As with the overall figure, attendance at individual events or places was consistently higher for adults living in the least deprived areas (Table 3.5). There were significant differences between those living in the 20 per cent most and 20 per cent least deprived areas for all individual events or places. Therefore, those living in the 20 per cent most deprived areas were less likely than those living in the 20 per cent least deprived areas to attend and visit all individual cultural events and places listed in the question. The most noticeable differences between those living in the most and least deprived areas can be seen for visits to the theatre (21 per cent and 47 per cent respectively) and historic places (21 per cent and 48 per cent respectively).
| Adults | 20% Most deprived | 2 | 3 | 4 | 20% Least deprived | Scotland |
|---|---|---|---|---|---|---|
| Cinema | 48 | 52 | 57 | 63 | 70 | 58 |
| Library | 23 | 23 | 28 | 28 | 32 | 27 |
| Classical Music or Opera | 3 | 6 | 7 | 9 | 13 | 8 |
| Live Music Event | 26 | 31 | 38 | 42 | 46 | 37 |
| Theatre | 21 | 29 | 32 | 38 | 47 | 33 |
| Dance Show Event | 8 | 10 | 11 | 12 | 14 | 11 |
| Historic Place | 21 | 28 | 35 | 42 | 48 | 35 |
| Museum | 28 | 27 | 32 | 36 | 46 | 34 |
| Art Gallery | 15 | 18 | 20 | 23 | 32 | 22 |
| Exhibition | 10 | 12 | 19 | 21 | 27 | 18 |
| Street Arts | 11 | 15 | 15 | 18 | 24 | 17 |
| Culturally Specific Festival | 9 | 13 | 15 | 17 | 19 | 15 |
| Book Festival or Reading Group | 3 | 4 | 6 | 7 | 10 | 6 |
| Archive or Records Office | 1 | 2 | 2 | 3 | 3 | 2 |
| Streaming Live Performance | 5 | 7 | 8 | 7 | 9 | 7 |
| None | 29 | 24 | 20 | 14 | 9 | 19 |
| Attendance (exc. cinema) | 63 | 68 | 73 | 80 | 86 | 74 |
| Attendance (inc. cinema) | 71 | 76 | 80 | 86 | 91 | 81 |
| Base | 1,830 | 1,980 | 2,150 | 2,020 | 1,800 | 9,780 |
Columns add to more than 100 per cent since multiple responses allowed.
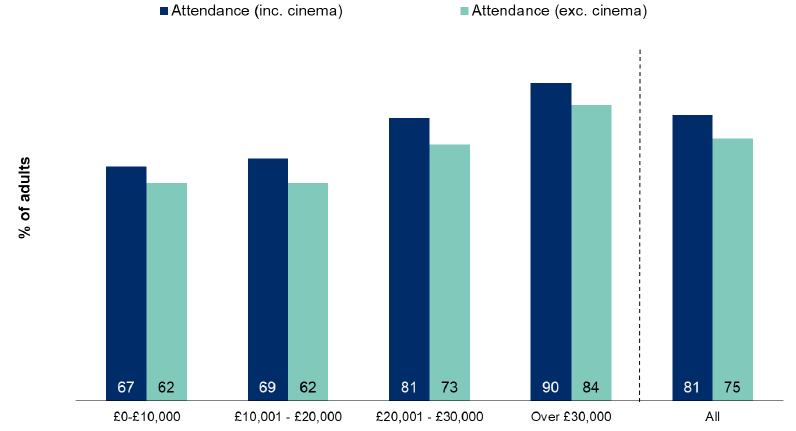
3.5 Attendance by Net Annual Household Income
2019 data show that cultural attendance decreased as net annual household income decreased and was the highest for those with the highest net annual household income. Ninety per cent of those with a net annual household income of over £30,000 had attended or visited a cultural event or place (Figure 3.6). Attendance was lowest for those with a net annual household income of between £0 and £10,000 (67 per cent). The pattern holds when cinema attendance is excluded (84 per cent compared to 62 per cent).
As with the overall figure, attendance at individual events or places was consistently higher for adults with the highest net annual household income (Table 3.6). With the exceptions of library and archive or records office, all other differences between those with a net annual household income of over £30,000 and those with a net annual household income of between £0 and £10,000 are significant. Therefore, those with a net annual household income of over £30,000 were more likely than those with a net annual household income of between £0 and £10,000 to attend or visit most individual cultural events and places. The biggest differences between those in these income groups can be seen for trips to the cinema (71 per cent and 41 per cent respectively) and attendance at live music events (48 per cent and 25 per cent respectively).
| Adults | £0 - £10,000 | £10,001 - £20,000 | £20,001 - £30,000 | Over £30,000 | All |
|---|---|---|---|---|---|
| Cinema | 41 | 42 | 56 | 71 | 58 |
| Library | 28 | 25 | 26 | 28 | 27 |
| Classical Music or Opera | 7 | 6 | 7 | 9 | 8 |
| Live Music Event | 25 | 24 | 34 | 48 | 38 |
| Theatre | 25 | 24 | 32 | 41 | 34 |
| Dance Show Event | 7 | 7 | 10 | 14 | 11 |
| Historic Place | 25 | 22 | 32 | 46 | 35 |
| Museum | 31 | 25 | 30 | 41 | 34 |
| Art Gallery | 21 | 15 | 19 | 26 | 22 |
| Exhibition | 14 | 12 | 16 | 23 | 18 |
| Street Arts | 11 | 11 | 16 | 21 | 17 |
| Culturally Specific Festival | 9 | 8 | 15 | 20 | 15 |
| Book Festival or Reading Group | 3 | 4 | 5 | 8 | 6 |
| Archive or Records Office | 2 | 2 | 2 | 2 | 2 |
| Streaming Live Performance | 5 | 4 | 6 | 9 | 7 |
| None | 33 | 31 | 19 | 10 | 19 |
| Attendance (exc. cinema) | 62 | 62 | 73 | 84 | 75 |
| Attendance (inc. cinema) | 67 | 69 | 81 | 90 | 81 |
| Base | 900 | 2,880 | 2,100 | 3,500 | 9,380 |
Columns add to more than 100 per cent since multiple responses allowed.
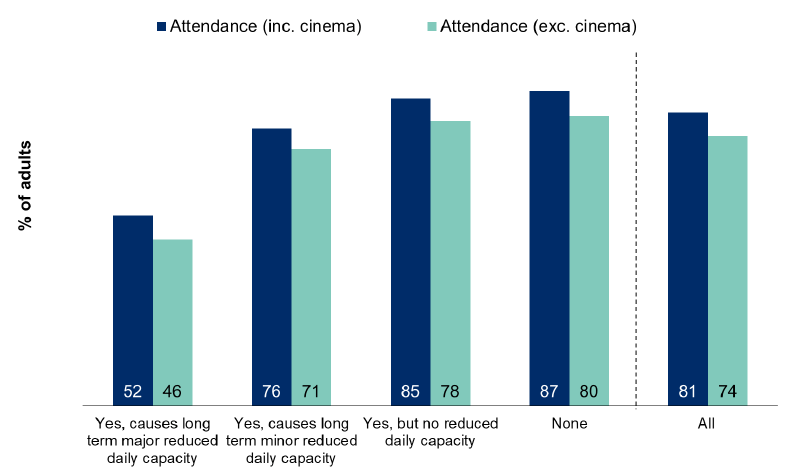
3.6 Attendance by Long-Term Physical or Mental Health Condition
2019 data show that cultural attendance was lowest among adults with a physical or mental health condition that caused long-term major reduced daily capacity. In general, attendance decreased according to the extent a condition affected daily capacity. Fifty-two per cent of those with a condition that caused long-term major reduced capacity had attended or visited a cultural event or place compared with 87 per cent attendance for those with no long-term physical or mental health condition (Figure 3.7).
For those whose condition caused minor reduced daily capacity, the attendance rate was 76 per cent, and for those whose condition caused no reduced daily capacity, the attendance rate was 85 per cent.
When cinema is excluded, attendance for those with conditions that caused major reduced daily capacity was 46 per cent and for those with no long-term physical or mental health condition it was 80 per cent. For those with conditions that caused minor reduced daily capacity, the attendance rate was 71 per cent and for those with conditions that caused no reduced capacity the attendance rate was 78 per cent.
As with the overall figure, attendance at individual events or places tended to be higher for adults with no long-term physical or mental health condition (Table 3.7). With the exception of archive office, those with no physical or mental health condition were more likely than those with a condition that caused long-term major reduced daily capacity to have attended or visited all other individual cultural event or places.
The largest difference in attendance between these groups can be seen for trips to the cinema (66 per cent and 27 per cent respectively). This is despite going to the cinema being the most frequently attended activity for those with a condition that caused long-term major reduced daily capacity. Other large differences can be seen for live music events (43 per cent and 15 per cent respectively). It should be noted that attendance at some cultural events was as high for those with conditions that did not affect capacity or affected it in a minor way as for those with no long-term physical or mental health condition. This can be seen for visits to libraries and theatres, for example.
| Adults | Yes, causes long term major reduced daily capacity | Yes, causes long term minor reduced daily capacity | Yes, but no reduced daily capacity | None | All |
|---|---|---|---|---|---|
| Cinema | 27 | 45 | 56 | 66 | 58 |
| Library | 18 | 28 | 29 | 28 | 27 |
| Classical Music or Opera | 4 | 7 | 9 | 8 | 8 |
| Live Music Event | 15 | 29 | 35 | 43 | 37 |
| Theatre | 17 | 32 | 38 | 36 | 33 |
| Dance Show Event | 5 | 9 | 12 | 12 | 11 |
| Historic Place | 16 | 29 | 36 | 40 | 35 |
| Museum | 15 | 27 | 31 | 39 | 34 |
| Art Gallery | 10 | 17 | 22 | 25 | 22 |
| Exhibition | 9 | 14 | 21 | 20 | 18 |
| Street Arts | 6 | 12 | 13 | 20 | 17 |
| Culturally Specific Festival | 8 | 13 | 13 | 16 | 15 |
| Book Festival or Reading Group | 4 | 4 | 7 | 7 | 6 |
| Archive or Records Office | 1 | 3 | 3 | 2 | 2 |
| Streaming Live Performance | 2 | 7 | 8 | 8 | 7 |
| None | 48 | 24 | 15 | 13 | 19 |
| Attendance (exc. cinema) | 46 | 71 | 78 | 80 | 74 |
| Attendance (inc. cinema) | 52 | 76 | 85 | 87 | 81 |
| Base | 1,560 | 1,290 | 610 | 6,270 | 9,780 |
Columns may not add to 100 per cent since multiple responses were allowed.
3.7 Frequency of Attendance at Cultural Events or Places
2019 data show that people visiting the library did so more frequently than those attending other cultural events or visiting other places of culture. Almost one in five people (19 per cent) had visited a library at least once a week, and two fifths of adults had visited less often than once a week, but at least once a month (40 per cent) (Table 3.8). Twenty per cent of respondents who had attended the cinema within the past 12 months went at least once a month. The vast majority of those who had attended cultural events or had visited places of culture did so less often than once a month but within the last 12 months.
| Adults | At least once a week | Less often than once a week / at least once a month | Less often than once a month but within the last 12 months | Don't know | Total | Base |
|---|---|---|---|---|---|---|
| Cinema | 2 | 18 | 80 | 0 | 100 | 5,120 |
| Library | 19 | 40 | 41 | 0 | 100 | 2,650 |
| Classical Music or Opera | 1 | 6 | 91 | 1 | 100 | 790 |
| Live Music Event | 2 | 8 | 90 | 0 | 100 | 3,320 |
| Theatre | 0 | 4 | 96 | 0 | 100 | 3,160 |
| Dance Show Event | 0 | 3 | 96 | 0 | 100 | 1,020 |
| Historic Place | 1 | 12 | 87 | 0 | 100 | 3,300 |
| Museum | 1 | 9 | 90 | 0 | 100 | 3,200 |
| Art Gallery | 1 | 9 | 89 | 1 | 100 | 2,080 |
| Exhibition | 1 | 6 | 93 | 0 | 100 | 1,760 |
| Street Arts | 1 | 4 | 94 | 2 | 100 | 1,470 |
| Culturally Specific Festival | 0 | 2 | 97 | 1 | 100 | 1,460 |
| Book Festival or Reading Group | 3 | 11 | 85 | 1 | 100 | 580 |
| Archive or Records Office | 3 | 6 | 91 | - | 100 | 230 |
| Streaming Live Performance | 3 | 5 | 87 | 5 | 100 | 650 |
Columns add to more than 100 per cent since multiple responses allowed.
3.8 Aspirations of Attendance at Cultural Events and Places
A new biennial question asking those who had reported going to cultural events or places in the last 12 months which cultural events or places they would like to go to more often, or go to that they have not been to before was included in the Scottish Household Survey in 2019 (Figure 3.8). Around half responded ‘none’ (49 per cent). One in five (20 per cent) wanted to attend a live music event more often or to go to a live music event. Eighteen per cent said they would like to go to the cinema.
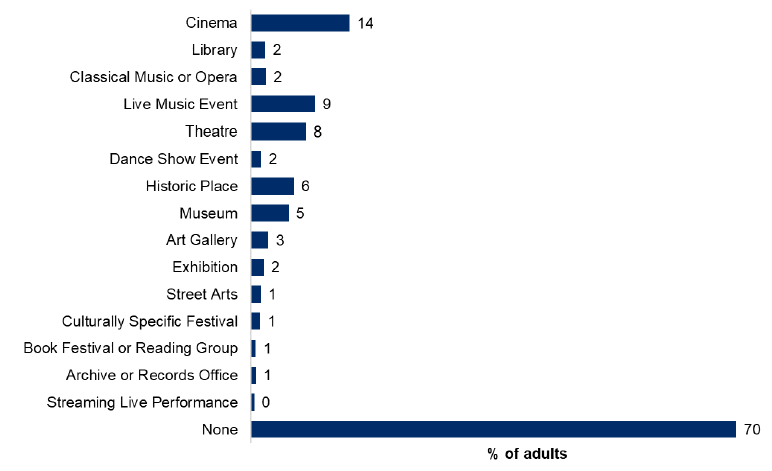
Another new biennial question in 2019 asked those who had not gone to any cultural events or places in the last 12 months, which cultural events or places they would like to go to (Figure 3.9). The majority responded ‘none’ (70 per cent). 14 per cent said they would like to go to the cinema, nine per cent would like to attend a live music event and eight per cent would like to go the theatre.
Therefore, people who had attended cultural events and places in the last 12 months were more likely to aspire to attend these more often or to attend events and places they haven’t been to before, than are those who hadn’t attended any in the last 12 months.
3.9 Factors Limiting or Preventing Attendance at Cultural Events and Places
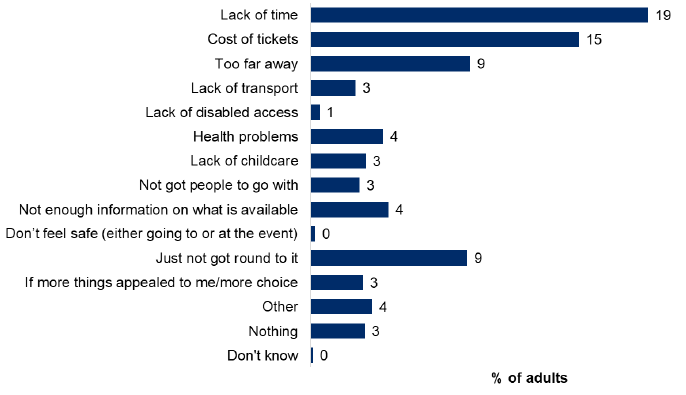
A new biennial question in the 2019 Scottish Household Survey asked what, if anything, limits or prevents people attending cultural events and places. The question was asked of all adults, both those who had attended a cultural event or place in the last 12 months and those who had not. Around one in five (19 per cent) reported this was due to lack of time, while 15 per cent named cost of tickets as a factor (Figure 3.10).
Contact
Email: socialresearch@gov.scot
There is a problem
Thanks for your feedback