The gender pay gap in Scotland - update and analysis of time series data
A short bulletin which explores some of the key trends on the gender pay gap in recent years.
The Gender Pay Gap in Scotland - Update and Analysis of Time-Series Data
The Gender Pay gap describes the difference in average pay between men and women. The gender pay gap here is calculated as the difference between average hourly earnings (excluding overtime) of men and women as a proportion of average hourly earnings (excluding overtime) of men's earnings.
The Gender Pay Gap exists for a number of complex and interrelated factors. The key barrier often cited is that women disproportionately take on caring responsibilities for family members which can lead to career disruption and may also affect decisions made over hours, sector and occupation.
However other factors, including the role of societal norms and discrimination, are also likely to explain some of the pay gap.
In June 2016 the Scottish Government published a report entitled 'New Perspectives on the Gender Pay Gap' which laid out what we know about the reasons for the gender pay gap. This bulletin updates some of this analysis with 2016 data and looks in more detail at some of the longer term trends in Scotland.
There are two key measures covered in this bulletin:
- The "official" measure uses full-time gross median hourly earnings (excluding overtime) of men and women. This is the official measure used by the ONS and in Scotland Performs.
- The overall pay gap includes both full-time and part-time workers. The overall pay gap is larger than the full-time pay gap because part-time workers are paid less per-hour on average and a higher proportion of women work part-time.
This bulletin looks in turn at trends in the headline statistics, and breakdowns by age, occupation, industry and UK country.
The analysis in this bulletin has been prepared by Scottish Government analysts in Communities Analysis Division and the Office of the Chief Economic Adviser. Data on earnings is from the Annual Survey of Hours and Earnings ( ASHE) compiled by the ONS.
All data used in this bulletin is available on the Scottish Government website, here.
Chart 1-Gender Pay Gap Measures (Source: ASHE median hourly earnings excl. overtime)
")
Official data on earnings from the Annual Survey of Hours and Earnings ( ASHE) are based on a 1% sample of PAYE records. Small year-on-year changes may not therefore be statistically significant so analysis should focus on medium to longer term changes.
Discontinuities in the time-series data mean only broad conclusions can be reached although a consistent time-series runs from 2011 to 2016.
In 2016 the full-time and overall pay gap remained at a similar level to 2011. However, this masks different underlying trends which are explored in the rest of this bulletin.
- The gender pay gap has declined over time
- This is true for both the full-time and the overall pay gap
We have not focused on the mean pay gap in this analysis, which is strongly influenced by very high earners and can therefore mask trends in typical pay. However, ASHE data also shows that there has been a clear reduction in the mean pay gap over time.
Chart 2-Gender Pay Gap Measures Since 2011 (Source: ASHE median hourly earnings excl. overtime)
")
The Gender Pay Gap in Scotland…..by Age
The "New Perspectives on the Gender Pay Gap" report discussed the reasons why the gender pay gap differs by age, and how this has changed over time.
There has been a clear and sustained improvement since 1997 in the gender pay gap for those aged over 25. However, a difference between the full-time and overall pay gap starts to open up after 25 and both measures of the pay gap then worsen with age. This is likely to be due to the long-lasting career impact of women spending more time on average caring for young children and family.
The 16-24 age group is difficult to analyse and compare to older age groups because many are in further education and/or in lower paid work. The data has been especially volatile in recent years making it difficult to understand the outlook for this age group.
Chart 3-Full-time Gender Pay Gap by Age (Source: ASHE median hourly earnings excl. overtime)
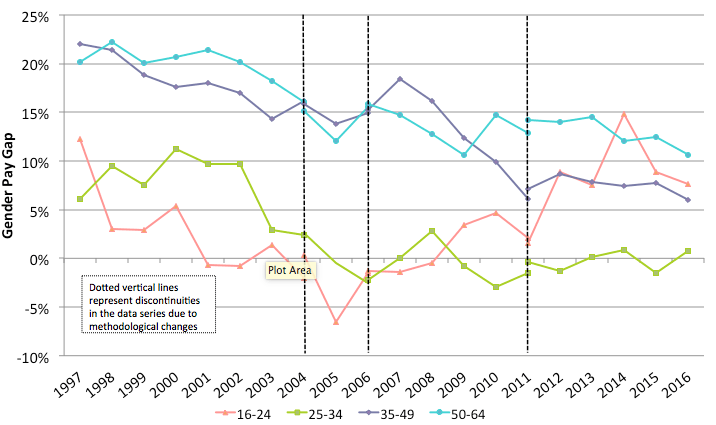
Data is limited for the 65+ age group, but we are currently taking forward additional research in this area which will be published later this year.
The Gender Pay Gap in Scotland…..by Age (cont'd)
Charts 4 to 7-Full-Time and Overall Gender Pay Gap by Age (Source: ASHE median hourly earnings excl. overtime)
")
As already mentioned, it is difficult to understand the 16-24 year old age group. The full-time pay gap appears to have risen since the recession and has caught up with the overall pay gap. Changes in working patterns and available work opportunities for young people may have been responsible for some of these changes, but it is difficult to confirm this with the data available. We will continue to monitor and analyse this as more data becomes available.
")
Beyond the age of 25, a difference opens up between the full-time and the overall pay gap. Women who do not have children at this time are more likely to remain in full - time employment and their earnings in 2016 were roughly equivalent to men. Women with caring responsibilities are more likely to work part-time which is paid less per hour on average, affecting the overall pay gap.
")
If women leave the labour market temporarily, they are likely to re-enter the labour market at a lower salary than had they remained working, and indeed a lower salary than men who continued working. This is likely to be responsible for the higher full-time pay gap for older age groups as the 'penalty' from taking time out of the labour market, as well as from working part time in the past, is reflected in progression and pay.
")
Research indicates that reductions in the gender pay gap since 1997 for the older age groups largely reflect equalisation of education levels feeding through different cohorts. These gains have now largely worked their way through. Unequal caring responsibilities remain a key barrier to reducing the pay gap further.
The Gender Pay Gap in Scotland….by Industry and Occupation
"New Perspectives on the Gender Pay Gap" explored the impact of occupational and industry segregation on the gender pay gap. Gen- der segregation has shown little change over time, and this is covered in published analysis of the Annual Population Survey data ("Regional Employment Patterns in Scotland"- available here).
The gender pay gap is much higher in certain sectors-notable examples are financial services and professional, scientific and technical activities -and in some occupations-in particular skilled trade occupations and managers, directors and senior officials.
Sometimes the term 'horizontal segregation' is used to refer to industrial segregation, and 'vertical segregation' is used to refer to occupational segregation.
In terms of occupation, progress has been more mixed. Of particular note is the lack of progress in tackling the gender pay gap for managers, directors and senior officials, one of the highest paid occupation groups.
Indeed the gender pay gap is highest at the top of the earnings distribution. Whilst using median earnings to describe the pay gap gives us a good overview of the typical experience of women, it does mask the wider pay gap at the higher end of the earnings distribution. Many reasons are likely to exist for the particularly high pay gap for higher earners, including the disruption of careers and part-time work meaning women on average may have less, or are perceived to have less, labour market
experience than men. Also of interest is the increase in the gender pay gap for caring, leisure and other service occupations, an area where there are a relatively high proportion of women workers.
Table 1-Full-time Gender Pay Gap by Occupation Since 2011 (Source: ASHE median hourly earnings excl. overtime)
")
Key: The colour coding indicates the quality of each estimate. The quality of an estimate is measured by its coefficient of variation (CV).

The Gender Pay Gap in Scotland….by Industry and Occupation (cont'd)
Despite the headline statistics showing little progress in the gender pay gap since 2011, looking at the gender pay gap by industry, there has been an improvement in every sector over the past 5 years with the exception of admin and support service activities although the precision of the data may be an issue for some sector
Table 2-Full-time Gender Pay Gap by Industry Since 2011 (Source: ASHE median hourly earnings excl. overtime)
")
Key: The colour coding indicates the quality of each estimate. The quality of an estimate is measured by its coefficient of variation (CV).
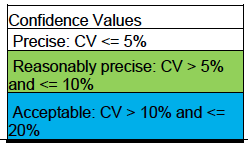
The Gender Pay Gap across the UK
Chart 8-Full-time and Overall Gender Pay Gap - UK and Scotland (Source: ASHE median hourly earnings excl. overtime)
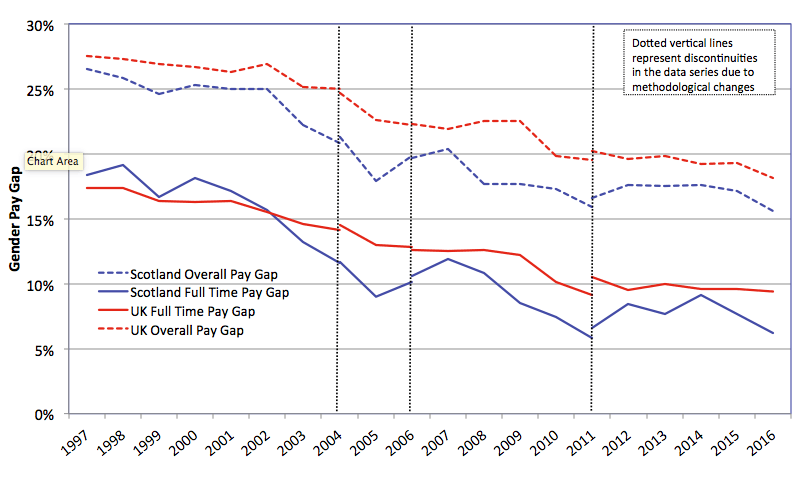
Chart 9-Full-time Gender Pay Gap - UK countries (Source: ASHE median hourly earnings excl. overtime)
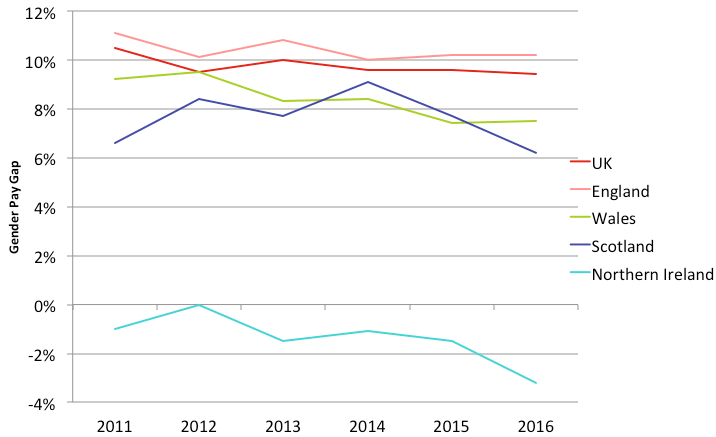
The gender pay gap remained at similar levels in Scotland and England in 2016 compared to 2011. Whilst not too much emphasis should be placed on annual changes, both Wales and Northern Ireland appear to have seen falls in the gender pay gap over this time period.
The reason for the far lower gender pay gap in Northern Ireland is partly attributed to the fact that a greater proportion of women work in the public sector (40% compared to UK average of 31%). There is a wage premium in the public sector compared to the private sector in Northern Ireland. Another factor that has been suggested is that the female employment rate is lower in Northern Ireland (63% compared to UK average of 69% in the year to April 2016) and this difference is particularly apparent for women over the age of 35, suggesting fewer women may be returning to the labour market once they have had children compared to elsewhere in the UK.
Contact
There is a problem
Thanks for your feedback