Scottish Survey of Literacy and Numeracy 2011
The results of the 2011 Scottish Survey of Literacy and Numeracy (SSLN) which focused on numeracy.
Chapter 2: Assessment of numeracy
The following analysis is taken from the results of pupils completing all three elements of the assessment (two written booklets and the pupil teacher interaction). Effective sample sizes on this basis were 3,679 in P4, 3,682 in P7 and 3,877 in S2. Results were weighted to account for different school sizes, the small number of non-participating schools and gender and deprivation differences between the sample and the population.
2.1 Overall distribution
Chart 2.1 shows the distribution of marks for each of the three levels assessed. The chart shows that at each level there was a broad range of marks. There were similar levels of performance in P4 and P7, with lower levels in S2. Half of pupils in P4 scored over 64 per cent, half of pupils in P7 scored over 63 per cent, and half of pupils in S2 scored over 44 per cent.
Chart 2.1: Distribution of scores in each stage

"0 up to 10" includes 0 and all values up to but not including 10, etc.
Chart 2.2 shows the estimated percentages of pupils in each of P4, P7 and S2 grouped into the four reporting categories defined in the introduction to this report.
At P4, an estimated 76 per cent of pupils performed "well" or "very well" i.e. they achieved at least 50 per cent when assessed against the experiences and outcomes of the relevant CfE level for their stage. At P7, about 72 per cent of pupils performed "well" or "very well" when assessed against the relevant CfE level for their stage. At S2, about 42 per cent of pupils performed "well" or "very well" when assessed against the appropriate CfE level for their stage.
The percentage of pupils who performed "very well", i.e. who got at least 75 per cent, is fairly constant between P4 and P7 at just under 30 per cent, but falls to about eight per cent at S2. Likewise, the percentage of pupils "not yet working within the level" appropriate for their stage is less than two per cent at P4 and P7, but rises to 32 per cent at S2.
Chart 2.2: Percentage of pupils in each of the reporting categories, by stage

2.2 Attainment by Gender
In P4 and P7 boys outperformed girls, with about a five percentage point difference in the proportion of pupils performing "well" or "very well". There was insufficient evidence of a difference in S2.
For both boys and girls, there was an underlying pattern of decreasing attainment relevant to the appropriate level for the three survey stages, with the largest drop evident between P7 and S2.
Chart 2.3: Percentage of pupils performing "well" or "very well" at the relevant level, by gender

2.3 Attainment by Deprivation
Pupils from areas of least deprivation2 continue to have significantly higher attainment than pupils from the most deprived areas, at all stages. All differences are statistically significant except between areas of "middle" and "least deprivation" in P7. The largest differences between pupils of different deprivation categories are at S2, where 44 per cent of pupils from the more deprived areas were "not yet working within the third level".
Chart 2.4 Percentage of pupils performing "well" or "very well" at the relevant level, by deprivation

Chart 2.5 shows the profile of performance of S2 pupils from the three deprivation groupings. The charts for the other two stages are available in the data tables. The charts show that the "middle" group's performance profile appears more similar to the areas of high deprivation.
Chart 2.5 - Distribution of scores, by deprivation grouping, S2

"0 up to 10" includes 0 and all values up to but not including 10, etc.
2.4 Attainment by type of task
Pupils at all stages gave the highest percentage of correct answers to questions where data & analysis was the main topic being assessed, together with money in P4 and number & number processes in S2. Items assessing fractions, decimal fractions & percentages and measurement appeared to be the most difficult. Learning and teaching resources aimed at the areas that pupils found the most challenging are being made available on the Education Scotland website.
Chart 2.6: Percentage of correctly answered questions, by subject, sorted at P7 (whilst individual questions may have assessed pupils against multiple areas of numeracy, questions are categorised according to the main topic they were assessing)

Pupils attempted assessment booklets in three different formats. About 60 per cent of marks were from short individual questions, usually set within a specific context. About a quarter of marks were from a series of questions linked to stimulus datasheets, and the remaining marks were from pupil teacher interactions covering mental maths, estimation and one of money, measurement or chance and uncertainty.
In all three stages pupils generally found the short questions the most challenging, with 60, 58 and 44 per cent of tasks successfully completed in P4, P7 and S2 respectively. In P4, pupils were most successful in the linked stimulus tasks, with a 68 per cent success rate, in P7 there was little difference between the stimulus tasks and the interactions, while in S2 pupils were most successful with the interactions, achieving 49 per cent of tasks.
2.5 Mental Maths
As part of the pupil teacher interaction element of the survey, each pupil attempted four questions in mental maths, one for each of addition, subtraction, multiplication and division. Two questions were asked using prompt cards so that pupils could see the figures written down while not writing anything down themselves, and two were asked without the pupil being able to see the numbers. There was also a mixture of questions set in context and not set in context.
Overall pupils successfully completed 60 per cent of mental maths tasks in P4, 65 per cent in P7 and 46 per cent in S2. This was fairly similar to the success rate of tasks in the rest of the survey. The following chart shows the success rate for each operator.
Chart 2.7 Percentage of correctly answered questions in mental maths, by operator and stage
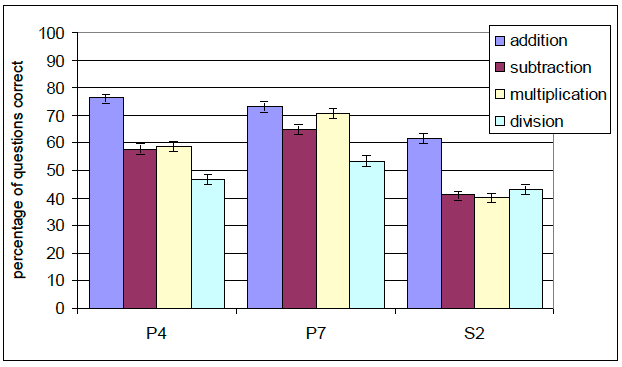
Although higher performance may have been expected where pupils could see mental maths questions written down (compared to when they were not able to see the numbers), no clear pattern of this was shown in the results. This may have been due to more challenging questions being selected for having written prompts. Further analysis of this issue will be carried out in due course.
Contact
Email: Marion MacRury
There is a problem
Thanks for your feedback