Scotland's seas: towards understanding their state
Scotland's seas: towards understanding their state.
Chapter 4 Healthy and Biologically Diverse Seas
INTRODUCTION
Scotland's seas are positioned between subpolar and subtropical influences and support a spectacular and diverse assemblage of habitats and species. The inshore waters (out to 12 nm) cover an area of ~88,600 km 2, greater than the whole landmass of Scotland and comprise a broad range of habitats. Some of the most characteristic of these include sheltered sea lochs, wave exposed rocky coasts, long sweeping sandy bays, and small and large estuaries and firths. Factors, such as wave exposure, tidal currents, depth, turbidity, and tides influence the nature of the habitats and communities of animals and plants found living there.
There is a long and distinguished history of marine research and survey in Scotland. Two of the oldest marine research laboratories in the world are at Millport on the Clyde and the Gatty Marine Laboratory at the University of St Andrews; both established in 1884, only nine years after the oldest marine laboratory in the world, the Stazione Zoologica in Naples. These laboratories were followed shortly afterwards by the establishment in 1899 of the Fisheries Research Laboratory (now FRS) in Aberdeen. Much invaluable work has been carried out over the years at these institutes together with other groups including the University of Aberdeen, Heriot Watt University and the Scottish Association for Marine Science ( SAMS) (Dunstaffnage), which emerged from the original foundation of the Millport Laboratory in 1884. In more recent times, the Marine Nature Conservation Review ( MNCR), started by the Nature Conservancy Council in the 1980s and continued until the late 1990s under the auspices of the Joint Nature Conservation Committee ( JNCC), together with the targeted surveys and seabed mapping undertaken by SNH, have further contributed to our growing wealth of knowledge about the biological diversity of the seas.
Despite all this interest and research there remains much to be explored and discovered about the marine wildlife of Scotland. The current best estimate of the total number of species of marine plants and animals (including both invertebrates and vertebrates) in Scottish waters is in the order of 6,500. If the microbial flora is included in the total then the number of species in Scottish waters is around 40,000. New species are continually being added to these lists; the majority of these additions are the results of better and more sophisticated survey and sampling and serve to further enhance the biological diversity of our seas, but others are less welcome non-indigenous and invasive species, which become established as a result of being introduced in ballast waters and other human vectors. Global climate change is affecting the distribution of some native marine species and could ultimately result in some species becoming extinct in Scottish waters whilst they may be replaced by other species more adapted to warmer water.
To ensure the long-term health of the marine ecosystem it is essential to maintain the ecological balance of this highly complex and dynamic environment, for example by ensuring sustainable exploitation and stewardship of marine resources and by protecting key biodiversity features.
The concepts of healthy and biologically diverse seas are enshrined in the proposed European MSFD as part of what comprises GES (see Chapter 1). Marine ecosystems are communities of plants and animals interacting with each other and with their environment. A healthy ecosystem is one:
- not suffering any loss of productivity or carrying capacity (i.e. where resources are used within their capacity for regeneration, and where nothing detracts from the overall variety and quality of the natural heritage); and
- fully able to deliver the services that support all life.
Ecosystem health is associated with resilience - being capable of coping with disturbances, such as storms, pollution, or harvesting pressure, without losing overall structure and ability to function. Thus healthy ecosystems can recover from, or adapt to, change. Furthermore, in a healthy ecosystem evolutionary forces may cause some species to decline or become extinct whilst allowing new species to evolve or increase to fill the niche.
Loss of marine ecosystem health may be identified from symptoms such as the build-up of waste material and the proliferation of simpler life forms that thrive on it, or the loss of keystone species unbalancing ecological relationships (as demonstrated by significant and rapid changes in the abundance of a small number of species). Other symptoms of poor ecosystem health include the presence of bioinvaders, the loss of biological diversity or a higher rate of mortality within key species caused by disease rather than predation, climate, or food scarcity.
With such a diverse, and dynamic environment the challenge is in identifying characteristics that are sufficiently generic, but at the same time specific, that can be used to adequately describe the sea as healthy and biologically diverse. On this basis it is proposed to adopt the relevant qualitative descriptors for determining good environmental status as presented in the MSFD (Table 4.1).
In describing the health and biological diversity of the seas it is important to be able to assess if the desired conditions are being met or maintained. In the marine environment it is impossible to aspire to measure everything and it is thus necessary to identify some key indicators that can act as a window to its overall health.
The Scottish Biodiversity Forum coordinated work that led to the publication in 2007 of Scotland's Biodiversity Indicators(1) which identified 17 state indicators across the terrestrial, freshwater and marine realms. Of these, five are of particular relevance to the marine environment and report on its health and the continuing biological diversity (Table 4.2). Others are of more marginal relevance, and it is likely that additional indicators will be needed to fully report on the health and state of marine biodiversity.
Table 4.1 Qualitative MSFDGES descriptors for healthy and biologically diverse seas
MSFD Annex I GES Descriptor |
|---|
GES Descriptor 1 - Biological Diversity is maintained. The quality and occurrence of habitats and the distribution and abundance of species are in line with prevailing physiographic, geographic and climatic conditions |
GES Descriptor 2 - Non-indigenous species introduced by human activities are at levels that do not adversely alter the ecosystems |
GES Descriptor 3 - Populations of all commercially exploited fish and shellfish are within safe biological limits, exhibiting a population age and size distribution that is indicative of a healthy stock |
GES Descriptor 4 - All elements of the marine food webs, to the extent that they are known, occur at normal abundance and diversity and levels capable of ensuring the long-term abundance of the species and the retention of their full reproductive capacity |
Table 4.2 Scottish Biodiversity Indicators of particular relevance to the marine environment
Indicator and Code |
Evidence Source |
Current trend |
|---|---|---|
Abundance of breeding seabirds (S5) |
UK Seabird Monitoring Programme |
Deteriorating |
Marine Plankton (S14) |
Data from UK Continuous Plankton Recorder |
Divergence |
Estuarine Fish (S15) |
SEPA and FRS monitoring programmes |
Improving |
Marine Fish Stocks within safe limits (S16) |
Population estimates from models based on fish landings data |
Fluctuating |
Non-native species (S17) |
Geographical distribution of known non-native species |
Deteriorating |
EVIDENCE THAT THE SEA IS HEALTHY AND BIOLOGICALLY DIVERSE
Many of the indicators of a clean and safe sea may be used to determine if Scotland's seas are healthy and biologically diverse. For example, the concentration of contaminants in seals is an indicator of both the cleanliness of the marine ecosystem, as well as the health of marine mammals. Many of these data are the result of site condition monitoring, conducted by SNH to fulfil obligations under the EC Habitats Directive and requiring a six-yearly reporting cycle. Fisheries stock assessments are conducted regularly by FRS (see Annex 2). The scale at which species abundance data are collected vary from a small number of select coastal sites, to all of Scotland's coastal and offshore seas. Increasingly, European Directives are paying more attention to the general ecological health of the marine environment. The existing WFD relies heavily on measures aimed at assessing the health of transitional and coastal ( TRAC) waters with the forthcoming MSFD following similar lines but extending further off shore to national territorial limits. Results of these WFD assessments will be communicated as a ranking in a classification scheme. Table 4.3 summarises some of the available data that could be used to determine if Scotland's seas are healthy and biologically diverse.
Marine biological data are reported under a range of mechanisms. Principal among these is the requirement upon SNH to monitor and report upon the condition of each qualifying feature within the Natura network (i.e. the habitats and species listed under Annexes 1 and 2 of the EC Habitats Directive, for which Special Areas of Conservation ( SAC) (Figure 4.1) have been designated (see Tables 4.4 and 4.5), and rare or vulnerable bird species listed under Annex 1 of the EC Wild Birds Directive, for which Special Protection Areas ( SPA) have been designated (Figure 4.2)). Information on the condition of each qualifying feature is reported both to the JNCC, to facilitate UK reporting to Europe, and to the Scottish Government [A].
The Natura reporting mechanism records the condition of features within designated sites but not their condition outwith such areas (although JNCC prepares, on a six year cycle, Favourable Conservation Status Assessments of all the habitats and species listed in the Annexes of the EC Habitats Directive, based on best available information). These assessments are based upon species and habitat ranges across the UK rather than in Scotland alone. However, not all the marine habitats and species considered of national importance to Scotland are represented in these European Directives, but instead are contained on the Scottish Biodiversity List which contains 109 marine species and 88 marine habitats in Scotland [B].
Apart from Natura sites, the condition of notified features within all Sites of Special Scientific Interest ( SSSI) is also monitored and reported upon by SNH on a six-yearly cycle, though in the marine environment this designation is limited to intertidal areas [C].
Marine biological data, such as species records, collected through the SNH Site Condition Monitoring programme, and other marine surveys that it funds, are uploaded onto a database (Marine Recorder) and forwarded to JNCC for public dissemination via the National Biodiversity Network Gateway (2). Spatial data, such as habitat maps, collected through such surveys are also forwarded to JNCC for collation and dissemination through the MESH (Mapping European Seabed Habitats) project (3). All published SNH marine survey reports are also available through the SNH website (4). To facilitate collaboration on planned marine surveys, as well as exchange of data, scientists from FRS, SEPA, SNH, Scottish Government and academia meet twice yearly through the Marine Biodiversity Research Coordination Group, established in 2006 through the Scottish Biodiversity Strategy.
Table 4.3 Summary of data collected that could indicate whether Scotland's seas are healthy and biologically diverse seas
Indicators of healthy and biologically diverse seas |
Data collectors |
|---|---|
Habitat extent and condition |
FRS, National Oceanographic Centre ( NOC), SAMS, SNH, University of Plymouth |
Litter |
Cefas, Local Authorities International Environmental Organisation ( KIMO), Marine Conservation Society, Plymouth University, SEPA, Zoological Society of London |
Sea temperature |
FRS, ICES, Met Office, SAMS, SEPA |
Seabed erosion and sediment change |
SEPA, SNH |
Species abundance and distribution |
FRS, SAMS, Sea Mammal Research Unit ( SMRU), SNH |
Species as indicators of change |
British Trust for Ornithology ( BTO), FRS, JNCC, Marine Biological Association ( MBA), SAMS, SEPA, SMRU, SNH |
Species or biological communities as indicators of pollution |
FRS, SEPA, SMRU, SOTEAG, SNH, University of Aberdeen, Glasgow Caledonian University, University of Stirling |
Figure 4.1 Marine Special Areas of Conservation in Scotland
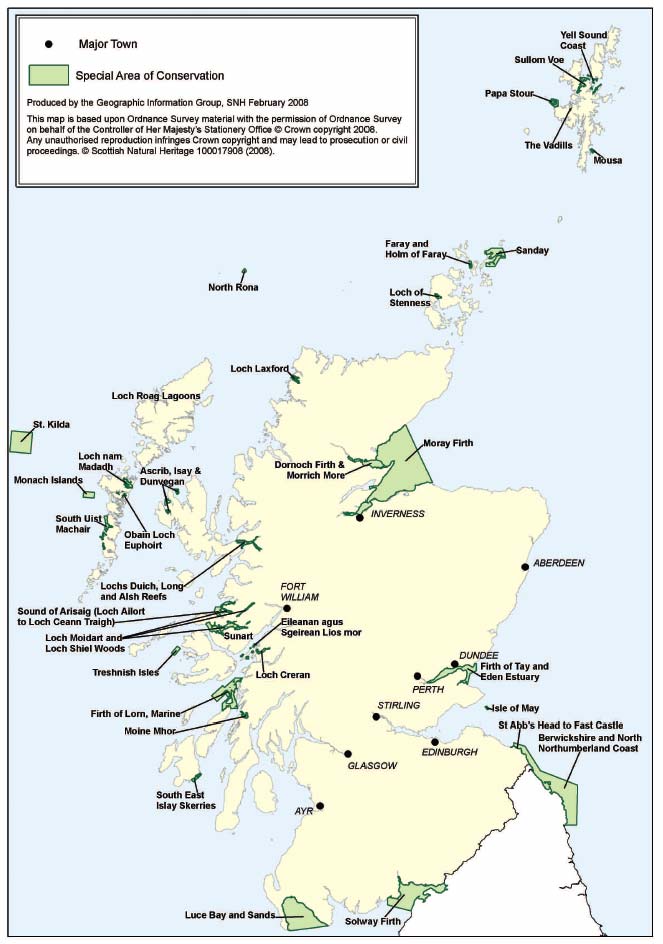
Figure 4.2 Coastal Special Protection Areas in Scotland
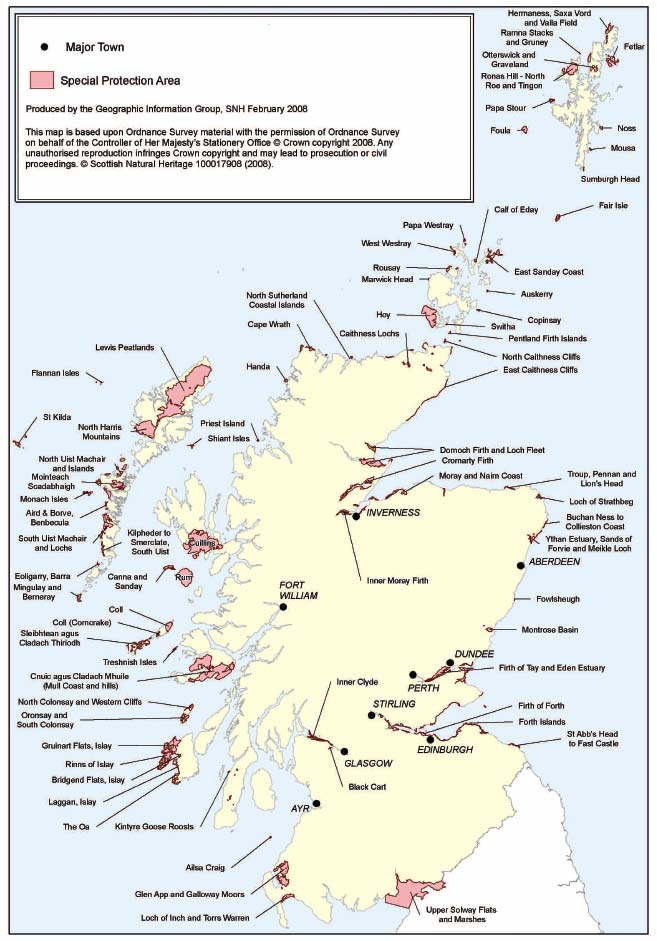
Table 4.4 Marine habitats listed under Annex 1 of the Habitats Directive for which Scottish SACs have been designated
Sandbanks which are slightly covered by sea water all the time |
Submerged or partially submerged sea caves |
Estuaries |
Mudflats and sandflats not covered by seawater at low tide |
Coastal lagoons |
Large shallow inlets and bays |
Reefs |
Table 4.5 Marine species listed under Annex 2 of the Habitats Directive for which Scottish SACs have been designated
Bottlenose dolphin |
Grey seal |
Common seal |
Plankton
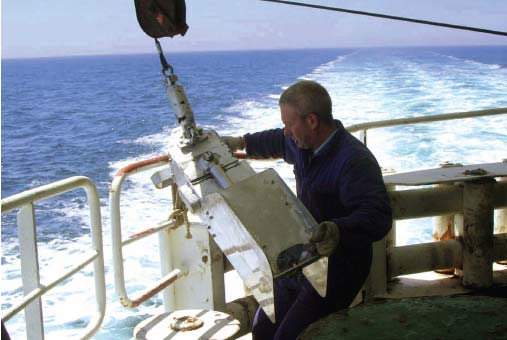
Plankton are the microscopic plants and animals that inhabit the pelagic zone and are typically free-floating, although many are capable of independent vertical movement and can swim up and down in the water several hundred metres per day. They are widely recognised to be some of the most important organisms on Earth. Both phytoplankton (Figure 4.3) (microscopic plants) and zooplankton (microscopic animals) are at the lowest levels of the food chain in all marine ecosystems and constitute a vital food-source for many higher level animals. A number of aspects of marine environmental and ecosystem health can be measured by looking at different components of plankton abundance: for example a measure of phytoplankton colour index ( PCI) is an indicator of phytoplankton biomass, whilst the relative abundances of two closely related zooplankton copepods influenced by sea-water temperature provides evidence of climate change effects. In Scotland long-term records from the Continuous Plankton Recorder ( CPR) (Figure 4.4) are available (Case Study 4.1).
Figure 4.3 Diverse diatoms from Scottish waters (phytoplankton)
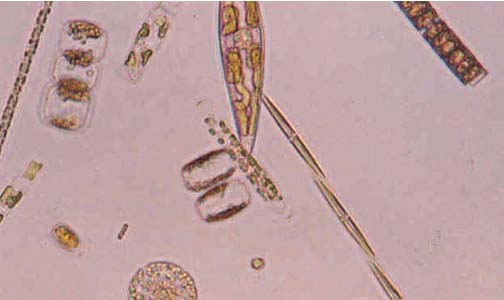
Figure 4.4 Continuous Plankton Recorder being deployed
CASE STUDY 4.1 Analysis of Continuous Plankton Recorder ( CPR) Data
The CPR is a high-speed plankton sampler, designed to be towed by merchant ships, which collects plankton for later examination in the laboratory. Starting in the 1930s, and especially since 1946, the CPR has been used on a changing network of routes across the North Sea and North Atlantic, and has provided a unique long-term set of biological data covering large parts of the UK seas. Four of the current (2006) survey routes pass through Scottish waters (Figure 4.5), providing a record of the species encountered and their abundance along the ship's regular sailing route (5).
The 'A' route, from Shetland to Aberdeen, is one of the longest continuously sampled routes in the CPR survey, with more than 60 years worth of data available. The route passes through an important area where oceanic water from the Atlantic Ocean enters the North Sea (Figure 4.6). A variety of ecological changes in the North Sea have been attributed to variations in this inflow. Analysis of CPR data from this route are investigating the changes that have taken place in this area and how they relate to broader scale changes [D].
Figure 4.5 CPR survey routes in Scottish waters in 2006
Lerwick to Aberdeen (A); Humber to Sule Skerry ( LR); Aberdeen to Norway (M); and Iceland to Sule Skerry (V)
Figure 4.6 Atlantic inflow to the north-western North Sea
The approximate paths of the Shelf Edge Current, Fair Isle Current ( FIC) and East Shetland Atlantic Inflow ( ESAI), in relation to the CPR A-route from Shetland to Aberdeen. The 200 m depth contour is also shown.
The occurrence in the North Sea of certain Atlantic plankton 'indicator species' has long been used as an indirect index of the strength of the Atlantic inflow. Figure 4.7 shows one such index which indicates that there was a period of relatively strong inflow around 1960, followed by a lengthy period from about 1965 to 1985 during which inflow was relatively low. Since 1985 there have been more peaks and troughs in the index, suggesting greater variability in the inflow.
Figure 4.7 Atlantic Inflow Index from CPR 'A' route samples, 1946-2005
The index is the mean standardised annual abundance of the copepods Candacia armata and Metridia lucens, two 'classic' indicator species (6).
Warm water plankton
Figure 4.8 shows the abundance of Euchaetahebes, a species that originates from the Bay of Biscay area (south of 50°N) and is associated with the inflow of warmer Atlantic water to the North Sea. E. hebes was almost entirely absent from the 'A' route samples prior to the mid-1980s, but has since increased dramatically in abundance. Influxes of this species to the North Sea about 1990 and 1997 have been reported previously (6,7) but there was a further dramatic increase after 2000, peaking in 2004. This is consistent with the known northwards shift in the distribution of warm water plankton, although it provides more detail of the timing and variability of the shift. There are indications that seabird breeding success in Shetland was lower in years when there were more warm water plankton. It may not be a coincidence that 2004, which saw unprecedented numbers of E. hebes and other warm water species, was the worst year on record for seabird breeding success in the North Sea (8).
Cold water plankton
In contrast, the abundance in 'A' route samples of Calanus finmarchicus, a species associated with colder more northerly waters, has changed little over the past few decades (Figure 4.8). This does not appear to be consistent with the general decline in the abundance of this species in the North Sea in recent decades, or with reported northwards retreat in the distribution of colder water plankton. The reasons for this remain unclear.
Conclusions
The CPR survey data have revealed major biological changes in the plankton in the seas around the UK over the last few decades (9,10). As well as a 'regime shift' in the North Sea in the mid-1980s, there has been a pronounced general northwards shift in the distribution of warm water plankton (by about 10° of latitude), and a parallel retreat to the north in the distribution of cold water plankton. These changes are associated with increasing sea temperatures, and have been linked to global warming.
While the broad picture of such changes across the North Sea and North-East Atlantic has already been described, patterns of change may be more varied on a smaller scale. Further analysis of these, and other, CPR data in Scottish waters could provide more detailed information on changes over smaller geographical areas and of the impact that these changes have on other components of the marine ecosystem.
Figure 4.8 Abundances of Euchaeta hebes (warm water) and Calanus finmarchicus (cold water) in CPR 'A' route samples from 1946 to 2005 (mean annual abundance per sample)

Phytoplankton
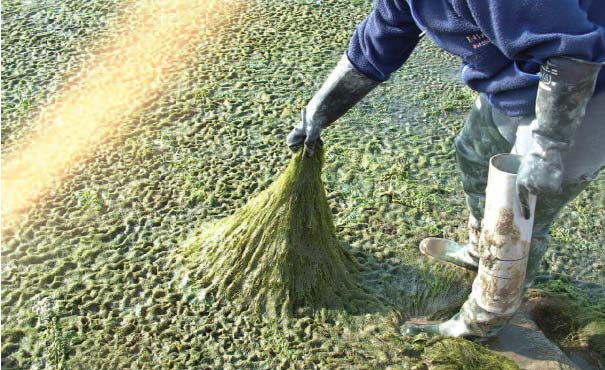
Phytoplankton are the microscopic plants at the base of all food chains. They live in the surface waters where there is sufficient light to support photosynthesis and include diatoms, cyanobacteria and dinoflagellates. In normal circumstances phytoplankton are considered beneficial and essential to marine life, but a small number of species produce highly potent toxins that can accumulate in filter-feeding shellfish, such as mussels and scallops, destined for human consumption. In such circumstances fisheries have to be closed and fishermen suffer through loss of earnings. Algal blooms (Figure 4.9) may have other harmful effects including causing mass kills of marine fauna, mild toxicity to bathers as well as reduced aesthetic quality of affected waters. The number of species of phytoplankton in Scottish waters has been estimated at around 2,150 but new species are continually being recorded including some harmful non-native species that have been introduced through ballast waters and other human sources. A coastal ecosystem monitoring site was therefore established off Stonehaven in 1997 to monitor the state of the marine ecosystem in the north-east of Scotland. These data are currently allowing an assessment of the phytoplankton community, as well as identifying changes in phytoplankton diversity and abundance that occurs over time. Analysis of ten years of data from this site has revealed important variations in the phytoplankton community, see Case Study 4.2.
Zooplankton
Zooplankton are typically microscopic or small protozoans and metazoans (e.g. copepods and amphipods), but also include much larger organisms such as jellyfish. Also included in the zooplankton are the free-floating eggs and larvae of a wide range of larger animals including fish, crustaceans and molluscs. Zooplankton are a major component of the diet of many fish and birds, and are therefore an essential link between the base of the food web (primary producers) and higher level consumers. Detectable changes in the abundance or species composition of zooplankton may therefore reflect fundamental changes in the ocean environment, including providing early indications of imminent changes in food availability for fish, birds and mammals. Because many zooplankton are relatively short-lived and are capable of high growth rates, they respond quickly to environmental perturbations that influence diversity, such as point-source pollution and predation pressure. Growth and development rates are well known to depend strongly on water temperature, thus changes in zooplankton may provide an early warning of temperature increases in the ocean, see Case Study 4.3.
Figure 4.9 Chaetomorpha bloom in the Ythan Estuary
CASE STUDY 4.2 Stonehaven ecosystem monitoring site - Phytoplankton
Phytoplankton biomass
The algal pigment chlorophyll a is used as a proxy to estimate phytoplankton biomass in the system. The annual chlorophyll a cycle at this site is shown in Figure 4.10a. The concentrations are typical for northern North Sea regions with low winter concentrations (< 1.0 µg. l -1) from November to March, usually rising to the highest levels during the rapid phytoplankton growth period from April - June. Chlorophyll a concentrations show extreme variability from year to year during the spring and summer months. Individual years fall into two categories. First, a group comprising 1997-2000, 2005 and 2006, (Figure 4.10b) which exhibited a peak in concentration during May/June followed by declining values towards minima in November/December. Second, a group comprising 2001-2004 (Figure 4.10c) during which the May/June peak was absent and instead, maximum values occurred during August/September.
Phytoplankton abundance and diversity
Phytoplankton show considerable seasonal and interannual diversity at the Stonehaven site with different genera dominating the community at different times of year. Diatoms tend to be more abundant in the spring and autumn. A marked shift can be observed in the data from 2002 (Figure 4.11a). The main diatom bloom in May/June, dominated by the genus Chaetoceros from 1998-2001, has disappeared. Since 2002 this spring diatom bloom is now dominated by the genus Skeletonema which is observed earlier in the year. Dinoflagellates show periods of maximum abundance during the summer months.
A period of low dinoflagellate cell density was observed from 2001-2004 (Figure 4.11b) with previously dominant genera such as Ceratiumand Dinophysis showing decreased abundance. Potential toxin producing genera are routinely observed as part of the phytoplankton community at this site.
Figure 4.10 Monthly averaged chlorophyll 'a' values over the annual cycle
a Monthly midpoint chlorophyll a values.
b Midmonth values of chlorophyll a during years where spring concentrations exceeding 2.5 µg chl'a'.l -1
c Midmonth values of chlorophyll a during years where spring concentrations did not exceed 2.5 µg chl'a'.l -1
Figure 4.11 Monthly average observations of (a) diatoms and (b) dinoflagellates at Stonehaven over 1997-2007
Conclusions
Considerable variation has been observed in the biomass and abundance of phytoplankton at this site over the last 10 years. The short duration of this time series makes it difficult to determine if these changes will become established in the system or are part of a multi-annual cycle. In future years, as this time series increases in duration, it will provide valuable data which will improve our understanding of the dynamics of the phytoplankton community in Scottish waters as well as their response to environmental drivers such as climate change.
Summary Assessment
Parameter |
Geographical region |
Key factors & pressures |
What the evidence shows |
Trend |
Status now |
Confidence in assessment |
Reason for overall status |
|---|---|---|---|---|---|---|---|
Phytoplankton community dynamics |
East coast of Scotland - Stonehaven |
Climatic factors Input of nutrients to the system Grazing pressures |
Considerable seasonal and interannual variation in diversity and abundance Change in composition of the spring bloom since 2002 Period of low chlorophyll a concentrations from 2001 - 2004 |
II |
Currently the 10 year duration of this time series is relatively short. Future years will show if the changes identified here will become established within the phytoplankton community or are part of the seasonal and interannual variation in this system. |
CASE STUDY 4.3 Stonehaven ecosystem monitoring site - Zooplankton
A wide range of samples of small, medium and large zooplankton have been collected on a weekly basis at the Stonehaven ecosystem monitoring site (c.f. Case Study 4.2), established in January 1997. The sampling routine has remained consistent over the past decade with only minor modifications to sampling equipment having been necessary.
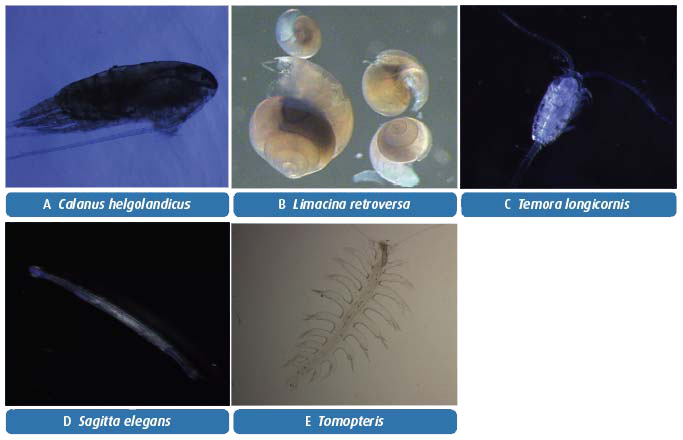
Taxonomic analysis of zooplankton is time consuming; with >250 species and developmental stages routinely identified. The species with highest abundances and biomasses are mostly crustaceans and of these most are copepods with Acartia clausii, Temora longicornis, Pseudocalanus elongatus and Calanus being most common. Other highly abundant non-crustacean species include larval stages of several kinds of benthic invertebrates, along with hard shelled molluscs such as the pteropod Limacina retroversa and soft-bodied predators such as the arrow worms Sagitta spp. (Table 4.6 and Figure 4.12).
Figure 4.12 Some of the commonly occurring species of zooplankton at the Stonehaven ecosystem monitoring site
The results for abundance (both density and standing stock) and biomass are aggregated on a monthly and annual basis. This shows that the 10 most frequent species always account for more than 90% of the total abundance of all recorded species. There are inter-annual differences in total abundance and biomass of zooplankton between 1999 and 2006 (Figures 4.13 and 4.14). These fluctuations are strongly linked with the mean sea temperature. By examining the monthly means an exponential relationship appears between the monthly mean temperatures and the zooplankton abundance and biomass.
These broad analyses indicate that the annual seasonal cycles of the zooplankton assemblage off the east coast of Scotland clearly respond to changes in sea temperature and food availability (Figure 4.15), and are thus potentially vulnerable to climatic changes. Given that the detailed analysis is currently limited to eight years (1999 - 2006) it is not yet possible to determine if these observed changes are part of long-term cycles and trends (e.g. decadal) or are responses to anthropogenic effects.
The underlying detailed species occurrences, compositions and succession of individual species are now being analysed to consider their seasonal fluctuations in relation to the environmental variations, and in comparisons with other observations.
Figure 4.13 The annual totals of zooplankton species abundances found in the 200 µm-mesh samples
The black lines show the average annual temperature measured at 1m depth (values on the right-hand axis).
Figure 4.14 The annual totals of estimated biomass (dry weight) found in the 200 µm-mesh samples
The black lines show the average annual temperature measured at 1m depth (values on the right-hand axis).
Figure 4.15 Time series of three important elements in the ecosystem productivity, nitrate, chlorophyll (phytoplankton) and copepod abundance
Table 4.6 Species and groups occurring in the 10 highest ranks of aggregated annual abundance and biomass between 1997 and 2006
Groups |
Species |
Abundance |
Biomass |
|---|---|---|---|
Copepods |
Acartia clausii |
Y (30.4%) |
Y (10.9%) |
Calanus helgolandicus (Late stage and adults) |
Y (0.8%) |
Y (7.5%) |
|
Calanus spp. (Younger stages) |
Y (1.2%) |
Y (1.7%) |
|
Centropages hamatus |
Y (1.4%) |
Y (1.2%) |
|
Oithona spp. |
Y (10.4%) |
Y (5.9%) |
|
Paracalanus parvus |
Y (2.2%) |
Y (0.9%) |
|
Pseudocalanus elongatus minutus |
Y (10.7%) |
Y (4.5%) |
|
Temora longicornis |
Y (6.2%) |
Y (5.1%) |
|
Calanus finmarchicus (Late stage and adults) |
N |
Y (0.9%) |
|
Other crustaceans |
Podon spp. |
Y (1.4%) |
Y (1.5%) |
Parathemisto spp. |
N |
Y (0.6%) |
|
Decapod larvae |
N |
Y (5.6%) |
|
Cirripeds |
Y (2.3%) |
N |
|
Evadne nordmanii |
Y (0.9%) |
N |
|
Hard shelled |
Limacina retroversa |
Y (0.9%) |
Y (0.6%) |
Lamellibranch larvae |
Y (4.4%) |
N |
|
Echinoderm larvae |
Y (2.2%) |
N |
|
Worm-like |
Appendicularia |
Y (6.5%) |
Y (20.2%) |
Phoroni spp. |
N |
Y (0.2%) |
|
Poychaeta larvae |
Y (2.8%) |
Y (1.1%) |
|
Sagitta spp. |
Y (1%) |
Y (1.3%) |
|
Jellyfish |
Coelenterates |
N |
Y (9.8%) |
Pleurobrachia pileus |
N |
Y (1.4%) |
|
Other |
Cyphonautes larvae |
Y (2.2%) |
N |
Percentages are overall values for the full time series. The Y indicates a species that has occurred in the top 10 ranking. The N indicates that it has not been among the 10 highest ranked for either biomass or abundance. (Some smaller organisms like small hard shelled larvae only rank in abundance, but make up little biomass, while larger organisms like jellyfish make up a significant proportion of the biomass while only consisting of relatively few individuals.)
Summary Assessment
Parameter |
Geographical region |
Key factors & pressures |
What the evidence shows |
Trend |
Status now |
Confidence in assessment |
Reason for overall status |
|---|---|---|---|---|---|---|---|
Zooplankton abundance and biomass |
East coast of Scotland - Stonehaven |
Indirect effects through trophic linkage to commercially important species. |
Linkage between abundance/biomass and temperature |
I |
Short monitoring period makes it unclear if temperature linkage is part of long-term cycles |
Many plankton species are sensitive to climate change, with increasing temperature, changes in nutrient fluxes and ocean acidification. Many zooplankton, particularly larval forms and those with calcareous skeletons or components, are sensitive to increasing acidification. Long-term changes in plankton communities and productivity are serious. Major producers of oxygen and CO 2 absorbers, plankton critically mediate Earth's major biogeochemical cycles.
Habitats and benthos
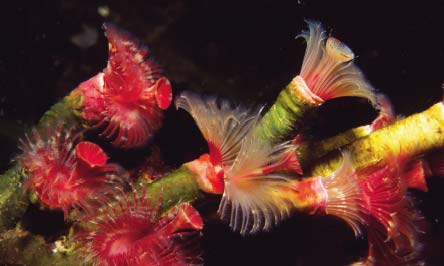
Some of the finest marine habitats in Europe can be found within Scottish waters, including rugged rocky reefs carpeted in soft corals, sea fans and sponges; shallow beds of pink maerl (Figure 4.16) - a delicate coralline seaweed; beds of gaping file shells; saline lagoons; deep mud habitats with burrowing anemones and tall seapens; and fragile and extremely rare tubeworm reefs (found at only a handful of localities in the world) (Figure 4.17). In the deep waters to the east of Mingulay in the Western Isles, there are coldwater coral reefs with remarkably rich associated animal communities (the only known example within UK 12 nm territorial waters). These diverse assemblages of animals and plants living within or on the sea-floor are important both in their own right, providing resources for humans, and as a vital component of the marine food web providing habitat and food for other marine species (11).
Knowledge of the distribution of habitats and species within Scottish territorial waters has improved considerably over recent years, initially through the work of the MNCR and more recently due to the commissioning of marine survey programmes and reviews partly to help support the selection and designation of SACs. Even so, the coverage is widely dispersed and patchy, with substantial sections of the north and east coasts of Scotland remaining especially poorly surveyed (12).
Figure 4.16 Maerl
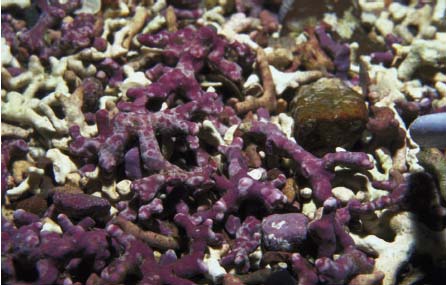
Figure 4.17 Tubeworm reefs
The status of benthic communities and their associated habitats is a function of both natural change and their level of exposure to the wide range of human activities the productive seas support. An overview of these activities is provided in the next chapter and further details on the direct and/or indirect impacts on benthic biodiversity is provided in the supporting documentation to the Scottish Biodiversity Strategy (13).
The adoption of the EC Habitats Directive and the subsequent establishment of a Europe-wide network of high-quality conservation sites, SACs enabled parts of the underwater component of Scotland's natural heritage to be protected from potentially damaging activities for the first time. To date 29 SACs (Figure 4.1) with marine habitat features (and 45 SSSIs with primarily intertidal features) have been identified in Scotland. The important benthic components of these sites are subject to an ongoing programme of cyclical assessment to determine their status via SNH's marine Site Condition Monitoring ( SCM) programme, which started in 2002. A process is currently underway to identify areas that would qualify for designation as SAC in Scottish offshore (i.e. >12 nm <200 nm) waters, thus enhancing further the Natura 2000 network.
SNH assessed the condition of 20 SAC habitat features (approx. 36% of the total number of SAC habitat features (56) from 29 sites) in the first six-yearly monitoring cycle (1998-2004). SNH's programme of broad-scale mapping, undertaken as a pre-cursor to SCM to inform site management needs, underpinned reporting on an additional 16 features. Of the total 36 features assessed thus far, 97% (Figure 4.18) were deemed to be in favourable condition (well above the UK average of ~74% (14)) and this work continues [E].
Two marine SACs have been deemed to be in unfavourable condition as a result of the condition monitoring work. A significant decline in the density of horse mussels was recorded in 2004 from a bed within the Lochs Duich, Long and Alsh Reefs SAC. The cause for the decline was not entirely clear-cut but the survey team witnessed a group of scuba divers loading several large sacks of live horse mussels into a van. It is not known whether this was a commercial operation or an isolated incident. The serpulid worm reefs within Loch Creran SAC have been partially destroyed with the damage attributed to a range of fish farming, vessel mooring and historical fisheries activities (see Case Study 5.5). Given the importance and rarity of the serpulid reefs feature, within Loch Creran there is now a statutory provision under Scottish inshore fisheries legislation to afford the features the highest possible level of protection, prohibiting fishing completely from the areas within the loch where the reefs are located.
Whilst the results of the SCM work generally indicate that Scotland's coastal benthos and habitats (<12 nm) are healthy and biologically diverse, many unknowns remain and the presence of clear evidence of anthropogenic damage to internationally important habitats within the most closely watched inshore areas (which represent a tiny fraction of Scotland's marine environment) raises questions about the long-term sustainability of a number of current activities.
The status of Scotland's benthos cannot be determined solely from the observations of condition within a small number of coastal protected areas, and the distribution and extent of habitats in the wider Scottish marine environment should be considered. However, there are, as yet, no systematic surveys or monitoring programmes to inform this bigger picture assessment. Limited additional contextual information is available through the UKBiodiversity Action Plan ( UKBAP) and the Scottish Biodiversity Strategy ( SBS). The former lists priority species and habitats, as well as action plans, to achieve our commitment of a significant reduction in the current rate of biodiversity loss by 2010 under the international Convention on Biological Diversity. Of the 605 priority species and 60 priority habitats listed that are found in Scotland, 74 and 22, respectively, are marine (Tables 4.7 and 4.8). Experts have identified the top priority actions for at least half of these species to be further research and/or monitoring, without which their protection cannot be ensured. (Table 4.9). More information can be obtained from http://www.ukbap.org.uk/
Figure 4.18 Condition of marine habitats within selected Scottish SACs (1998 to 2004)(15)
Figure 4.19 Fucus distichus
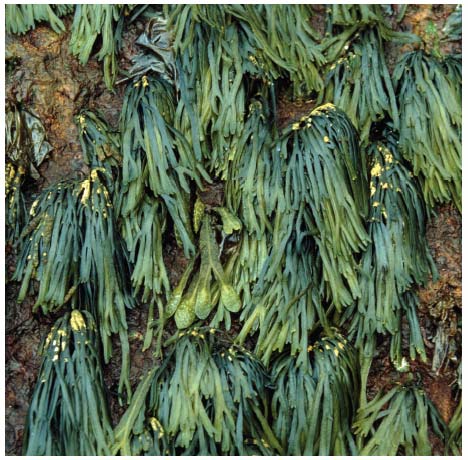
Figure 4.20 Basking shark
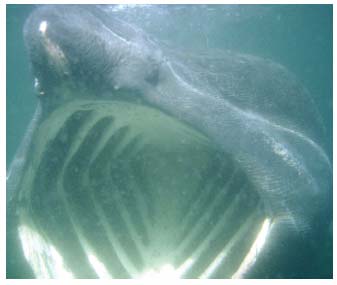
Figure 4.21 Mackerel
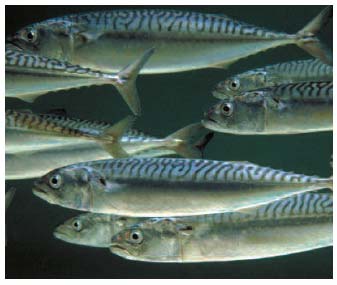
Table 4.7 Priority marine species found in Scotland
Scientific Name |
Common Name |
|---|---|
Ascophyllum nodosum ecad mackii |
Wig wrack or Sea-loch egg wrack |
Cruoria cruoriaeformis |
a red seaweed |
Dermocorynus montagnei |
a red seaweed |
Fucus distichus |
Brown alga (Figure 4.19) |
Lithothamnion coralloides |
Coral maerl |
Phymatolithon calcareum |
Common maerl |
Ammodytes marinus |
Lesser sandeel |
Aphanopus carbo |
Black scabbardfish |
Centrophorus granulosus |
Gulper shark |
Centrophorus squamosus |
Leafscraper shark |
Centroscymnus coelolepsis |
Portuguese dogfish |
Cetorhinus maximus |
Basking shark (Figure 4.20) |
Clupea harengus |
Herring |
Coryphaenoides rupestris |
Roundnose grenadier |
Dalatias licha |
Kitefin shark |
Dipturus batis |
Common skate |
Gadus morhua |
Cod |
Galeorhinus galeus |
Tope shark |
Hippocampus guttulatus |
Long-snouted seahorse |
Hippoglossus hippoglossus |
Atlantic halibut |
Hoplostethus atlanticus |
Orange roughy |
Lamna nasus |
Porbeagle shark |
Leucoraja circularis |
Sandy ray |
Lophius piscatorius |
Sea monkfish |
Merlangius merlangus |
Whiting |
Merluccius merluccius |
European hake |
Micromesistius poutassiou |
Blue whiting |
Molva dypterygia |
Blue ling |
Molva molva |
Ling |
Pleuronectes platessa |
Plaice |
Prionace glauca |
Blue shark |
Reinhardtius hippoglossoides |
Greenland halibut |
Scomber scombrus |
Mackerel (Figure 4.21) |
Solea vulgaris |
Sole |
Squalus acanthias |
Spiny dogfish |
Squatina squatina |
Angel shark |
Thunnus thynnus |
Blue-fin tuna |
Amphianthus dohrnii |
Sea-fan anemone |
Arachnanthus sarsi |
Scarce tube-dwelling anemone |
Arrhis phyllonyx |
a deep-sea shrimp |
Atrina fragilis |
Fan mussel |
Eunicella verrucosa |
Pink sea fan |
Funiculina quadrangularis |
Tall sea pen |
Gitanopsis bispinosa |
an amphipod shrimp |
Haliclystus auricula |
a stalked jellyfish |
Lucernariopsis campanulata |
a stalked jellyfish |
Ostrea edulis |
Native oyster |
Pachycerianthus multiplicatus |
Fireworks anemone (Figure 4.23) |
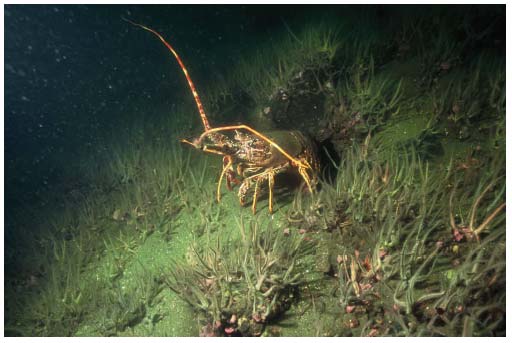
Palinurus elephas |
Crayfish, crawfish or spiny lobster (Figure 4.24) |
Styela gelatinosa |
Loch Goil sea squirt |
Swiftia pallida |
Northern sea fan |
Balaenoptera acutorostrata |
Minke whale |
Balaenoptera borealis |
Sei whale |
Balaenoptera musculus |
Blue whale |
Balaenoptera physalus |
Fin whale |
Delphinus delphis |
Common dolphin |
Eubalaena glacialis |
Northern right whale |
Globicephala melas (melaena) |
Long-finned pilot whale |
Grampus griseus |
Risso's dolphin |
Hyperoodon ampullatus |
Northern bottlenose whale |
Lagenorhynchus acutus |
Atlantic white-sided dolphin |
Lagenorhynchus albirostris |
White-beaked dolphin |
Megaptera novaeangliae |
Humpback whale |
Mesoplodon bidens |
Sowerby's beaked whale |
Mesoplodon mirus |
True's beaked whale |
Orcinus orca |
Killer whale |
Phoca vitulina |
Harbour seal/common seal |
Phocoena phocoena |
Harbour porpoise |
Physeter macrocephalus |
Sperm whale |
Stenella coeruleoalba |
Striped dolphin |
Tursiops truncatus |
Bottlenose dolphin (Figure 4.33) |
Ziphius cavirostris |
Cuvier's beaked whale |
Caretta caretta |
Loggerhead turtle |
Dermochelys coriacea |
Leatherback turtle |
Table 4.8 Priority marine habitats found in Scotland
Intertidal boulder communities |
Sabellaria alveolata reefs |
Coastal saltmarsh |
Intertidal mudflats |
Seagrass beds |
Sheltered muddy gravels |
Tide-swept channels |
Fragile sponge & anthozoan communities on subtidal rocky habitats (Figure 4.22) |
Estuarine rocky habitats |
Seamount communities |
Carbonate mounds |
Cold-water coral reefs |
Deep-sea sponge communities |
Sabellaria spinulosa reefs |
Subtidal sands and gravels |
Horse mussel beds |
Mud habitats in deep water |
File shell beds |
Maerl beds |
Serpulid reefs |
Blue mussel beds |
Saline lagoons |
Figure 4.22 Fragile sponge
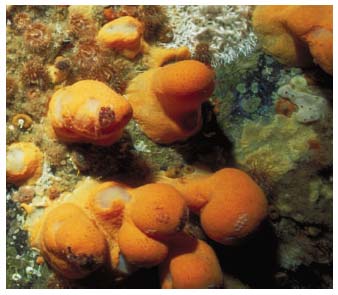
Figure 4.23 Fireworks anemone
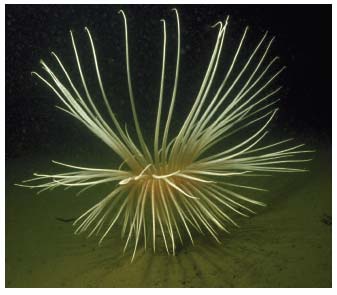
Table 4.9 Species for which the priority action is more research and/or monitoring
Common name |
Survey for |
Research into |
|---|---|---|
Algae |
||
Wig wrack or Sea-loch egg wrack |
|
|
Red seaweed |
|
|
Brown alga |
|
|
Coral maerl |
||
Invertebrates |
||
Sea-fan anemone |
|
|
Scarce tube-dwelling anemone |
|
|
Deep-sea shrimp |
|
|
Fan mussel |
|
|
Pink sea fan |
||
Tall sea pen |
||
Amphipod shrimp |
|
|
Stalked Jellyfish |
|
|
Fireworks anemone (Figure 4.23) |
|
|
Crayfish or spiny lobster (Figure 4.24) |
|
|
Loch Goil sea squirt |
|
|
Northern sea fan |
|
|
Fish |
||
Basking shark |
||
Long-snouted seahorse |
||
Porbeagle shark |
||
Blue shark |
||
Reptiles |
||
Loggerhead turtle |
|
|
Leatherback turtle |
|
|
Mammals |
||
Common dolphin |
|
|
Long-finned pilot whale |
|
|
Risso's dolphin |
|
|
Northern bottlenose whale |
|
|
Atlantic white-sided dolphin |
|
|
Harbour porpoise |
|
|
Striped dolphin |
|
|
Bottlenose dolphin |
|
|
The Scottish Biodiversity Strategy forms the foundation for Scotland's international obligations under the international Convention on Biological Diversity and sets out a 25-year vision to "conserve biodiversity for the health, enjoyment and well being of the people of Scotland now and in the future."[F]
Biodiversity indicators describe change over time in the variety, quantity or distribution of aspects of the natural world and are thus an effective way to measure progress in the delivery of policy commitments. In the recently published Scotland's Biodiversity Indicators, of the five most relevant to the marine environment (Table 4.2) two (breeding seabird abundance, and non-native species) were deteriorating, marine plankton was showing divergence, marine fish stocks within safe limits were fluctuating and estuarine fish were improving.
Work is ongoing to coordinate research, survey and marine data management activities within Scotland. This is essential if understanding is to be improved and the future of these hidden assets is to be safeguarded.
Even less is known about the composition and distribution of offshore and deeper seabed communities largely due to the technological constraints and financial implication of sampling in these waters. Information is slowly becoming available as remote survey techniques improve and there is a greater sharing of data and information collected by commercial operations. What work has been done has revealed an amazing wealth of biodiversity that survives in these deep areas, see Case Study 4.4.
Figure 4.24 Spiny Lobster
CASE STUDY 4.4 Deep sea biodiversity around Scotland
The deep waters around Scotland are really the birthplace of deep sea research starting in the late 1860s by Charles Wyville-Thomson. The area of interest stretches from the Faroe-Shetland Channel in the north out to Hatton Bank in the west and into the Rockall Trough in the south (Figure 4.25).
Numerous different deep water habitats are found in this area ranging from continental margins to deep water troughs and channels through to seamounts and banks. The Faroe-Shetland Channel is probably the most extensively studied deep water area in Europe, and is particularly important as common approaches and sampling techniques have been used throughout the area.
Investigation into the hydrography of the Faroe-Shetland Channel is conducted primarily by FRS in collaboration with researchers from SAMS. The Faroe-Shetland Channel has an unusual and highly dynamic physical environment as a result of a number of water masses converging in this confined channel (16). The water masses flow in different directions; north Atlantic water which is warm and saline flows in a north-easterly direction whilst cold, dense Norwegian Sea water underlies this and flows towards the south-west. Of most interest is the boundary between the warm and cold water masses which occurs at a depth of about 350 - 600 m. At this boundary the temperature of the bottom water can change dramatically over short periods of time, e.g. 7°C in 1 hour.
Biological research, particularly of macrofauna (animals >0.25 mm but < ~3 cm), in the region started again in the mid 1990s as a result of development of the deep water oil industry, with large-scale regional surveys of the west of Shetland sea floor conducted in 1996, 1998, 2000, 2002 and 2006. These have shown that the exponential decline of macrofauna with increasing depth that is often observed in deep water areas, was not seen in the Faroe-Shetland Channel. In fact there was an overall increase in macrofauna abundance with depth in this area.
The macrofaunal diversity patterns were also unusual: there was a peak in diversity and species richness at depths of about 300 - 500 m. This appears to coincide with the warm-cold-water boundary and thus the rapid change in temperature (see Figure 4.26). Peaks in diversity at a mid-depth are also seen in other regions of the deep sea, however they all tend to be at depths greater than those in the Faroe-Shetland Channel. Other factors that appear to influence the macrofauna diversity in the region are sediment grain size, organic matter and especially sea temperature. It is possible that longer term changes in water temperature at intermediate depths influences the faunal community composition.
Figure 4.25 Deep water areas around Scotland
Figure 4.26 Comparison of variation in macrofaunal species diversity and habitat temperature regime in the Faroe-Shetland Channel
Summary Assessment
Parameter |
Geographical region |
Key factors & pressures |
What the evidence shows |
Trend |
Status now |
Confidence in assessment |
Reason for overall status |
|---|---|---|---|---|---|---|---|
Deep sea biodiversity |
Faroe-Shetland Channel |
Water temperature |
Biodiversity in the Channel is strongly linked to water temperature |
|
III |
2-yearly monitoring |
Non-native species
Invasive non-native species are the second greatest threat to global biodiversity (after habitat destruction) and the greatest threat to fragile ecosystems such as small islands. Apart from the cost in biodiversity terms, invasive non-native species can also create a huge economic cost to a very wide range of sectors, probably of the order of several billion pounds annually in the United Kingdom.
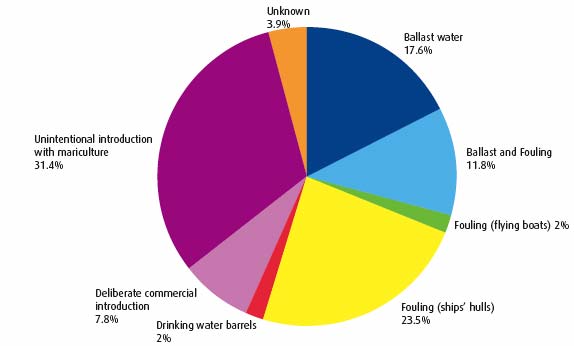
It is estimated that there are around 79 marine and brackish non-native species present in Britain (17) and around 24 of these are present in Scotland. Recent introductions into the marine environment include the large brown seaweed, also known as wireweed (Figure 4.27), into Loch Ryan in 2004 and subsequently into Loch Fyne in 2006 and which has now been recorded as far north as the Firth of Lorn, and the skeleton shrimp which has been found on sites all round Scotland after first being reported in 2004 (18). There are a wide range of vectors that can transport non-native species and for marine species the most important vectors are shipping and aquaculture (Figure 4.29). Shipping can transport species either in ballast water and sediments or as biofouling i.e. attached to the hull (Figure 4.28), anchor chains or other niches around the vessel's hull.
Figure 4.27 Wireweed
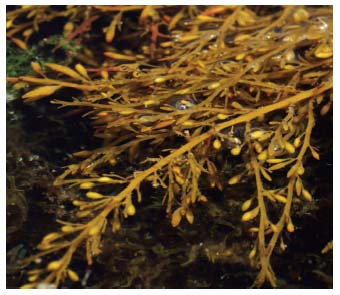
Figure 4.28 Heavily bio-fouled ship hull
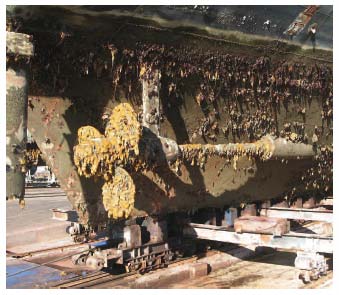
Figure 4.29 Vectors associated with the introduction of non-native species into British waters (19)
In recognition of this risk of introducing species via shipping the International Maritime Organization ( IMO) adopted an International Convention for the Control and Management of Ships' Ballast Water and Sediments in 2004. The Convention has yet to be ratified but aims to have all vessels treating or managing their ballast water to a specific discharge standard, which will be phased in over time depending on the age and size of the vessel. The IMO has now started discussions on the issue of biofouling and will work towards adopting measures to reduce the risk of introducing non native species via this vector. A working group of ICES has produced a Code of Practice for the Introduction and Transfer of Marine Organisms (20), which aims to reduce the risk of introducing non-native species via aquaculture.
These measures will all reduce the risk of introducing non-native species into the marine environment and will also help reduce the spread of species that are already present. However, there is a need for monitoring and port surveys to be undertaken to ensure that the information regarding non-native species is up to date. This is important for providing information for a wide variety of purposes such as risk assessment and updating Scotland's Biodiversity Indicators as for some groups such as invertebrates there is not adequate information available to establish any trends in range expansion (1).
A Great Britain Programme Board was established in March 2005 to deliver strategic consideration of the threat of invasive non-native species across Scotland, Wales and England. A draft Strategy on Invasive Non-Native Species has been developed and aims to minimise the risk posed and reduce the negative impacts caused by invasive non-native species in Great Britain. The final Strategy is expected to be launched by Ministers in spring 2008.
In Scotland, a Scottish Working Group on invasive non-native species provides a forum within which the development of coherent cross-cutting policy on invasive non-natives in Scotland can be pursued and lead responsibilities agreed, and contributes to and supports the effectiveness of wider action on invasive non-native species at the GB level.
Fish
The fish fauna in Scottish waters is diverse and, in terms of abundance alone, one of the most important components of the marine ecosystem. It is estimated that Scotland has a total of 250 fish species (21). There is one species of hagfish, two species of lamprey and 40 cartilaginous fish (sharks, skates and rays). However, by far the largest group is the bony fish (species such as herring and cod) with around 207 species.
There is a substantial scientific literature on the biology and ecology of fish in Scotland but for obvious reasons this literature is dominated by commercial fish species (22). Indeed it is probably true to say that the longest time-series of data in the Scottish marine environment is that collected to support the management of fisheries, see Case Study 4.5. However, for non-commercial fish our understanding of population sizes and trends is relatively limited.
Over the course of the year there is a significant fluctuation in the total biomass of fish found in Scottish waters. Biomass is generally higher in the summer than in winter due to seasonal movements of fish for feeding and/or spawning. Pelagic species (e.g. mackerel (Figure 4.21)) are primarily responsible for this fluctuation as demersal species tend to be less transient.
Figure 4.30 Puffins feeding on sandeels
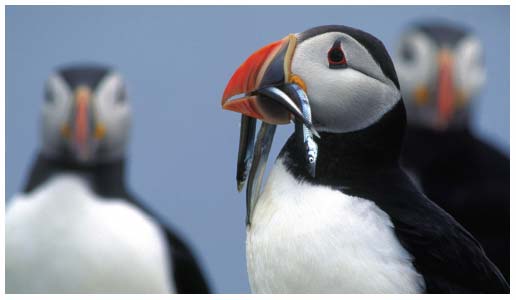
Fish play a vital role in the marine ecosystem and are the primary prey for Scotland's internationally important populations of marine mammals and seabirds. The relationships between fish populations and their predators are highly complex but research over the past three decades has provided valuable insights (23,24) and further studies are underway to better understand the relationships. Other work has focussed on the importance of sandeels (Figure 4.30) as a keystone prey species for other fish, marine mammals and seabirds (25).
Research projects such as these (frequently driven by the need to understand the interactions between fisheries, fish stocks and their predators) apply an ecosystem-based approach to management. Indeed, among the variety of human activities that may have an impact on fish populations the most pervasive is likely to be fishing; studies have shown that fishing has led to reductions in the diversity of fish communities in the north-east Atlantic (26).
Another factor with increasing relevance to the status of Scottish fish populations is climate change. A number of species are at the southern or northern extremes of their distribution; certain boreal or Arctic species, such as the Greenland shark, may venture into the northern North Sea and conversely species of a southern character, such as the red mullet, reach the northern limit of their distribution in Scotland. Consequently, sea temperature rise is likely to lead to changes in Scottish fish fauna, with some species moving in and others moving out. While the full implications of climate change for fish stocks are far from certain there is evidence for change in other components of the ecosystem that are likely to have repercussions for fish stocks. For example, a distinct northward shift in the distribution of plankton communities has been recorded since the 1950s: warmer water plankton species are not replacing the colder water species in similar abundances and this is potentially detrimental to the fish larvae for which these plankton are essential prey (27).
CASE STUDY 4.5 Commercially exploited fish stocks
Populations of fish and shellfish species which are commercially exploited in Scottish and adjacent waters are amongst the most comprehensively monitored and managed components of the marine ecosystem.
For example, FRS conducts 19 regular, repeated annual research vessel surveys targeting different species and different areas during the course of each year. Different survey methods are used depending on the biology and life history of the species under consideration. Surveys using standard fishing trawls are used for demersal fish species such as cod, haddock, whiting, saithe and monkfish. Acoustic surveys contribute to assessing the health of herring stocks, while surveys of egg abundance are used to provide estimates of the size of mackerel stocks. Dredges are used during surveys to assess scallop stocks, and underwater television surveys are used to assess the size of Nephrops (langoustine) populations.
Data from these surveys, combined with data obtained by FRS scientists on commercial fishing boats and at fish markets, undergo rigorous quality checking and are then used in various quantitative methods to assess the size of each targeted stock of fish or shellfish. Since many stocks, such as all of the North Sea stocks, are located in waters shared with other countries and fished by a number of different fleets, data from all the countries involved need to be pooled together before a stock assessment can be performed. The process of data collation and assessment is carried out by the ICES[G]. FRS scientists play a major role in ICES.
Data for each species are grouped across particular areas, depending on what is known about the distribution and life histories of the species. For example, mackerel are assessed across the North-East Atlantic as a whole, as they are widely distributed and undergo significant migrations during their life cycle. Species such as herring, haddock, cod and whiting are assessed for the west of Scotland and the North Sea separately, as it is believed the fish stocks in these two areas are separate. Saithe and monkfish are considered to be single stocks crossing the northern shelf, from the west of Scotland to the North Sea via the north of Scotland. Typically, assessments provide information on the rate that fish are removed from the sea (the fishing mortality rate, F), the size of population capable of reproducing (the spawning stock biomass, SSB) and the number of young fish entering the fishery (recruitment).
Various criteria are used to judge the health of each stock, dependent on the biology and life-history of each species, but also on the quality and type of data available. Mackerel, herring, haddock, cod, whiting and saithe are judged against quite rigid criteria developed by ICES within a Precautionary Approach framework. This defines reference points against which the assessments are compared. In terms of the size of the stock in relation to its ability to maintain stock size through reproduction, three terms are used. Either a stock is at full reproductive capacity, suffering reduced reproductive capacity or somewhere in between these two states and at risk of suffering reduced reproductive capacity. Similarly, in relation to the rate of removal of fish, a stock that is overfished is defined as being harvested unsustainably, while a stock that is being fished at an acceptable level is being harvested sustainably. Owing to uncertainty in the data, a stock can be at an intermediate state and at risk of being harvested unsustainably.
Figure 4.31 shows these terms and how they relate to a traffic-light system of judging the health of a commercially exploited fish stock. Figure 4.32 shows the results of applying the traffic light method to the different stocks of mackerel, North Sea herring, haddock, cod, and saithe.
Unfortunately for herring west of Scotland, whiting in the North Sea and west of Scotland and monkfish on the northern shelf, fishery scientists consider that the existing information they have is not enough to establish where these stocks lie in the traffic-light health system. More work is underway in order to try and fill these gaps. Nephrops (langoustine) are not judged using the same system. However, North Sea Nephrops stocks, in the Fladen Ground, Firth of Forth and Moray Firth, have increased since 1996, are now stable and are probably being exploited sustainably. West of Scotland, in the North Minch, South Minch and Firth of Clyde, stocks are stable or increasing.
Scottish scallop stocks are generally healthy at present, but work is underway towards a quantitative indicator of their health and sustainability.
Figure 4.31 Definition of terms used in the traffic-light method of assessing the health of commercially exploited fish stocks
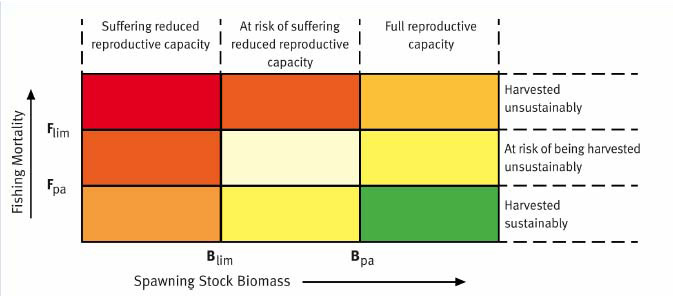
Source: FRS Fish and Nephrops Stocks Information: 2008 http://www.frs-scotland.gov.uk/
Figure 4.32 The traffic-light method of assessing the health of commercially exploited fish stocks
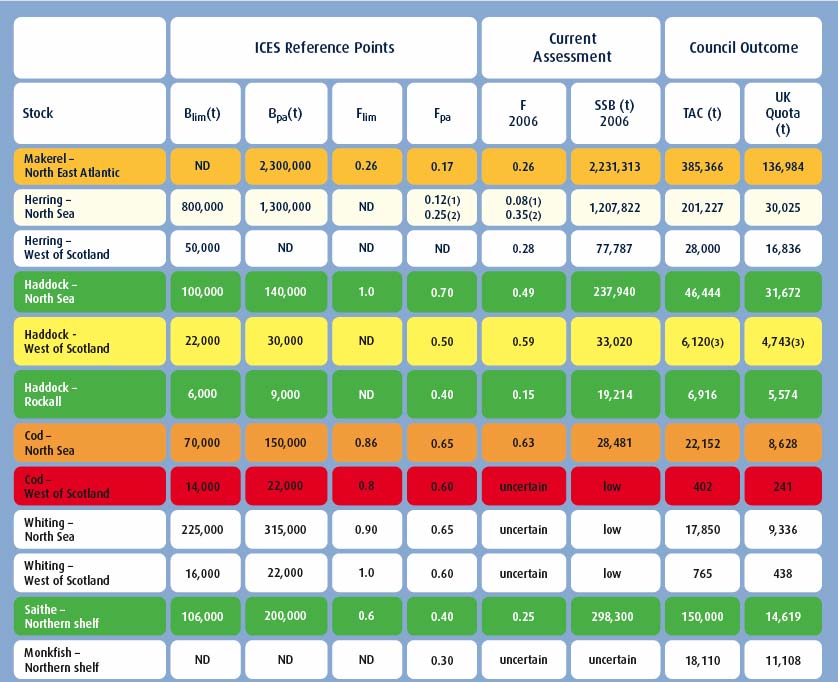
Colours refer to those categories shown by Figure 4.31. No colour indicates that data are insufficient to allocate a health category. Source FRS Fish and Nephrops Stocks Information: 2008 http://www.frs-scotland.gov.uk
(1) For juvenile North Sea herring - ages 0-1
(2) For adult North Sea herring - ages 2-6
(3) Including Clyde
ND = not defined
(t) = metric tonnes
Marine mammals
Many species of whales, dolphins and porpoises, collectively known as cetaceans, migrate through Scottish waters or are mainly present offshore, towards the edge of the continental shelf. Estimating the distribution and abundance of cetaceans involves considerable expense and expertise and to date there have been only two comprehensive surveys carried out; the status of offshore cetacean populations have recently been estimated (28), whilst trends in abundance remain unknown for most cetacean species in Scottish coastal waters. The abundance of two species, harbour porpoise and minke whale did not change significantly between surveys in 1994 and 2005, although the distributions of both species changed over this period and there is some evidence that the coastal bottlenose dolphin population (Figure 4.33), associated with the Moray Firth SAC, may have declined slightly between 1990 and 2005 (29). A third survey covering regions around the continental shelf edge is currently under way and is due to report in 2008. A significant increase in investment will be required if there is to be an improvement in the overall knowledge base in the near future.
Much more information exists for the two species of seals resident within Scottish waters (30). Scotland holds about 90% of the seals within the UK. Grey seals (Figure 4.34) have shown a steady increase in population size since records began in the early 1960s but there are now strong indicators that the population is beginning to level off (Figure 4.35). About 40% of the world population of grey seals is present in Scottish waters and about 28% of the European population of common (harbour) seals.
Less detailed information is available for common seals, however, declines of over 40% have been observed in Orkney (Figure 4.35) and Shetland since 2001. Common seal numbers may also be declining in other regions of the Scottish east coast (31), especially the Firth of Tay. To date, population indicators suggest that this decline is not present on the west coast and the Hebrides. However, declines on this scale are of significant concern because they could indicate changes in general environmental conditions.
Figure 4.33 Bottlenose dolphin
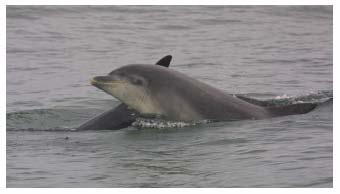
Figure 4.34 Grey seal haul-out site
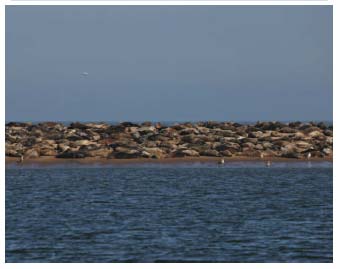
Figure 4.35 Changes in grey seal pup population in Scotland (green) and the number of common seals counted in Orkney (red)
Summary Assessment
Parameter |
Geographical region |
Key factors & pressures |
What the evidence shows |
Trend |
Status now |
Confidence in assessment |
Reason for overall status |
|---|---|---|---|---|---|---|---|
Abundance of grey seals |
Scottish continental shelf |
Predation by man and ecosystem changes |
Long-term increases now showing evidence of stabilising |
|
III |
Annual monitoring |
|
Abundance of common seals |
Scottish coast |
Predation by man and ecosystem changes |
Recent large declines in Orkney and Shetland as well as some areas on the Scottish east coast; population appear to be stable on west coast |
|
III |
Regular monitoring |
Marine turtles
The collation of UK and Republic of Ireland marine turtle records is undertaken by Marine Environmental Monitoring on behalf of the Turtle Implementation Group ( TIG), funded by SNH and the other country agencies. The key output is TURTLE a database which, as of February 2007, held 2,304 records, 343 of which were from Scotland (32). The leatherback turtle is the most commonly reported species, (98 records out of 144 turtle records from Scotland between 1997-2007), most frequently off the west and north coasts, with sightings peaking in late summer and early autumn.
It is extremely difficult to identify trends in marine turtle numbers. Although numbers of records have risen dramatically in recent years (Figure 4.36), this is likely to be due in large part to new and concerted effort in encouraging the submission of marine turtle records
(e.g. through the targeted distribution of the UK Marine Turtle Code).
Figure 4.36 Marine turtles: All species sightings and strandings 1997-2007 (33)
Seabirds
Scotland holds internationally important populations of a large number of species of seabirds (34). Seabirds are generally long-lived and changes within the marine environment that affect adult bird survival become evident in the size of the breeding population. Impacts on breeding success, or on the survival of young birds to maturity, also become evident in the breeding population but only several years later (35). The trends in abundance and productivity are based on data for 13 and 16 species respectively (where data are sufficient) out of a total of 24 breeding seabird species derived from counts from a sample of colonies around Scotland as part of the UK Seabird Monitoring Programme ( SMP), coordinated by JNCC, with partner organisations; see for example (36), which commenced in 1986, with data held by RSPB. The trend for the period 1986 - 2004 is shown in Figure 4.39 and illustrates a 30% decline in seabird abundance between 1992 and 2004 compared with the start of the monitoring period. At the last national census (Seabird 2000) 2.8 million pairs of 24 species of seabird were breeding in Scotland, being 75% of the seabird population of the UK.
The SMP collects and collates data on breeding numbers, demographic parameters, including productivity, and diet from a sample of colonies from around the UK. The trend in breeding success for the period 1986 - 2006 is shown in Figure 4.40. Seabirds showed a marked decline in productivity from 2002-2004 and remained low in 2005-2006. The breeding success of some species (fulmar, European shag and great skua) increased in 2006 after a period of very low success. These increases represent only partial recoveries towards average levels over the time series. Common guillemot populations were stable until 1996 and then declined until 2006 and black-legged kittiwake populations have shown a steady decline in breeding success since 1986.
The results of this work show that there are considerable differences in population trends among the 13 seabird species monitored, (Figure 4.41). The overall decline is accounted for by declines among relatively abundant species: notably Arctic tern, Arctic skua and black-legged kittiwake (Figure 4.37). The abundance of these species has been strongly affected by reduced sandeel availability in the waters around Orkney and Shetland and off the east coast of Scotland (Case Study 4.6). Six species decreased in abundance (the Arctic tern by as much as 95%), whereas seven of the 13 species increased in abundance between 1986 and 2004. For example, the northern gannet increased by 85% in this period.
The data provide evidence of an overall decrease in the breeding success of seabirds in Scotland. While the exact timing and geographical component of the decline varied from species to species, the pattern is indicative of a significant and widespread change in one or more factors that affect productivity. The main factors are food availability, weather conditions and predation. Poor food availability can result in starvation of chicks and can force adults to spend longer foraging and less time attending chicks, leaving them susceptible to chilling and predation. Poor weather conditions can inhibit foraging by adults and thereby have a similar impact on chicks as a poor food supply, as well as having more direct impacts such as chilling or washing nests away during storms. Predation of eggs or chicks and, sometimes, breeding adults by other seabirds or by mammals can significantly reduce productivity of a colony, sometimes leading to complete breeding failures (37).
Figure 4.37 Kittiwake
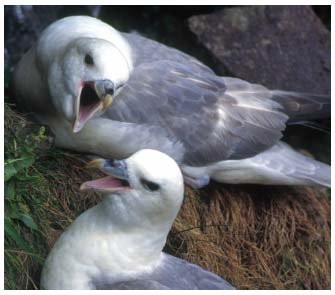
Figure 4.38 Guillemot with a meal of sprat
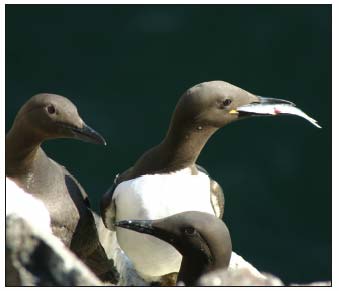
Figure 4.39 Abundance of breeding seabirds in Scotland (1986-2004)
Index change in abundance of 13 breeding seabirds in Scotland since 1986
Figure 4.40 Breeding success of seabirds in Scotland (1986-2006)
Index change in breeding success of 16 breeding seabirds in Scotland since 1986
Figure 4.41 The percentage change in abundance of selected seabird species between 1986 and 2004
WHAT GAPS ARE THERE IN OUR KNOWLEDGE?
There is an increasing demand for all advisers, such as FRS, SEPA and SNH, to provide high quality advice and support in protecting Scotland's natural heritage to underpin social and economic wellbeing. Scotland will increasingly rely on its coasts and seas to provide marine resources (e.g. energy generation, fisheries and transport) to fuel this development. It is essential that this growth is sustainable and that the health and biodiversity of Scotland's seas are not sacrificed.
It is widely acknowledged that there has been, and continues to be, a major investment shortfall in the monitoring of the marine environment. If sustainable development is the aim then sufficient investment of resources is needed in research, survey and monitoring to allow the natural fluctuations in species and habitat distribution and abundance to be separated from that of human influence and climate change, i.e. it is important to develop an understanding of how marine ecosystems function and the consequences of human activities upon them.
The current focus on designated areas and the associated monitoring effort and reporting precludes programmes that could provide crucial long-term, time-series data needed to identify and assess trends essential for providing sound advice to both the Government and users of the marine environment. The data gathered from the designated sites monitoring programme is, in itself, insufficient to provide a reliable assessment of the state of Scotland's seas, because designated sites cover less than 0.5% of Scotland's territorial waters. Thus, it is outside the SACs, that the gaps in data, information and knowledge are most apparent.
The requirements for more information on the structure and function of habitats and species to fill these knowledge gaps, within a resource tight arena, will require a move towards predictive assessments that can be validated through ground-truthing and the selection of indicators to measure cause and effect. In order to achieve this in a cost-effective manner all agencies and other interested parties (e.g. FRS, SEPA, SNH, BGS, SAMS, universities, etc.) must improve their partnership working and data sharing so that opportunities to collaborate are maximised. Monitoring and survey activities should be set up so that individuals from sister agencies are able to take advantage of field survey opportunities, whilst at the same time promoting more flexible cross-team working (for example, SNH is planning to collect rock samples for BGS during a planned broad scale survey of North Rona). The cost savings throughout the marine sector are potentially enormous as are the opportunities for staff development an raising Scotland's scientific skills base.
CASE STUDY 4.6 Implications of climate change for Scottish seabirds
Climate change will likely affect seabirds in two major ways: either directly through an increased frequency of very severe weather events resulting in nests being washed off cliffs, breeding burrows becoming flooded etc., or indirectly through changes in prey availability. While instances of the former have been reported, it is the latter effect that is generally considered to be the more important. Thus, how climate change affects seabirds will, to a large extent, be determined by how sensitive their preferred prey is to changes in temperature, salinity, etc., and whether alternative prey available.
In the North-East Atlantic, particularly northern parts of the North Sea, the lesser sandeel is a key prey of many seabirds during the breeding season. The main way climate change is expected to affect seabirds in this region is through climate-induced changes in sandeel availability. Elucidating the detail of such relationships is complicated by the fact that sandeels have been the target of a major fishery. Long-term research on the seabird community on the Isle of May (Figure 4.42), off the south-east coast of Scotland, has shown that both adult survival and breeding success of the black-legged kittiwake, were significantly reduced in the year following a winter with higher than usual sea surface temperature ( SST) which resulted in a poor sandeel recruitment (38,39). In addition, birds bred less successfully and survived less well in years when a sandeel fishery was operating within 50 km of the colony. The results also indicated that the breeding success/ temperature relationship was mediated mainly through one-year old fish while that for adult survival was mediated by the availability of juvenile sandeels. Thus the analysis highlighted the additive negative effects of rising sea temperatures and a local sandeel fishery on kittiwakes and additional analyses using data on kittiwake breeding success for other Scottish east coast colonies have also revealed the possibility of additive effects of climate and sandeel fisheries (40).
Although surface-feeding species such as kittiwake and terns have generally been regarded as being the most sensitive to changes in prey, particularly sandeel, availability (41), recently diving species such as the common guillemot that bring back single items of food for their young, have also started to have bad breeding seasons. Long-term data from the Isle of May showed the average length of sandeels in the early 2000s was only 60% of that 30 years ago (42). The situation was particularly extreme in 2004 when mean sandeel length was the lowest recorded over a 30-year period. In 2004, sandeels were mainly replaced in guillemot diets by sprat (Figure 4.38), another lipid-rich pelagic fish that should have provided sufficient energy for normal chick growth and fledging success. However, analyses of the energy content of fish brought in for the chicks revealed that values were lower than expected and thus chicks were being fed a low-lipid rather than a high-lipid diet (43).
There is thus good evidence that breeding failures of seabirds at Scottish North Sea colonies in 2004 stemmed from problems lower down the food web. Sea temperatures in the northern North Sea have been rising since the mid-1980s and the abundance and species composition of the plankton, particularly the copepod community, has changed (44). Such conditions appear unfavourable for sandeel recruitment (38) and also for the survival and/or breeding of a wide range of seabirds (39, 45, 46, 47).
The evidence to date suggests that conditions in the seas around Scotland are becoming less favourable for sandeels and thus for species such as seabirds that depend on them for food. However, it remains possible that the conditions will favour other prey species and that at least some seabirds may be able to take advantage of this. Recent surveys have indeed suggested that a new potential prey species is now available, with an increase in the abundance of the snake pipefish being recorded since 2003 (48,49). The cause of this increase is currently unknown, although it seems to be part of a general spread of Atlantic shelf species into the North Sea. Many seabird species have been recorded bringing snake pipefish to their chicks at Scottish seabird colonies, particularly those in the Northern Isles and St Kilda, and sightings of seabirds feeding on pipefish outside the breeding season are becoming common. However, compared to other potential prey, the energy content of snake pipefish is very low and thus it seems highly unlikely that snake pipefish are a viable alternative food source for seabirds (50).
Figure 4.42 Researchers catching birds on the Isle of May
Contact
Email: Central Enquiries Unit ceu@gov.scot
There is a problem
Thanks for your feedback