Strategic Environmental Assessment (SEA) of the Scottish Climate Change Bill: Consultation Proposals: Environmental Report
Strategic Environmental Assessment (SEA) of the Scottish Climate Change Bill: Consultation Proposals: Final Environmental Report (Post-Consultation Issue) November 2008
Appendix C Environmental Baseline Details
Introduction
Part 2 of Schedule 3 (in relation to Section 14) of the Environmental Assessment (Scotland) Act 2005 establishes that environmental reports should record,
"The relevant aspects of the current state of the environment and the likely evolution thereof without the implementation of the plan or programme."
This section presents a brief summary of the state of the environment with respect to the key areas that the SEA is required to cover. Due to the wide geographic and far-reaching nature of the issues covered within the SCCB, it is not considered appropriate or necessary to provide a great level of detail in this baseline.
A brief summary of the state of the environment for each of the environmental receptors is provided with a discussion of the potential impacts of climate change. Key reference sources included:
- SEPA, State of the Environment Report, 2006;
- SEPA, Climate Change Plan, SEA Scoping Report, 2007
- National Atmospheric Emissions Inventory (online);
- SNIFFER, Handbook of Climate Trends across Scotland (online).
- Scottish Government, Key Environment Statistics, 2006/7;
- Scottish Government, Rural Scotland Key Facts, 2006/7;
Climate Change in Scotland - Context and Observed Impacts
Our climate depends on the Earth's temperature. Due to rapidly increasing concentrations of carbon dioxide (CO 2) and other greenhouse gases in the atmosphere, the temperature of the planet is rising quickly compared with relatively stable temperatures throughout the past millennium. Atmospheric carbon dioxide concentrations remained relatively constant at around 280 parts per million (ppm) for at least a thousand years, but concentrations have risen since the mid-1700s, reaching 377ppm in 2004 (see Figure C1).
Figure C1: Atmospheric concentrations of important long-lived greenhouse gases over the last 2,000 years. Increases since about 1750 are attributed to human activities in the industrial era. Concentration units are parts per million (ppm) or parts per billion (ppb), indicating the number of molecules of the greenhouse gas per million or billion air molecules, respectively, in an atmospheric sample.
Source: IPCC (2007) Fourth Assessment Report of Working Group 1 - The Physical Science Basis
The increasing use of fossil fuels for energy generation and transport purposes means carbon dioxide is the most critical greenhouse gas. The main sources of greenhouse gases in Scotland are shown in Figure C2 below.
Figure C2: Main sources and sinks of carbon emissions in Scotland
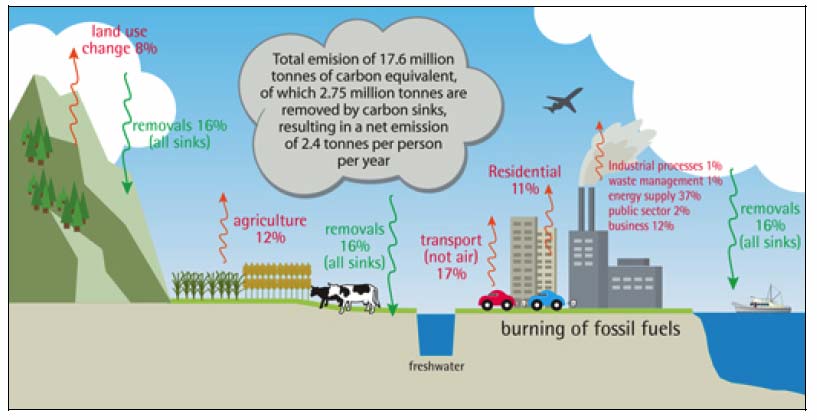
Source: SEPA (2006) State of the Environment Report, (Fig. C2)
Annual emissions of the six main greenhouse gases (CO 2, CH 4, HFC, N 2O, PFC, SF 6) expressed as CO 2 equivalents are shown in Table C1 below. Although Scotland's CO 2 emissions fell by 12.5% between 1990 and 2005, our energy demands for transport, businesses and homes increased significantly during the same period. Despite methane emissions falling by 38.2% between 1990 and 2005, significant volumes of carbon dioxide and methane could be released from soils as a result of increased temperatures or changes in land use. For example, Scotland's peat uplands are vulnerable to changes in climate and land management and, if only 0.1% is released as carbon dioxide, Scotland's emissions will double.
Table C1: Scotland's greenhouse gas emissions compared to base year, 1990-2005
CO 2 |
CH 4 |
HFC |
N 2O |
PFC |
SF6 |
Total |
|
|---|---|---|---|---|---|---|---|
1990 |
(Base Year) |
(Base Year) |
(Base Year) |
(Base Year) |
|||
1995 |
-2.7% |
-5.3% |
(Base Year) |
-9.7% |
(Base Year) |
(Base Year) |
-3.47 |
1998 |
-1.6% |
-12.0% |
216.6% |
-11.3% |
27.6% |
29.7% |
-3.22 |
1999 |
-7.6% |
-18.4% |
247.1% |
-13.7% |
34.3% |
58.2% |
-8.77 |
2000 |
-1.8% |
-20.8% |
305.5% |
-15.4% |
27.1% |
68.4% |
-4.65 |
2001 |
-1.9% |
-25.8% |
354.0% |
-15.7% |
-26.2% |
54.3% |
-5.37 |
2002 |
-8.0% |
-31.7% |
399.0% |
-15.5% |
-8.1% |
71.0% |
-10.66 |
2003 |
-7.1% |
-37.2% |
427.7% |
-16.6% |
-10.8% |
68.0% |
-10.77 |
2004 |
-11.1% |
-38.1% |
444.1% |
-18.6% |
-14.3% |
92.2% |
-14.13 |
2005 |
-12.5% |
-38.2% |
456.7% |
-20.7% |
-19.8% |
125.1% |
-15.39 |
All reductions are expressed in comparison to the base year (1990 for CO 2, CH 4, N 2O; 1995 for HFC, PFC, SF 6)
Source: National Atmospheric Emissions Inventory
When we consider that the aim of the SCCB is to reduce greenhouse gas ( GHG) emissions by 80% from 1990 to 2050, the implied trajectory for the total GHG emissions is encouraging; however it is likely that reductions will become more difficult with time. It is also possible that certain gases have already been reduced as far as is possible using currently available measures (e.g. CH 4 is now routinely captured from landfill); the remainder could be much more difficult to reduce.
Table C2 shows the total emissions (expressed as kilotonnes of CO 2 equivalent for the same period). The proportion of the total arisings of non-CO 2 gases suggests that, were the SCCB to consider the basket of six gases for targeted reduction; these could present an improved opportunity for Scotland to meet its obligations. This could be significant as the SCCB will commit to an additional 20% GHG reduction (over the UK Bill commitment to reduce CO2 by 60%), and Scotland should seek to maximise reduction opportunities wherever they exist.
Table C2: Scotland's greenhouse gas emissions, 1990-2005
Year |
CO 2 |
CH 4 |
HFC |
N 2O |
PFC |
SF6 |
Grand Total |
|---|---|---|---|---|---|---|---|
1990 |
49,951 |
8,185 |
No data |
6,169 |
113 |
20 |
64,439 |
1995 |
48,624 |
7,753 |
132 |
5,573 |
88 |
31 |
62,200 |
1998 |
49,127 |
7,199 |
417 |
5,470 |
112 |
40 |
62,366 |
1999 |
46,162 |
6,680 |
458 |
5,323 |
118 |
49 |
58,789 |
2000 |
49,040 |
6,483 |
535 |
5,221 |
111 |
52 |
61,442 |
2001 |
48,994 |
6,071 |
599 |
5,202 |
65 |
48 |
60,978 |
2002 |
45,972 |
5,593 |
658 |
5,213 |
81 |
53 |
57,569 |
2003 |
46,380 |
5,143 |
696 |
5,147 |
78 |
52 |
57,496 |
2004 |
44,396 |
5,070 |
717 |
5,019 |
75 |
59 |
55,337 |
2005 |
43,698 |
5,060 |
734 |
4,891 |
70 |
69 |
54,522 |
Source: National Atmospheric Emissions Inventory
Greenhouse Gases
The majority of greenhouse gases arise from natural sources but are also contributed to by human activity. The major greenhouse gases with anthropogenic origins are described below.
Carbon Dioxide (CO 2)
CO 2 is an atmospheric gas comprised of one carbon and two oxygen atoms. CO 2 derives from multiple sources including volcanic outgassing, the combustion of organic matter and respiration processes of aerobic organisms. It is also produced by various micro-organisms through fermentation and cellular respiration. Plants utilise carbon dioxide during photosynthesis, using both the carbon and the oxygen to construct carbohydrates. Conversely, plants also release oxygen to the atmosphere, which is subsequently used for respiration by heterotrophic organisms, forming a major component of the carbon cycle. CO2 is present in the Earth's atmosphere at a low concentration (though this is steadily and rapidly increasing) and acts as a greenhouse gas.
Methane (CH4)
CH 4 is the simplest alkane, and the principal component of natural gas. It is a relatively potent greenhouse gas with a high GWP. The NAEI states that each kg of CH 4 warms the Earth 21 times as much as the same mass of CO 2 (based on the Third assessment report of the IPCC). However, the Fourth assessment report of the IPCC has recalculated this to include indirect effects and states that the relative impact of CH 4 to CO 2 averaged over 20 years is 72. The reason for this discrepancy is that CH 4 in the atmosphere is eventually oxidised, producing carbon dioxide and water. As a result, CH 4 in the atmosphere has a half life of seven years (every seven years, the amount of CH 4 halves).
A significant proportion of agricultural emissions are of CH 4. The Macaulay Institute estimate that 69% of Scotland's CH 4 emissions arise from agriculture, with cattle responsible for 49% 1. Ruminant livestock are a significant methane source in Scotland. Reductions in CH 4 emissions in Scotland have largely been the result of capture of landfill gas, and a reduction in livestock numbers.
Hydrofluorocarbons ( HFC)
HFCs are man-made chemicals, many of which have been developed as alternatives to ozone-depleting substances for industrial, commercial, and consumer products. GWPs of HFCs range from 140 ( HFC-152a) to 11,700 ( HFC-23). The atmospheric lifetimes for HFCs vary from just over a year for HFC-152a to 260 years for HFC-23. Most commercial HFCs have atmospheric lifetimes under 15 years; eg., HFC-134a (used in vehicle air conditioning and refrigeration), has an atmospheric life of 14 years.
Perfluorocarbon ( PFC)
PFCs are commonly used in refrigerating units and "clean" fire extinguishers. However, PFCs are extremely potent greenhouse gases, and can persist for up to 50,000 years. PFCs have extremely stable molecular structures and are largely immune to chemical processes in the lower atmosphere that break down most atmospheric pollutants. Not until the PFCs reach the mesosphere, about 60 kilometres above Earth, do very high-energy ultraviolet rays from the sun destroy them. This removal mechanism is extremely slow and as a result PFCs accumulate in the atmosphere and persist for several thousand years. The estimated atmospheric lifetimes for CF 4 and C 2F 6 are 50,000 and 10,000 years respectively.
Nitrous Oxide (N2O)
Unlike other nitrogen oxides, nitrous oxide is a major greenhouse gas. While its radiative warming effect is substantially less than CO 2, the persistence of N 2O in the atmosphere, when considered over a 100 year period, per unit of weight, has 310 times more impact on global warming than that of CO 2. Control of N 2O is included in efforts to curb greenhouse gas emissions, such as the Kyoto Protocol.
Agriculture is the main source of human-produced N 2O: cultivating soil, the use of nitrogen fertilisers, and animal waste handling can each stimulate naturally occurring bacteria to produce more N 2O. The livestock sector (primarily cows, chickens, and pigs) produces the majority of human-related N 2O. Industrial sources make up only about 20% of all anthropogenic sources, and include the production of nylon and nitric acid, and the burning of fossil fuel in internal combustion engines.
Despite its relatively small concentration in the atmosphere, N 2O is the third largest greenhouse gas contributor to overall global warming, behind CO 2 and CH 4. (The other NO x gases contribute to global warming indirectly, by contributing to tropospheric ozone production during smog formation).
Sulphur Hexafluoride (SF6)
The global warming potential of SF 6 is 23,900, making it the most potent greenhouse gas the IPCC has evaluated. SF 6 is a colourless, odourless, non-toxic, non-flammable gas. SF 6 is used for insulation and current interruption in electric power transmission and distribution equipment, in the magnesium industry to protect molten magnesium from oxidation and potentially violent burning, in semiconductor manufacturing to create circuitry patterns on silicon wafers, and as a tracer gas for leak detection.
Like the other high GWP gases, there are very few sinks for SF 6, so all man-made sources contribute directly to its accumulation in the atmosphere.
Scottish Climate Change Impacts to Date
This section sets out observed patterns of climatic change in Scotland over the past 50 years as reported in two key documents:
- The Scotland & Northern Ireland Forum For Environmental Research ( SNIFFER) 2006 publication, Handbook of Climate Trends Across Scotland
- SEPA's State of the Environment, 2006 Report
The SNIFFER Handbook presents recorded changes in Scotland's climate in the last century and provides a benchmark against which we can measure future climate change and develop strategies to cope with its impact. The Handbook includes analysis of historic data relating to temperature, rainfall, snowfall, air-pressure and sunshine.
The State of the Environment report concludes that climate change is evident in Scotland from observed trends in temperature, rainfall and snow cover, higher river flows and sea levels. It also notes other climate-related phenological changes, including shifts in growing, breeding and migration seasons and in species abundance and diversity.
Significant observations described in these two documents with respect to temperature, rainfall, changes in the marine environment and in Scotland's coastline are described below:
Temperature
Scotland's temperature records indicate average spring, summer and winter temperatures rising by more than 1 oC since 1961. This has been particularly prevalent in southern and eastern Scotland. Average temperature increases are smallest in autumn.
24 hour maximum temperatures have similarly been increasing, on average by over 1 o since 1961. This is particularly marked in winter and spring. The rise in maximum temperatures has been relatively constant across the country.
Since 1914 there has been an upward trend in minimum temperatures in both east and west Scotland for all seasons. Minimum temperatures in northern Scotland while increasing are doing so at a slower rate than the rest of the country and some areas not having experienced much increase at all. Minimum temperatures have not increased at the same rate as maximum temperatures.
Since 1961, the growing season across the whole of Scotland has lengthened by 33 days. This is particularly marked in coastal areas, in western Scotland where the growing season is now nearly 37 days longer than in 1961 and the Shetland Islands where it has been extended by over two months. The increase is most influenced by an early start which, on average, now occurs 21 days earlier.
Since 1961 there has been a 26% reduction in the number of days each year of air frost. This reduction has been constant across the country, although some small areas in northern Scotland have witnessed an increase. The reduction is most noticeable in the spring and autumn seasons. Since 1961 there has been a 28% reduction in the number of days each year of ground frost, although most of these reductions have occurred since the early 1980s.
Rainfall
Scotland over the year is, on average, 20% wetter than it was in 1961. Winter precipitation shows a clear upward trend since this time, with a 58% increase recorded across the country. This is most marked in the north (nearly 70% increase) and less marked in the east (36% increase). There is less variability in precipitation across the other seasons and patterns are less clear. The key trends for non winter months appear to be that the east has become slightly drier during the summer and the west wetter in spring.
There has been a trend of increasing heavy rainfall in winter, particularly in the north and west. There is a link between the number of days of heavy rain and overall rainfall.
The number of days of snow cover has reduced across the country. This is particularly prevalent in autumn where decreases of over 70% have been recorded (nearly 83% in western Scotland).
There has been very little change in the maximum number of consecutive dry days with little long term trends recorded since 1961. Overall there is a clear contrast in the number of consecutive dry days between east and west Scotland, but there would appear to be no significant change since 1961.
There is a clear trend of an increase in the levels of maximum five day precipitation (ie. maximum recorded precipitation over a five day period in any year) of around 20%. A steady increase has been recorded across all Scotland. Increases in prolonged precipitation and rainfall intensity may lead to greater flooding.
Other
There is no clear trend in wind speeds or number of gale days across the country. Since 1961, the number of sunshine hours in a day has increased slightly over the year, but a more significant increase is recorded across Scotland during autumn. While there are significantly different patterns of sunshine across the country, changes in those patterns appear not to show any trends.
The Marine Environment
The seas around Scotland have warmed by 1 oC over the last 20 years. Warmer seas have prompted changes in composition, abundance and distribution of a number of marine species including plankton, fish, sea birds, whales, mammals, dolphins and porpoises.
Warm water fish such as red mullet, sardines and anchovies have been caught off Scotland's coast since 1995. Some plankton species, which form the basis of the marine food web, have migrated north by up to 10 degrees latitude (about 700 miles). Changes in plankton distribution and abundance have serious consequences not only for the marine ecosystem but for the ability of the oceans to absorb carbon dioxide and ultimately regulate the Earth's climate.
Coastline
Sea level is rising all around the UK coastline, but at a slower rate around Scotland because the Scottish mainland is still rebounding following the last ice age. Nonetheless, all Scottish mainland gauges have recorded a sea level rise over the long term, with the longest individual record at Aberdeen indicating an average sea rise of 0.6mm per year since 1862. Sea level rise increases the risk of flooding of coastal and estuarine towns and leads to erosion of intertidal habitats and loss of biodiversity. This, combined with evidence of increasing storminess and wave height in the North East Atlantic, suggests that future storm surges will probably become more severe, leading to increased risk of coastal flooding.
The Current Environment and Predicted Climate Change Impacts
This section sets out the possible effects of predicted climate change on Scotland, with particular reference to the SEA topics. For each SEA topic, the current state of the environment is briefly described and commentary is provided on potential effects of climate change. SEPA's State of the Environment Report 2006 forms the basis of much of this section.
General Climate Change Impacts
The speed and impact of climate change will be become more severe if the world remains heavily dependent on fossil fuels. Indeed, temperatures in Scotland may rise by up to 4 oC by the end of the century, with consequences including milder and wetter winters, hotter and drier summers, more extreme weather events and rising sea levels.
Climate Change Scenarios for the United Kingdom: The UKCIP02 Scientific Report 2 presents four climate change scenarios. These scenarios are based on global emission scenarios from the Intergovernmental Panel on Climate Change ( IPCC) and outputs from Hadley Centre climate models. Due for release in 2008, UKCIP08 will introduce probabilities to climate predictions for the first time in order to improve risk assessment and management of climate change.
UKCIP02 predicts a number of impacts that may occur in the UK by 2080. The key findings suggest:
- 1.5 to 2 oC warmer in winter; up to 3.5 oC warmer in summer; and possibly 4 oC warmer in autumn. Summers will suffer some significant heat waves.
- Milder temperatures in winter will result in wetter conditions, with extremes of rainfall leading to serious flooding events.
- Precipitation will increase by over 30% in the east of the country and up to 20% in the west during the winter season. Conversely, summer rainfall will be around 40% less, particularly in the south and east of Scotland.
- Daily winter rainfall will increase by at least 20% for storms that normally occur only once every two years.
- Summer cloud cover will decrease by 10%, with a slight increase in winter cloud cover.
- Daily average wind speed is not likely to change significantly, although it could be up to 3% higher, particularly in the north west of Scotland. Meanwhile, the two year daily mean average wind speed could be up to 4% higher. If this increase applies to storm gusts, considerably more damage to infrastructure will be inevitable.
- Snowfall across much of Scotland will decrease by over 90%.
- Sea level will rise by approximately 60cm around Scotland's coastline and storm surges could be up to 0.7m higher, resulting in higher risks of coastal flooding.
- Sea surface temperature will be 1 oC to 2.5 oC warmer; the greatest increase being off South East Scotland.
- The frequency of high impact weather events will increase with rising average global temperature
Water
Scotland has generally high quality water environments although human activity can result in damage. The state of the water environment is influenced by changes taking place in water itself and in the climate, as well as inputs from land and air. Human activities which result in changes and inputs can harm the water environment affecting water resources and damaging ecosystems.
There are indications that:
- overall quantity of water in Scottish rivers is increasing;
- spells of very wet weather are occurring more frequently and with it the risk of flooding;
- some rivers in the east may be experiencing lower flows, particularly during the summer.
These indicators are of particular relevance to climate change.
There is extensive monitoring of rivers, lochs, estuaries and coastal waters and, to a more limited extent, groundwater. Monitoring covers a wide range of chemical parameters but it also includes biological parameters and aesthetic appearance. The monitoring results are combined such that a body of water is placed into one of four or five classification bands (depending on river, estuarine or coastal classification), which describe the current condition ranging from excellent or good quality, through fair and poor quality to seriously polluted for rivers and through excellent, good, unsatisfactory and seriously polluted for estuaries and coastal classifications.
2005 data shows that some 78% of rivers, 98% of estuaries and 99% of coastal waters in Scotland were classified as either excellent or good quality. The situation has continued to improve from that reported by SEPA in 1996 and 1999. The number of poor quality or seriously polluted (class C and D) rivers, estuaries and coastal waters declined by 16%, 44% and 57% respectively from 2000 to 2005.
A SEPA analysis of the pressures on water quality in Scotland in 2005 concluded that point and diffuse pollution posed a risk of failing to meet the objectives of the Water Framework Directive to:
- 36,264 km 2 of groundwater (equivalent to 46% of Scotland's land area);
- 7,947 km of rivers (31% of total river length);
- 350 km 2 of lochs (35% of total loch area);
- 759 km 2 of estuaries (76% of total estuary area);
- 3,441 km 2 of coastal waters (7% of total area of coastal waters)
The physical structure (morphology) of the water environment has been progressively changed by human activity. Once changed it may take decades or centuries for the system to return to a natural condition. Results of SEPA risk assessments concluded that pressures on morphology posed a risk to:
- 8,827 km of rivers (35% of total river length);
- 509 km 2 of lochs (51% of total loch area);
- 558 km 2 of estuaries (56% of total estuary area);
- 1,272 km 2 of coastal waters (3% of total area of coastal waters).
Potential Climate Change Impacts
It is likely that with increased average rainfall, increased rainfall intensity and prolonged periods of rain, that more frequent and more severe river flooding will occur. It is estimated that this may affect more than 70,000 properties, many of which are concentrated within particular areas of risk. In addition, with higher sea levels and increased wave height, it is predicted that coastal flooding in Scotland will become both more frequent and more severe. It is predicted that a further 30,000 properties could be at risk from this source of flooding. Flooding can have very significant effects on property, businesses, agriculture as well as being a risk to human life.
Long term predictions are for an increased likelihood in summer droughts. While the observed impacts in Scotland have not borne this prediction out, if realised, this could result in river water quality problems (caused by lack of flow), limitations on abstraction of water (particularly for agricultural use) and even possible problems with water supply.
Increased flood events and the potential for summer time droughts may result in water quality issues that need to be addressed. For example, reduced river flows during drought periods will provide less dilution for aquatic discharges which may increase pollution risk. Reduced river flows may also affect abstraction for drinking water or for commercial use. Conversely, increased flooding may increase run off of pollutants (e.g. from agricultural land) into waterbodies and which may affect their status e.g. run off impacting on bathing water quality.
It is predicted that sea levels will rise, that there may be increased wave heights (particularly during storms) and that sea temperatures around Scotland will also rise. Whilst the consequences of these are difficult to predict, it is likely that increasing rates of coastal erosion will result from higher sea levels and wave heights. This in turn may lead to terrestrial land and habitat loss. Within the marine environment, higher sea temperatures may result in changes to the distribution and abundance of marine biodiversity. This may result in the increase of some species and the decrease or even loss of others (with warmer water species replacing colder water species). This may in turn affect other species e.g. the recent poor breeding of Scottish Island seabirds. Changes in marine species may also affect economic activities such as commercial fisheries.
Biodiversity, Flora and Fauna
The state of Scotland's biodiversity is a litmus test of the state of the environment; whatever changes take place in the land, air and water environments ultimately affect biodiversity.
Scotland's environment supports some 90,000 species of animal, plant and microbes. These species inhabit a wide range of habitats; Scotland's climate, geology and physical landscape combining to provide a tremendous variety of natural habitats which have subsequently been altered and modified by human activity. Scotland's landscape is a mosaic of habitats reflecting various influences over time, from the seas and coastal waters, to rivers and lochs, farmland and forests, mountains and moorland.
Many of the habitats are internationally important; of the 159 conservation priority habitats listed in the European Habitats Directive, Scotland has 65. In terms of protected sites, the importance of these areas in a European context is recognised in the designation of around 240 Special Areas of Conservation ( SACs).
In addition to these European designations, Scotland has a network of over 1450 Sites of Special Scientific Interest ( SSSIs), covering some 13% of Scotland. SSSIs represent the best examples of Scotland's natural heritage and are designated by Scottish Natural Heritage ( SNH) for their plants, animals or habitats, their rocks or landforms. At a UK level, Scotland has 41 of the 45 habitats and 261 of the 391 species identified as priorities for action in the UK Biodiversity Action Plan. In 2005 a list of species and habitats was published ( www.biodiversityscotland.gov.uk) identifying those considered by the Scottish Ministers as important for biodiversity conservation in Scotland. It includes 177 terrestrial and freshwater habitats, 197 marine species and habitats, and 1806 terrestrial and freshwater species (including 61 endemic to Scotland).
Potential Climate Change Impacts
Climate change predictions for the UK suggest that as the environment changes, biodiversity will be significantly affected. It is still not exactly clear how biodiversity in Scotland will be affected or how species will adapt to climate change, but it is suggested that there will be the potential for changes in:
- abundance and distribution of species;
- phenology (timing of flowering, breeding, migration, length of growing season);
- species behaviour (migration routes, response to drought/ flood);
- ecosystems (loss of species unable to move/ adapt);
- CO2 (contribution to CO2 storage, release and sequestration);
- temperature (could be less favourable for native species, while new species may appear. New species may compete with native species for food and habitat);
- habitats (damaged through flooding and increased erosion);
- food chains (potential catastrophic loss of species e.g. island breeding sea bird populations).
In addition, climate change mitigation measures may also have biodiversity impacts. Renewable energy developments could, for example, have effects on aquatic species and habitats (for hydro and run of river schemes) or on bird populations (for large scale wind). An increase in use of land for growing biomass crops may also lead to biodiversity impacts.
Soil/ Land
The Scottish soil resource contains a number of internationally important soil types including montane soils and peat. Podzols are the most common soil type occupying 18,480 km 2 or 24% of the land area. Peats occupy 16,940 km 2 or 22%; gleys occupy 10,780 km 2 or 14%; brown earths 9,240 km 2 or 12%; montane soils 3,850 km 2 or 5%; and lithosols, regosols, alluvial soils, rankers, rendzinas, calcareous soils and magnesian soils make up the remaining 4% of the land area.
Soil is a non-renewable resource and essential for supporting agriculture, forestry and all terrestrial ecosystems, as well as elements of the historic environment (archaeological resources). The soils of Scotland contain the bulk of the UK soil carbon pool. It is estimated that 13.6% (>1 m ha) of Scotland's land surface is overlain by deep peat soils. This represents about 5000 tonnes of carbon stored per hectare or about 10 times the equivalent stored in the mineral soils which are more common in England.
Taken together, the carbon stored in the deep peats and the shallower peaty soils of Scotland is about 170 times more than stored in all the vegetation of Scotland. Soil carbon can be lost either through climate change or as a consequence of inappropriate land management (e.g. drainage of deep peats). Either would have major effects in relation to added GHG emissions.
SEPA have identified three main pressures affecting soils: industry; agriculture and forestry, with agriculture and forestry accounting for 80% and 13% respectively of the land area in Scotland. Impacts from agriculture include soil erosion, and the use of inorganic fertiliser and pesticide applications. In addition, agriculture provides large quantities of greenhouse gases (from land use change, fertiliser use and ammonia from intensive livestock rearing) which can be reintroduced to the soil via atmospheric deposition.
Loss of organic matter in soils is a concern in Scotland along with soil erosion, while an increase in building developments and road improvements has meant losses associated with soil sealing by impermeable surfaces. Soil organic matter is also a significant carbon store and its loss increases carbon dioxide emissions and levels of organic carbon in water. Scotland's soils contain an estimated 2,196 million tonnes of soil carbon (to a depth of 100 cm) compared with a total of 4,566 million tonnes for the whole of the UK. Small changes in terrestrial carbon stocks will result in large GHG emissions.
Other threats to land include:
- Alteration of soil chemistry through the addition of substances, including acidification.
- Inappropriate waste disposal leading to land contamination, for example oils or chemicals.
- Poor forestry or agricultural practice increasing the risk of soil erosion, loss of organic matter/ nutrients, landslips, loss of vegetation, species shift and habitat change.
- Decreased biodiversity due to land use change.
Potential Climate Change Impacts
As the climate changes, the land and soil will also likely be subject to change, in terms of its physical properties or quality, and the way in which we use land for growing crops or for other commercial activities. The physical structure of soil may be changed through drought combined with higher intensity storm events causing landslides. In particular, peaty soils may suffer from accelerated decomposition (through drying) which may result in an increase in emissions of greenhouse gases normally locked up in these soils, which in turn may fuel further climate change. Land may also be lost through erosion caused by water (eg. through flooding, particularly coastal flooding) or by wind (particularly when associated with drying of soils).
Damage to soils (for example by landslide) can lead to significant disruption of human activities, particularly where transport infrastructure is affected. Changes to the climate may also lead to significant changes in the way that land is used. This is most likely to occur in respect of the types of crops able to be grown in Scotland, where crops previously unsuited to the climate may be able to be commercially viable and other crops may be less suited to new conditions.
Another feature which may affect land and soil are measures to adapt to climate change. For example, biomass crops to offset fossil fuel use may become increasingly popular, replacing traditional crops. This may in turn have impacts for landscape and biodiversity. Further, the need to protect land from flooding may also result in changes to land use, with some areas left as sacrificial land (e.g. flood meadows) with other areas requiring new or upgraded defences.
Population/ Human Health
Scotland covers an area of 30,414 square miles (78,772 km 2) and has a population of just over 5 million people, with almost 1 million living in rural areas. The population of Scotland in 2006 was estimated to be 5.12 million people. This has remained reasonably steady since 1951 with the population only expected to rise to 5.37 million by 2031. The number of new households has seen a steady rise since 1991, and in 2006 there were 2.3 million households in Scotland. This largely due to more couples or singles living alone rather than an increase in population. 3 The overall trend is one of increasing urbanisation with 1,403 hectares of agricultural land given over to roads, housing or industry in 2002 - 2003 (140% increase since 1989 - 1990).
According to the latest figures (2006 data) from the UK Government Actuary's Department life expectancy in Scotland is lower than in England, Wales and Northern Ireland. For the period 1998-2000 Scottish life expectancy was 72.83 years for males and 78.21 years for females. The corresponding figures for the United Kingdom as a whole are 75.13 for males and 79.98 for females: 2.3 years higher for males and 1.8 years higher for females 4. Scotland has particularly high incidence of serious conditions such as heart disease, stroke and cancer.
Potential Climate Change Impacts
It is likely that climate change will have effects upon communities and individuals not just in terms of their day to day activities, but potentially their health. Disruption caused by severe weather and flooding can lead to significant impacts upon stress levels, access to services and therefore upon health. Other restrictions e.g. in water supply during drought and flood periods can also lead to increased disruption and stress. While the prediction of warmer winters may lower winter mortality and fuel poverty, the predicted warmer summers could lead to increase in incidences of heat stress.
Very hot summers such as those experienced in 2003, which contributed to the death of about 35,000 people across Europe, are predicted to become more common. Very extreme temperatures are considered less likely to affect Scotland, although heat related respiratory illnesses, for example, may increase. The main risk groups for climate change effects are predicted to be the elderly, the very young, and those with existing health issues.
The economic cost of climate change will also affect communities and individuals and this may also contribute to stress related health problems. The Stern Report estimated that the cost of extreme weather alone is expected to be 0.5 - 1% of the world's GDP by about 2050 5.
Air
Air quality can vary considerably across Scotland, and is dependent on many factors including local and national weather conditions and the emissions of substances to air both within and outwith Scotland. The main sources of air pollution include transport, energy generation, industry, waste and agriculture. With reductions in large-scale industrial emissions, transport is rapidly becoming an increasingly significant source. The continual increase in energy demand may also give rise to increased emissions.
In relation to specific pollutants, emissions of nitrogen oxides and sulphur dioxide from large industrial sources have fallen. The decrease in domestic coal use has also led to significant reductions in emissions of sulphur dioxide. Emissions of particulates and volatile organic compounds are showing a general downward trend. These improvements contrast with a general increase in ground-level ozone concentrations, with potential to harm humans, crops and ecosystems. In addition, a decline in stratospheric ozone over Scotland has the potential to increase exposure to harmful ultraviolet radiation.
The Air Quality Strategy for England, Scotland, Wales and Northern Ireland is designed to protect human health and the environment from air pollution. It sets policy objectives and measures to tackle air quality issues from a variety of transport (not aviation), industry and domestic sources. UK health and habitat based standards and objectives are set under the strategy for the main air pollutants: 1,3-butadiene, benzene, carbon monoxide, lead, nitrogen dioxide, ozone, particles measuring 10 micrometres or less (PM 10), ozone and sulphur dioxide. Performance against objectives is monitored in places where people and sensitive habitats may be exposed to air pollution. This is done by the Government through its automatic monitoring network and by local authorities under the Local Air Quality Management regime.
Scotland currently has 14 Air Quality Management Areas 6, mainly relating to breaches of the annual mean objectives for PM 10 and NO 2 in urban areas (the exception is the area surrounding the petrochemical refinery in Grangemouth; which was established following instances in 2004 when SO 2 concentrations exceeded the annual mean objective. The objective has been met in 2005 and 2006) 7.
Potential Climate Change Impacts
Direct effects of climate change on air quality are likely to be less significant than for other SEA topics such as water or biodiversity. However some effects that may include an increase in summertime photochemical smog linked to increasing temperatures and small reductions in cloud cover. It is likely that the frequency of wintertime air quality pollution events will reduce.
Changes in air quality are governed by changes in pollutant emissions and the weather. It seems likely that climate change will result in an impact on general weather patterns, in particular, wind climatology, temperature, sunshine hours and rainfall patterns. This in turn may result in a change in the processes that govern chemical transformations in the atmosphere 8.
Indirect measures to mitigate climate change (such as improving the efficiency of buildings, reducing vehicle emissions, increasing energy derived from renewables, etc.) may result in improved air quality generally, within specific areas. However, other measures to reduce emissions could have a negative localised impact on air quality (e.g. emissions from CHP and incinerator projects).
Landscape
For its size, Scotland, with a land area of around 78,500 km 2, has the most varied geology and landscape of any country in the world ( SNH, 2002) 9. There are vast topographical and regional differences in Scotland's landscape. Key land features include a large indented coastline, mountains, glens, moorland, forests and a distinctive patchwork of farmland. A large proportion of these landscapes are of high environmental quality, valued for their natural heritage as well recreation and tourism. Over 20% of the land area is protected through various natural heritage designations.
Scottish landscapes have been influenced by thousands of years of farming, and many physical traces survive of past land use, particularly since medieval times. Individual features of the past combine to form historic landscapes and these can be significant both visually and archaeologically. SNH and Historic Scotland have systems for Landscape Character Assessment and Historic Land Use Assessments which can advise and monitor changes to the landscape character and pattern.
Increasing urbanisation led to 1,403 hectares of agricultural land being given over to roads, housing or industry in 2002 - 2003 (140% increase since 1989 - 1990). The amount of derelict and urban vacant land fell from 13,571 hectares in 1995 to 10,570 hectares in 2005. This fall is partly due to land being brought back into productive use. Residential development was the most common new use (43%) for urban vacant and derelict land since the 2004 survey.
Forestry is an important land use in Scotland using both native and non-native tree species. There are 1.33 million hectares (13,300 km 2) of woodland in Scotland, having risen from 4.5% of land area in 1905 to 11.8% in 1980 and 17.1% in 2006.
Mining and opencast coal sites are still important activities in Scotland and have considerable local significance. In 2003, there were 364 mineral workings producing 40.2 million tonnes of minerals.
Scottish landscapes can be considered a key resource for biodiversity as well as for archaeological and built heritage, tourism and the rural economy. It is also likely that future landscape-scale management measures are the most effective means of adapting to significant climate change effects, through for example, flood management at the catchment scale, habitat modifications to improve wetlands or maintain peat bogs and co-operative action across and between boundaries by land managers to address these types of measures effectively.
Potential Climate Change Impacts
Landscape will likely be affected by climate change predominantly due to the changes in land use that may result from both mitigation and adaptation measures. With respect to mitigation, landscape changes may result from measures such as increased growing of biomass crops and from on shore renewable energy developments, particularly windfarms and hydro/run of river schemes. With respect to adaptation, landscape impacts may result from measures such as flood prevention schemes and coastal defences. Managed realignment of coastal areas to adapt to flood risk may offer opportunities for landscape enhancement. It is possible that some landscape features, particularly those in coastal locations and therefore vulnerable to erosion, may be threatened by the effects of higher sea levels and higher wave heights.
Cultural Heritage (inc. Historic Environment)
Scotland's distinctive character has been shaped by some 10,000 years of human activity, where past generations have left their mark in the form of monuments, buildings and sites, in towns and cities and in the countryside, even in the patterns of streets and fields. The historic environment provides a sense of place, well-being and cultural identity and enhances regional and local distinctiveness.
Scotland has more than 44,000 listed buildings and almost 600 conservation areas.
275 sites are identified in the Inventory of Historic Gardens and Designed Landscapes.
NPPG5 notes that the actual extent of archaeological remains in Scotland is unknown 10, with the 5600 Scheduled Ancient Monuments representing only a small proportion of the 70,000 sites and monuments for which there are records, and the many more unrecorded sites throughout the country.
The historic environment can be threatened by inappropriate development, and economic decline, loss of viable use, population change and neglect are issues of relevance to both designated and non-designated sites. Land use change, including forestry activity, biomass projects and agriculture can also have significant repercussions for the historic environment.
Potential Climate Change Impacts
Direct effects of climate change on historic environment are likely to be less significant than for other SEA topics, but there is, as for landscape, the potential for impacts derived from measures to mitigate and to adapt to climate change and from its actual effects.
With respect to mitigation, historic environment impacts may result from measures such as on or off shore renewable energy developments, particularly windfarms and hydro/run of river schemes.
With respect to adaptation, cultural heritage impacts may result from measures such as flood prevention schemes and coastal defences, which have the potential to impact upon specific features which are afforded protection.
It is possible that some cultural heritage features, particularly those in coastal locations or adjacent to rivers and therefore vulnerable to erosion, may be threatened by the effects of higher sea levels, increased wave heights and increased occurrence and severity of riverine flooding.
Material Assets
For the purposes of this baseline, Material Assets are considered to comprise transport and energy infrastructure, waste resources and derelict/ vacant urban land.
Scotland's total road network is 54,776km in length 11, with a trunk road network of 3,500 km (6% of the total). It is valued at around £12.5 billion and as it is considered to be of strategic importance, is under the authority of the Scottish Ministers. Other (non-trunk) A roads represent 14% of the total. Minor roads (B and C roads and unclassified roads) account for the remaining 80% of roads.
The total route length of the railway network in Scotland is 2,736 kilometres 12, of which 639 kilometres is electrified. These figures do not represent the total length of railway track: a kilometre of single-track and a kilometre of double-track both count as one kilometre of route length. The number of passenger stations has increased from 331 in 1995-96 to 344 in 2005-06, an increase on the previous year (340).
Electricity generated from coal in Scotland declined between 2000 and 2004 (33% to 26%), but there has been a slight increase in gas and oil output (22% to 26%) over the same period. 11.5% of electricity generated in Scotland in 2004 was from renewable sources, particularly hydropower at 8.9%. The Government's target of generating 18% of electricity from renewable sources by 2010 has already been met. Further work will be required to meet the recently increased target of generating 50% of electricity from renewable sources by 2020.
SEPA monitors waste management, including the level of waste which is sent to landfill. They also record the proportion of Biodegradable Municipal Waste ( BMW), which contributes to air, soil and water pollution if sent to landfill, and is therefore a priority for reduction/ recycling targets. The amount of BMW in Scotland has declined in recent years (estimated at 1.6 million tonnes in 2005), but further work will be required if targets set under the EU Landfill Directive are to be met (1.32 million tonnes by 2010, 0.88 million tonnes by 2013, and 0.62 million tonnes by 2020).
Furthermore, the National Waste Plan aimed to ensure that 25% of municipal waste was recycled or composted by 2006. Available figures show that this stood at 22.8% in 2005 and had risen to 29.8% by June 2007 13. In January 2008 the Scottish Government announced its aim to increase to 60% the amount of municipal waste being recycled or composted by 2020 and set a new target of 70% by 2025.
The Scottish Vacant and Derelict Land Survey indicated that there were a total of 10,386 hectares of derelict and urban vacant land in Scotland in 2006. This reflects a substantial decline over the preceding decade, from more that 15,000 hectares in 1993, largely as a result of redevelopment, but also partly due to naturalisation of some areas. Much of the country's derelict and vacant land is concentrated in North Lanarkshire, Glasgow, Renfrewshire and Highland (with these areas together accounting for 44% of the total). Around a fifth of the land has been derelict or urban vacant for more than 25 years.
Potential Climate Change Impacts
Extreme weather events, flooding and subsidence are predicted to lead to increased damage to buildings and infrastructure, which may in turn increase disruption and costs. High cost material assets could be at particular risk from climate change effects (flooding, erosion etc.) depending on their location. Existing flood and coastal defences may require upgrading to account for increasing levels of risk through climate change. It is likely that new defences will be required to protect vulnerable communities and key infrastructure such as emergency services, sites providing power and water, and the transport network.
There is a problem
Thanks for your feedback