Scottish Index of Multiple Deprivation: 2009 General Report
Scottish Index of Multiple Deprivation 2009: General Report
7. Education Domain
7.1. The education domain includes indicators that measure both outcomes of education deprivation, such as children and adults with a lack of qualifications, and causes of education deprivation such as absenteeism and lack of progression to further and higher education. A full list of indicators and the relative weights is provided in Annex B.
Changes since SIMD 2006
7.2. The indicators used in SIMD 2009 are the same as for SIMD 2006, except for the indicator 'People aged 16-18 not in full time education' which has been replaced by 'People aged 16-19 not in full time education, employment or training' and uses slightly different data sources. Full details of the change can be found in the SIMD 2009 technical report. The indicator 'Working age people with no qualifications' uses census data so this data has not changed since SIMD 2006.
7.3. The change to the Not in Education, Employment or Training indicator means that care needs to be taken when comparing the 2009 education domain with SIMD 2006. The two domains are still highly correlated with a Pearson's correlation coefficient of 0.96.
Education Deprivation by Local Authority
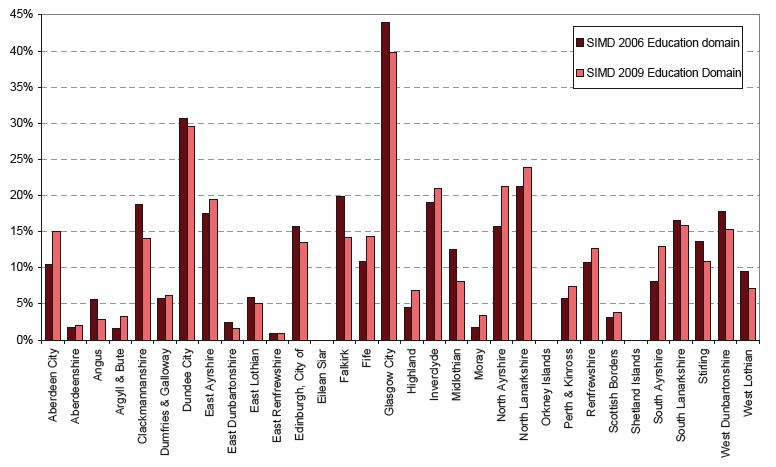
7.4. Chart 7.1 shows the proportion of datazones in each Local Authority in the 15% most deprived in the education domain, the local share. 40% of Glasgow's datazones are in the 15% most deprived in the education domain of the SIMD 2009. This is a fall from 44% in SIMD 2006. Falkirk and Clackmannanshire have also seen large decreases in the proportion of datazones in the 15% most education deprived, 6% and 5% respectively.
7.5. Increases in numbers of datazones in the 15% most education deprived have been seen in several Local Authorities with the largest in Aberdeen City and North and South Ayrshire.
7.6. Analysis of the indicators used within the education domain shows that the datazones moving into the 15% most deprived have all seen a worsening in performance on at least one of the three indicators that are comparable with SIMD 2006. 91% got worse on at least two indicators and 45% on all three.
7.7. Of the datazones that moved out of the 15% most deprived, 54% improved on two of the three indicators that are comparable with SIMD 2006 and 40% improved on all three. This demonstrates that areas have seen real as well as relative improvements.
Chart 7.1: Proportion of datazones in each Local Authority in the 15% most deprived on the Education domain of SIMD 2009, the Local Share of deprived datazones
Change over time
7.8. There have been changes in methodology used in the education domain over the three updates of the SIMD, however each index used the best indicators available at the time to identify deprived areas. It is therefore possible to look at the three versions of the index to identify which areas have been in the 15% most deprived on the education domain across the updates to the index.
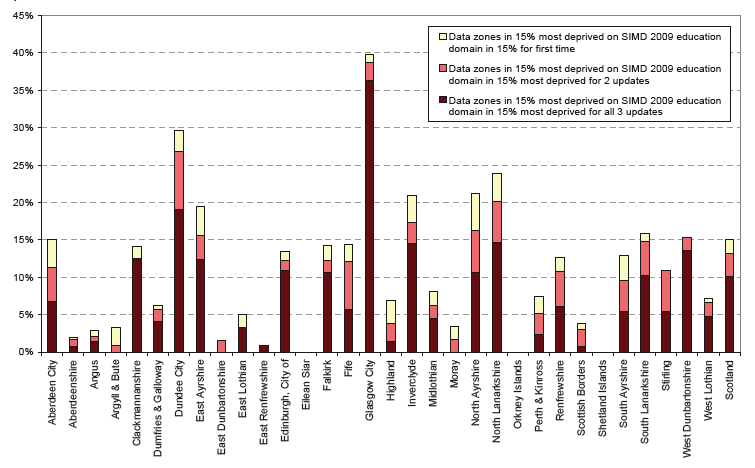
7.9. Chart 7.2 shows the proportion of each Local Authorities datazones that are in the 15% most deprived in the SIMD 2009 education domain split by the number of times the datazone has fallen into the 15% most deprived. 10% of the datazones in Scotland have fallen in the 15% most deprived on all three updates to the index with another 3% having been in once before.
7.10. These proportions vary by Local Authority. 40% of the datazones in Glasgow City are in the 15% most deprived on the SIMD 2009 education domain, with 36% of the datazones in Glasgow having been in the most deprived on all three updates to the SIMD. Clackmannanshire, Edinburgh, Falkirk and West Dunbartonshire also have relatively high proportions of datazones that have been in the most deprived on the education domain for all three updates to the SIMD suggesting continuing levels of deprivation in these areas.
7.11. Other Local Authorities such as Aberdeen City, Fife and South Ayrshire have a smaller proportion of datazones that have been in the 15% for the three updates but these are explained by increases in deprived datazones seen in these areas on the education domain of SIMD 2009.
Chart 7.2: Percentage of each local Authorities datazones in the 15% most deprived on the SIMD 2009 education domain by the number of times they've been in the 15% most deprived
There is a problem
Thanks for your feedback