The Scottish Health Survey 2019- volume 2: technical report
Presents information on the methodology and fieldwork from the Scottish Health Survey 2019.
This document is part of a collection
Chapter 1: Methodology and Response
Ben Cook, Victoria Wilson and Xanthippi Gounari
1.1 Introduction
1.1.1 The Scottish Health Survey series
The Scottish Health Survey (SHeS) series was established in 1995 to provide data about the health of the population living in private households in Scotland. It was repeated in 1998 and 2003 and has been carried out annually since 2008.
The 2018-2021 surveys are being conducted by ScotCen Social Research in collaboration with the Office for National statistics (ONS), the Social and Public Health Sciences Unit (MRC/CSO SPHSU) at the University of Glasgow, the Centre for Population Health Sciences at the University of Edinburgh and the Public Health Nutrition Research Group at the University of Aberdeen[1].
1.1.2 Aims of the Scottish Health Survey
The purpose of SHeS is to provide information at national level about the health of the population and the ways in which lifestyle factors are associated with health. This level of information is not available from administrative or operational databases, as hospitals and GPs are not able to collect detailed information about peoples’ lifestyles and health- related behaviours. In addition, it is crucial that the Scottish Government has information about the health of the population, including people who do not access health services regularly.
The specific aims of SHeS are:
- To estimate the prevalence of particular health conditions in Scotland.
- To estimate the prevalence of certain risk factors associated with these health conditions and to document the pattern of related health behaviours.
- To look at differences between regions and between subgroups of the population in the extent of their having these particular health conditions or risk factors, and to make comparisons with other national statistics for Scotland and the rest of Britain.
- To monitor trends in the population’s health and health related behaviour over time.
- To make a major contribution to monitoring progress towards health targets.
Each year, the survey consists of a set of core questions and measurements (height and weight measurements and, if applicable, a measure of blood pressure and waist circumference, and analysis of a saliva sample), plus modules of questions on specific health conditions. As with the earlier surveys in the series, the principal focus of the 2018-2021 surveys remains cardiovascular disease (CVD) and related risk factors. CVD is one of the leading contributors to the global disease burden. Its main components are ischaemic heart disease (IHD) and stroke. Coronary heart disease (CHD) continues to be one of the leading causes of death in Scotland with 6,615 deaths in 2018 where it was the underlying cause[2].
The SHeS series now has trend data going back 24 years and providing this time series is an important function of the survey.
1.1.3 Key changes to the survey methodology in 2012
A number of changes to the survey methodology were introduced following the 2011 Scottish Government review of Scotland’s major household surveys. The key changes to SHeS introduced in 2012 were:
- Sample of addresses drawn by the Scottish Government.
- Inclusion of a set of harmonised core questions asked across the three major Scottish Government household surveys[3].
- Reduction in the achieved sample size.
- Discontinuation of a module of questions on Knowledge, Attitudes and Motivations (KAM) to health.
- Introduction of interviewer administered biological samples and measurements to replace the nurse interview.
These changes are discussed in greater detail in the Scottish Health Survey 2012: Volume 2 Technical Report[4] and in the Scottish Health Survey Questionnaire Review Report 2012-2015[5].
1.1.4 Key changes to the survey methodology in 2018
A number of changes were introduced in light of the 2017 Scottish Government review of the Scottish Surveys Core Questions[6], and following the 2016 Scottish Government consultation on the Scottish Health Survey questionnaire content[7] which was published in Spring 2017. The key changes implemented in 2018 for the 2018-2021 surveys include:
- Increased sample size allowing for analysis at Local Authority level by 2021.
- Removal of local police force, contraception and cosmetic procedures questions.
- Removal of urine sample from the biological module.
- A number of modules will no longer appear in the questionnaire each year, but will appear approximately every 2 years: gambling, problem drinking, dental health services, parental history, respiratory health, CPR training and use of health services.
- New questions introduced asked about satisfaction with key public services, Nicotine Replacement Therapy (NRT), asthma, type of diabetes and gender identity.
These changes are discussed in greater detail in section 1.3 below and also in the Scottish Health Survey Report of Questionnaire Changes from 2018[8]. The final questionnaire documentation for 2018 can be found in Appendix A of the Scottish Health Survey 2018 Technical Report [9].
1.1.5 The 2019 survey
The 2019 Scottish Health Survey was designed to provide data at national level about the population living in private households in Scotland. The survey covered all ages.
The sample size for the 2019 survey increased by approximately 31% compared with the 2012-2017 surveys. ScotCen Social Research enlisted the Office for National Statistics (ONS) to assist with the interviewing for the duration of the 2018-2021 contract. As a result, ONS were allocated approximately 30% of the sampled addresses.
An initial sample of 11,691 addresses was drawn from the Postcode Address File (PAF) in 2019. These addresses comprised four sample types: main (core) sample with biological measures, main (core) sample without biological measures, child boost screening sample, and Health Board boost sample. Fife opted to boost the number of adults (16+) interviewed in their area in 2019.
Additional sample (398 addresses) was drawn and introduced in the second half of 2019 in order to boost the main (core) sample.
The 11,691 addresses were grouped into 569 interviewer assignments, with around 47 assignments being issued to interviewers each month between January and December 2019. The additional reserve sample addresses were grouped into 8 new assignments, with some of these addresses added to existing interview assignments.
The table overleaf shows the total number of addresses (mainstage and additional) drawn for each sample type and the people eligible for interview within each sample type.
| Sample type | Number of addresses issued in 2019 |
Eligible for interview |
|---|---|---|
| Main (core non-bio) | 4,307 | Max of 10 adults (age 16+) and 2 children (age 0-15) |
| Main (core bio) | 2,144 | Max of 10 adults (age 16+) and 2 children (age 0-15) with only adults eligible to take part in the bio module |
| Child boost | 5,425 | Only households containing children aged 0-15 were eligible to participate (up to two children at these households were eligible to be interviewed) |
| Health Board boost | 213 | Adults only (age 16+) (Max of 10) |
| Total | 12,089 |
Data collection involved a main computer assisted interview (CAI), a paper self-completion questionnaire, height and weight measurements and, if applicable, adults also completed the biological module. The main core sample (including the additional sample) consisted of 6,451 addresses, 2,144 of which were allocated to the biological module sample. At the biological module addresses, all adults (16+) that participated in the main interview were eligible to take part in the biological module. Only interviewers that were specially trained in administering biological measures and samples were allocated to work on these addresses.
1.1.6 The 2019 SHeS annual report
The 2019 report consists of two volumes, published as a set under ‘The Scottish Health Survey 2019’. Volume 1 presents results for adults and children on a variety of health topics. This report (Volume 2) provides methodological information and survey documentation. Both volumes are available on the Scottish Government’s website along with a short summary report of the key findings from the 2019 survey (https://www.gov.scot/collections/scottish-health-survey) Supplementary web tables are also available on this website. These provide a large number of breakdowns by age group, deprivation, income and limiting long-term conditions. An interactive app is also available presenting key indicators for Scotland, NHS Boards and local authority areas.
1.1.7 Comparisons with previous surveys in the SHeS series
In the 2019 report comparisons are made with data collected earlier in the series (1998-2018 for children and 2003-2018 for adults). Having such an extensive trend period makes it possible to comment on whether any changes in health behaviours identified between years were real or an instance of sample fluctuation.
In addition, this report includes analysis from a number of combined datasets: one for the years 2016 to 2019 combined, one for the years 2018 and 2019 combined to aid analysis of small subsamples of the population, and one for the years 2017 and 2019 for the analysis of questions which are included in the survey every second year. Combining data across years in this way allows for a more detailed analysis of subgroups in the sample and allows for analysis of questions with small sample sizes in one survey year. For example, questions on anxiety and depression are only asked as part of the biological sample and so result in a small sample size annually. Tables in the report indicate whether the figures presented are based on a single year’s data or combined data across survey years.
1.1.8 Health Board level analysis
Since 2008, the SHeS sample has been designed to be representative of adults at Health Board level (for all Health Boards) following four years of data collection. Analysis of the 2016 to 2019 data by NHS Health Board and by local authority for those authorities where the sample size is large enough is published at the same time as this report, and is available on the SHeS website (https://www.gov.scot/collections/scottish-health-survey) Health Boards
with larger samples may be able to analyse data at their Health Board level based on fewer years of data collection and users should consult the SHeS website for further guidance on sub-geographies analysis.
Changes in the sample design for the 2012 survey mean that users are not advised to combine data for periods spanning 2011 and 2012. Going forwards, however, the sample has been designed to be representative of the population of Scotland at Health Board level for every four-year period. Hence the survey can be analysed using combined data from 2012 to 2015, 2013 to 2016, 2014 to 2017, 2015 to 2018 or 2016 to 2019.
1.1.9 Local authority level analysis
From 2018 onwards, the SHeS sample has been designed to be representative of adults at local authority level following four years of data collection. Thus, the data will be representative of adults at local authority level from 2021. Until then, the data remains representative at Health Board level as discussed above. The exception to this are those local authorities where the sample size is large enough before four years of data have been collected.
1.1.10 Access to SHeS data
Data from the 2019 survey will be deposited at the UK Data Service along with a combined 2016-2019 dataset, a combined 2017/2019 dataset and a combined 2018/2019 dataset. Datasets from earlier years in the series are also deposited here (www.ukdataservice.ac.uk).
1.2 Sample Design
1.2.1 Requirements
The sample specification for the 2019 SHeS was designed by the Scottish Government. The design was coordinated with the designs for the Scottish Household Survey (SHS) and the Scottish Crime and Justice Survey (SCJS) as part of a survey efficiency project and to allow the samples of the three surveys to be pooled for further analysis[10].
There were three elements to the SHeS sample in 2019:
1) Main adult sample - to allow annual reporting of Scotland level results and results at Health Board level at the end of four-year cycles (e.g. 2016-2019). This required an annual interview target of 5,112 adults for Scotland as a whole and a minimum of 125 for each local authority. There was an additional requirement for a minimum of 1,000 adults to complete each biological measure each year.
2) Child sample boost – overall there was a requirement for 2,031 child interviews for Scotland. As the main sample was only expected to yield 1,026 child interviews, a further 1,005 interviews were required from a separate boost sample.
3) Health Board boosts – in 2019, Fife Health Board commissioned a boost to increase the number of adult interviews in their Board area. Fife Health Board specified a target of 185 additional interviews.
1.2.2 Sample design and assumptions
For all three elements a two-stage clustered sample design with intermediate geographies randomly selected at the first stage and address points at the second stage, was used. With the exception of Orkney, Shetland and Na h-Eileanan Siar councils, the sample was clustered by intermediate geographies (IG) with one quarter of IGs selected for each year of fieldwork. This means that over four years of fieldwork all IGs are included in the sample and the combined 2016-2019 sample will be un-clustered. In Orkney, Shetland and Na h-Eileanan Siar the sample was clustered by data zone.
1.2.3 Main sample
As stated above, the annual sample size for Scotland was 5,112 adults with a minimum local authority sample size of 125 adults. These sample sizes were the minimum required to allow effective reporting of Scotland-level results annually and Health Board results at the end of the four-year cycle. An iterative approach was taken to efficiently allocate the sample across all Health Boards. For the first iteration 4,000 adult interviews were allocated across local authorities in proportion to the adult population. Any local authorities allocated fewer than 125 adult interviews had their allocation increased to 125.
The remaining sample was then allocated over the remaining local authorities. Where allocations were not whole numbers the number was rounded up. This resulted in a total target of 5,112 adult interviews. The results of the allocation are shown in Table 2.
| Health Board | Target Annual Adult Interviews |
|---|---|
| Ayrshire and Arran | 375 |
| Borders | 125 |
| Dumfries and Galloway | 125 |
| Fife | 271 |
| Forth Valley | 375 |
| Grampian | 488 |
| Greater Glasgow and Clyde | 1,075 |
| Highland | 297 |
| Lanarkshire | 482 |
| Lothian | 749 |
| Orkney | 125 |
| Shetland | 125 |
| Tayside | 375 |
| Western Isles | 125 |
| Total | 5,112 |
To allow for reporting at local authority level over a four-year period and coordination with the sample selection of the SHS and SCJS, the required sample sizes were set at local authority level. This was done by allocating the target Health Board samples to local authorities proportionate to population.
The number of addresses selected in order to provide the target number of interviews was calculated by:
1) Estimating the number of productive adult interviews per co-operating household. Based on response data from the surveys between 2012 and 2015, it was estimated that for Greater Glasgow and Clyde there would be 1.45 interviews per co-operating household, with 1.5 interviews in all other Health Boards.
2) Allocation of the target interviews and associated estimate of co-operating households to local authority strata proportionate to population.
3) The response rate assumptions for local authorities for 2019 were then based on the weighted average of responses for 2015, 2016 and 2017.
4) The final step was to estimate the level of ineligible addresses. The estimates were calculated at local authority level and based on the average level of ineligible addresses from previous years of SHeS, SHS and the SCJS.
Table 5 shows the number of selected addresses for the main sample in 2019.
1.2.4 Child boost sample
For the 2019 survey, 2,031 child interviews were required. It was estimated that the main sample would provide 1,026 child interviews, therefore, to reach the target number of child interviews, a child boost sample was required to yield a further 1,005 interviews.
The process for calculating the number of addresses to select for the child boost sample was as follows:
1) The child boost sample of 1,005 child interviews was allocated proportionally to local authorities based on the child (under 16) population. If the number expected from the child boost was less than 10, then the local authority boost target was set to zero. The following table shows the target sample sizes for the main sample and child boost sample by Health Board.
| Expected child interviews from main sample | Child interviews from boost | Total child interviews | |
|---|---|---|---|
| Ayrshire and Arran | 75 | 70 | 145 |
| Borders | 25 | 21 | 46 |
| Dumfries and Galloway | 25 | 27 | 52 |
| Fife | 54 | 71 | 125 |
| Forth Valley | 75 | 60 | 135 |
| Grampian | 97 | 110 | 207 |
| Greater Glasgow and Clyde | 219 | 216 | 435 |
| Highland | 60 | 59 | 119 |
| Lanarkshire | 97 | 131 | 228 |
| Lothian | 149 | 163 | 312 |
| Orkney | 25 | 0 | 25 |
| Shetland | 25 | 0 | 25 |
| Tayside | 75 | 77 | 152 |
| Western Isles | 25 | 0 | 25 |
| Total | 1,026 | 1,005 | 2,031 |
2) The number of co-operating households with children required in each Health Board for the child boost sample was estimated using the performance of the child boost samples in the surveys between 2013 and 2015.
3) To estimate the proportion of child-less households, data from child boost samples between 2012 and 2015 was used. As there was little variation across different areas a Scotland level estimate of households without children (80%) was used.
4) Analysis of survey response to the child boost samples in the 2008 and 2009 surveys found that the response rate was consistently higher for the child boost than the main sample. Therefore, for each Local Authority area, the estimated response rates for the child boost sample were set at 6% higher than the main sample response rate.
5) The assumptions made on ineligible addresses for the main sample were applied to the address calculations for the child boost sample.
The total numbers of addresses selected for the child boost sample are shown in Table 5.
1.2.5 Health Board Boost samples
Each year individual Health Boards are given the opportunity to fund a boost sample to enable them to boost the number of adult interviews in their Board area. For the 2019 survey, Fife opted to boost the main sample in their areas. The following table shows the target sample size for each of the boosts.
| Health Board | Target interviews for boost |
|---|---|
| Fife | 185 |
As the main sample was selected before boost areas were confirmed, boost samples were supplementary to the main sample. Fife Health Board requested that the combined main sample and boost sample was equally distributed across its three Community Health Partnership areas. This required an extra level of stratification for Fife before the process above could be followed. For the boost samples, and for samples drawn to addresses shortfalls over the four-year period, the same active PSUs as the main sample were used.
| Sample strata | Main sample (inc. additional) | Health Board boost | Child boost | Total sample |
|---|---|---|---|---|
| Aberdeen City | 222 | 0 | 217 | 439 |
| Aberdeenshire | 200 | 0 | 257 | 457 |
| Angus | 150 | 0 | 102 | 252 |
| Argyll & Bute | 185 | 0 | 85 | 270 |
| Clackmannanshire | 160 | 0 | 58 | 218 |
| Dumfries & Galloway | 168 | 0 | 138 | 306 |
| Dundee City | 172 | 0 | 139 | 311 |
| East Ayrshire | 124 | 0 | 109 | 233 |
| East Dunbartonshire | 156 | 0 | 101 | 257 |
| East Lothian | 158 | 0 | 121 | 279 |
| East Renfrewshire | 171 | 0 | 110 | 281 |
| Edinburgh, City of | 492 | 0 | 507 | 999 |
| Eilean Siar | 146 | 0 | 0 | 146 |
| Falkirk | 178 | 0 | 168 | 346 |
| Fife | 312 | 213 | 372 | 897 |
| Glasgow City | 560 | 0 | 602 | 1,162 |
| Highland | 206 | 0 | 240 | 446 |
| Inverclyde | 175 | 0 | 82 | 257 |
| Midlothian | 156 | 0 | 106 | 262 |
| Moray | 146 | 0 | 87 | 233 |
| North Ayrshire | 134 | 0 | 128 | 262 |
| North Lanarkshire | 324 | 0 | 398 | 722 |
| Orkney Islands | 129 | 0 | 0 | 129 |
| Perth & Kinross | 166 | 0 | 141 | 307 |
| Renfrewshire | 212 | 0 | 195 | 407 |
| Scottish Borders | 146 | 0 | 112 | 258 |
| Shetland Islands | 143 | 0 | 0 | 143 |
| South Ayrshire | 154 | 0 | 96 | 250 |
| South Lanarkshire | 283 | 0 | 335 | 618 |
| Stirling | 154 | 0 | 87 | 241 |
| West Dunbartonshire | 199 | 0 | 106 | 305 |
| West Lothian | 170 | 0 | 226 | 396 |
| Total | 6,451 | 213 | 5,425 | 12,089 |
1.2.6 Sample Selection
The Royal Mail’s small user Postcode Address File (PAF) was used as the sample frame for the address selection. The advantages of using the PAF are as follows:
- It has previously been used as the sample frame for Scottish Government surveys so previously recorded levels of ineligible addresses can be used to inform assumptions for 2019 sample design.
- It has excellent coverage of addresses in Scotland.
- The small user version excludes the majority of businesses.
The PAF does still include a number of ineligible addresses, such as small businesses, second homes, holiday rental accommodation and vacant properties. A review of the previous performance of individual surveys found that they each recorded fairly consistent levels of ineligible address for each local authority. This meant that robust assumptions could be made for the expected levels of ineligible addresses in the sample size calculations.
As the samples for the SHS, SHeS and SCJS have all been selected by the Scottish Government since 2012, addresses selected for any of the surveys are removed from the sample frame so that they cannot be re-sampled for another survey. This helps to reduce respondent burden. The addresses are removed from the sample frame for a minimum of four years.
The sample design specified in Section 1.2 was implemented in three stages:
1. All primary sampling units (data zones on the islands, intermediate geographies elsewhere) were randomly allocated to one of the four years of fieldwork. This meant that the sample was drawn from one quarter of PSUs each year and ensured that over four years (2016 to 2019) of fieldwork all addresses had a non-zero probability of selection. One quarter of target adult sample was required to complete the biological module. To make fieldwork more efficient, rather than randomly allocating addresses from the entire survey to the module, each year PSUs were allocated to the biological module and all selected addresses within those PSUs were eligible for the biological interview. To guard against a lower response rate to the different elements of the biological module, and to correct for inaccurate response assumptions in previous years, a proportion higher than the required one quarter of PSUs (33% in 2019) were allocated to the biological module.
| Health Board | PSUs in 2019 Sample | Total PSUs |
|---|---|---|
| Ayrshire and Arran | 23 | 92 |
| Borders | 8 | 29 |
| Dumfries and Galloway | 9 | 35 |
| Fife | 26 | 103 |
| Forth Valley | 19 | 74 |
| Grampian | 32 | 128 |
| Greater Glasgow and Clyde | 64 | 273 |
| Highland | 19 | 76 |
| Lanarkshire | 39 | 137 |
| Lothian | 44 | 177 |
| Orkney | 7 | 27 |
| Shetland | 8 | 30 |
| Tayside | 23 | 90 |
| Western Isles | 9 | 36 |
| Total | 330 | 1,307 |
2. The required numbers of addresses for the main and child boost samples were combined to give an overall total of addresses to sample for each stratum (local authorities plus Lanarkshire’s split). The overall number of addresses for each stratum was then sampled from the sample frame of addresses in active PSUs. Systematic random sampling was used with addresses within PSUs ordered by urban-rural classification, SIMD rank and postcode.
3. Once the overall sample was selected, each address was randomly allocated to the main or the child boost sample.
1.2.7 Selecting households at addresses with multiple dwellings
A small number of addresses have only one entry in the Postcode Address File (PAF) but contain multiple dwelling units. Such addresses are identified in the PAF by the Multiple Occupancy Indicator (MOI). To ensure that households within MOI addresses had the same probability of selection as other households, the likelihood of selecting the addresses was increased in proportion to the MOI. At addresses with more than one dwelling unit fieldworkers have a programme to randomly select the household at which interviews should be sought. There are generally a few cases where the MOI on the PAF is inconsistent with the actual number of dwelling units. When this occurred, the fieldworkers recorded the information and a correction was made through the survey weighting.
1.2.8 Selecting individuals within households
For both the main and Health Board boost samples all adults aged 16 and over in responding households were selected for interview. To ease respondent burden, for child interviews for both the main and the child boost samples a maximum of two children were interviewed at each household. If a household contained more than two children, then two were randomly selected for interview.
1.3 Topic coverage
1.3.1 Introduction
Topics covered in the 2018 to 2021 surveys were agreed following a consultation carried out in 2017[11]. Many of the topics and questions included in earlier years of the survey were included again to continue the time series. The 2019 survey included the same rotating topics as the 2017 and 2015 surveys (see sections 1.3.3 and 1.3.4). As with previous years, the 2019 survey had a focus on cardiovascular disease (CVD) and its associated risk factors.
The outcome of a public consultation about the content of the survey from 2018 is available from http://www.gov.scot/Resource/0053/00537370.pdf. This report outlines the key changes that have been made or will be made to the 2018-2021 surveys.
1.3.2 Documentation
Copies of all the documents used in data collection are included in Appendix A. Full copies of the questionnaire documentation used in the main interview and biological module are also included in Appendix A. Protocols for taking measurements (height, weight, waist circumference and blood pressure) and collecting biological samples (saliva) are available on request from ScotCen Social Research. A summary of the main interview content and the content of the biological module is provided below.
1.3.3 Main interview
Information was collected at both the household and individual level. Table 7 below summarises the content of the individual level interviews for all participants. The topics a participant was asked depended both on their age and the sample type to which their address had been allocated. The age criteria for each topic are included in brackets following the topic name.
| Core Sample – Main interview outline | |
|---|---|
| Version A | Version B |
| Household questionnaire including household composition | |
| General health (0+) including use of CVD services (0+) | |
| General CVD (16+) | |
| Asthma (0+) | |
| Physical activity adults (16+) and children (2-15) | |
| Sedentary activity adults (16+) and children (2-15) | |
| Eating habits children (2-15) | |
| Fruit and veg consumption (2+) | |
| Vitamins and supplements (0+) | |
| Smoking and Drinking (16+) [16-19 in a self-completion] | |
| Passive smoking (0+) | |
| Dental health (16+) | |
| Dental services (16+) | |
| CPR training (16+) | |
| Discrimination and harassment (16+) | |
| Stress at work (16+) | |
| Economic activity (16+) | |
| Education (16+) | |
| Ethnic background, religion and country of birth (0+) | |
| Parental history (16+) | |
| Family health (16+) | |
| Self-completions (13+ & parents of 4-12 yr olds) | |
| Height (2+) and Weight (2+) | |
| Data linkage & follow-up research consents (0+) | |
| - | Biological module (16+) |
Version A households accounted for 67% of the main (core) sample. At these households the questionnaire included the core questions and the questions included in the Version A rotating module. In 2019, the topics included in the Version A rotating module were: dental services, discrimination and harassment, stress at work, parental history and family health.
Version B households accounted for the remaining 33% of the main (core) sample. At these addresses, participants were only asked the core questions during the main interview, with participating adults (aged 16+) also eligible to complete the biological measures module.
A significant number of changes were made to the questionnaire content in advance of the 2018 survey based on the consultation that took place in Autumn 2016 and was published in Spring 2017[12]. These changes are discussed below and in the Scottish Health Survey: Report of Questionnaire Changes from 2018[13].
In 2018, a number of modules were made less frequent and will no longer be asked on an annual basis in the main interview but will be asked biennially instead. These questions include those on family health and parental history, CPR training and use of health services.
There were also a few new questions added to the main interview in 2018. These include a question for those who have used a form of Nicotine Replacement Therapy (NRT) to aid smoking cessation, two questions concerning asthma; firstly, school absence due to asthma and secondly, treatment received for asthma, a question establishing whether respondents with diabetes have Type 1 or Type 2, and finally questions on respondents’ satisfaction with local services (for example local health services, local schools, refuse collection, public transport, council libraries, etc.).
A number of small amendments were also made to survey questions in 2018 (for example, updates to education qualifications). For full details of these please see the Scottish Health Survey: Report of Questionnaire Changes from 20188.
Significant changes were made to the child physical activity questions in 2017. These changes were designed to measure the activity guidelines of being physically active for at least 60 minutes per day for each day of the week (children aged 5 and over). This involved amending the questions. Previously, children were asked for the number of days on which they did physical activity and for the average amount of time this was for overall. The revised questions ask which days they did physical activity and the amount of time spent on each of those days (more information is provided in the Physical Activity chapter of the Main Report). These questions remained as they were for 2018.
Analysis of the 2017 data showed that it was not possible to derive a variable which would allow comparison between 2017 data (using the revised questions) and previous years of data (using the previous questions). For this reason, there is no trend analysis for children’s physical activity in 2017 or 2018. The question module used prior to 2017 was reinstated in the 2019 survey and is reported in the Scottish Health Survey 2019: Volume 1 report.
The full question wording of all the questions used in 2019 can be found in Appendix A.
1.3.4 Self-completion questionnaire
Participants aged 13 and over and parents of participants aged between 4 and 12 were asked to fill in a self-completion booklet during the interview. In all, four different booklets were administered. The version completed was dependent on the age of the participant.
The booklet for young adults aged 16-17 included questions on smoking and drinking behaviour (instead of these being asked as part of the CAPI interview). Interviewers also had the option of using this young adults booklet for those aged 18-19 if they felt that it would be more appropriate for them to answer the questions in this format rather than face to face (e.g. they might be more likely to give more honest answers than in the face to face interview when other household members including parents may be present).
For 2018, a number of questions were removed from the self-completion booklet and will occur less frequently from 2018 onwards. Questions on contraception and cosmetic procedures were removed indefinitely from both the young adult and adult self-completion. Questions on problem drinking and gambling will be asked less frequently, with problem drinking questions asked biennially and gambling questions asked every few years.
In 2018, a new question was added to the self-completion booklet. This question concerned gender identity and allowed for the expression of non-binary gender identities. This question was added to both the young adult and adult self-completion booklets. For the wording of the questions in full, see the adult or young adult self-completion booklet listed in Appendix A.
Paper questionnaire booklets contained the following topics in the 2019 survey:
Adults General Health Questionnaire (GHQ12), Warwick Edinburgh Mental Well-being scale (WEMWBS), food insecurity, problem drinking (AUDIT), adverse childhood experiences (ACEs), social capital, loneliness, sexual orientation, and gender identity.
Young adults Smoking (including use of e-cigarettes), drinking, problem drinking (AUDIT), GHQ12, WEMWBS, food insecurity, adverse childhood experiences (ACEs), social capital, loneliness, sexual orientation and gender identity.
13-15 year olds GHQ12 and WEMWBS.
Parents of 4-12 Strengths and Difficulties questionnaire (SDQ)
year olds (designed to detect behavioural, emotional and relationship difficulties in children).
1.3.5 Height and weight
Interviewers measured the height and weight of all participants aged 2 and over, with their consent. Protocols for taking height and weight measures are available on request from ScotCen Social Research.
1.3.6 Biological module
As highlighted previously, a sub-sample (around 33%) of main core sample addresses, adults (aged 16 and over) were selected to complete the biological module. Since 2012, specially trained interviewers have been collecting the measurements and samples which were collected by nurses in previous years (1995 to 2011).
Since the same interviewer administered the main interview and the biological module, the latter could be completed either immediately after the main interview or on a separate occasion.
From 2018, urine is no longer collected as part of the biological module. The rest of the biological remained the same as previous years.
As part of the biological module, participants were asked whether they used any medicines, pills, syrups, ointments, puffers or injections prescribed to them by a doctor or nurse. If participants had answered yes to questions in the main interview about taking medication for high blood pressure, a heart condition or stroke then they would be asked to give the names of the drugs to the interviewer. This information is used to interpret blood pressure readings. Following these questions, interviewers took blood pressure and waist circumference measurements from participants taking part in the biological module.
Participants were also asked about current smoking behaviours and whether they currently used Nicotine Replacement Therapies (NRT). This information is used to interpret the analysis of salivary cotinine. Written agreement was sought to take samples of saliva for the analysis of cotinine (a derivative of nicotine and indicative of passive smoking).
Finally, participants were asked a set of questions about depression, anxiety, suicide attempts and self-harm (taken from the Adult Psychiatric Morbidity Survey) in computer assisted self-interviewing (CASI) format whereby the participant answered the questions themselves using the interviewer’s laptop.
See Table 8 for a complete outline of the biological module.
Table 8: Content of the 2019 Biological Module
Outline of the Biological Module (age 16+)
- Prescribed medicines (if has heart condition, high blood pressure or has had stroke)
- Blood pressure
- Waist measurement
- Smoking status and use of nicotine replacement therapy
- Saliva sample
- Depression, anxiety, suicide attempts and self-harm
1.4 fieldwork procedures
1.4.1 Advance letters
Each sampled address was sent an advance letter that introduced the survey and let the resident know that an interviewer would be calling to seek permission to interview. A number of versions of the advance letter were used in 2019; one for the core version A and Health Board boost addresses, one for core version B addresses (with the biological module), and one for child boost addresses. There was a version of each of these letters for each organisation conducting interviews (ScotCen Social Research and ONS). A copy of the survey leaflet was included with every advance letter. The survey leaflet introduced the survey, described its purpose in more detail and included some summary findings from previous surveys.
For copies of the advance letters and survey leaflet, see the documents listed in Appendix A.
1.4.2 Making contact
At initial contact, the interviewer established the number of dwelling units (DUs) and/or households (HHs) at an address and made any necessary selections (see Section 1.2).
The interviewer then attempted to make contact with each household. In the main sample they attempted to interview all adults (up to a maximum of ten) and up to two children aged 0-15 (see Section 1.2) from the household. At child boost sample households, interviewers first screened for children aged 0-15. In those households where children were present up to two children were randomly selected for interview. Interviewers obtained the verbal consent of both the parent/guardian and the child before commencing the interview. For Health Board boost sample households, interviewers attempted to interview a maximum of ten adults. Children were not eligible for interview at Health Board boost addresses.
1.4.3 Collecting data
Interviewers used computer assisted interviewing (CAI).
At each co-operating eligible household (across all sample types), the interviewer first completed a household questionnaire, with information collected from the household reference person[14] or their partner wherever possible. This questionnaire obtained basic information (including date of birth and relationship to other household members) about all members of the household, regardless of age and whether they were eligible to take part in the interview. The computer assisted personal interviewing (CAPI) program then created individual questionnaires for each eligible participant in the household.
Where possible an individual interview was then conducted with all eligible adults and children in a household. In order to reduce the amount of time spent in the home, interviews could be carried out concurrently, with the program allowing up to four participants to be interviewed in a single session.
Height and weight measurements were usually obtained towards the end of the interview, although could be conducted at any time during the last half of the interview.
In addition to an advance letter and general survey leaflet, participants were also given a more detailed leaflet describing the contents and purpose of the interview, and what will happen to information they provide (including a link to the Privacy Notice on the Scottish Government’s website). Adults in households eligible for the biological module were given a longer version of this leaflet, providing information about the measurements and samples being taken.
A separate version of this leaflet was used for children in both main and child boost households. Parents at child boost addresses were also provided with a leaflet containing background information on the survey. Adults at Health Board boost addresses received an amended version of the adult leaflet. Copies of all the participant leaflets used in the survey are included in Appendix A.
1.4.4 Introducing the biological module
Only a sub-sample of adults in the main sample were selected to take part in the biological module. At the end of the individual interview, adult participants in Version B addresses were given a measurement record card which included additional information about the measurements and samples collected in the biological module. Wherever possible, interviewers would complete the module directly after the main interview to minimise attrition. If this was not possible then the interviewer would arrange to go back at a convenient time to complete the module and take the measurements and samples. The module included the measurements described in Section 1.3.6. Written consent was obtained from participants before the saliva sample was taken. The consent statement is included in Appendix A.
1.4.5 Interviewing and measuring children
Children aged 13-15 were interviewed directly by interviewers, after verbal consent had been obtained from both the child and their parent or guardian. Interviewers were instructed to ensure that the child’s parent or guardian was present in the home throughout the interview. Information about younger children (aged 0-12) was collected directly from a parent or guardian. Whenever possible, younger children were present while their parent or guardian answered questions about their health. This was partly because the interviewer had to take the child’s height and weight measurements, but it also ensured that the child could contribute information where appropriate (for example, about physical activity done during school time).
1.4.6 Feedback to participants
If participants wished, interviewers recorded their height and weight measurements within their information leaflet. Participants kept the information leaflet and thus had a record of their height and weight, if they wished.
Participants eligible for the biological module were given an additional document; the biological measurement record card. If participants had their waist measurement and blood pressure taken, then interviewers recorded their results on this card (if the participant wished). As before, participants could keep this measurement record card and thus had a note of their measurements.
For the biological module, interviewers were issued with a set of guidelines to follow when commenting on participants’ blood pressure readings. If the participant’s blood pressure was mildly raised, they were instructed to advise the participant to contact their GP within 2 months. If the participant’s blood pressure was moderately raised, they were instructed to advise the participant to contact their GP within 2 weeks. Finally, if the participant’s blood pressure reading was considerably raised, interviewers advised the participant to visit their GP within 5 days and interviewers were instructed to contact the survey doctor at the earliest opportunity. The survey doctor would then phone the participant and advise them to contact their GP as soon as possible.
1.5 Fieldwork quality control and ethical clearance
1.5.1 Training interviewers
Interviewers new to SHeS were fully briefed on the survey’s content and procedures. They were also trained and accredited in taking height and weight measurements. Interviewers were accompanied by an interviewer supervisor during the early stages of their work to ensure that interviews were administered correctly, and protocols were followed. Interviewers are supervised in field every year following a successful launch.
Interviewers that had worked on SHeS in previous years attended a refresher briefing ahead of the launch of the new survey year. This refresher briefing informed participants of changes to survey content and procedures for 2019. Interviewers were also re-accredited to take height and weight measurements by the research team.
Interviewers interested in administering the biological module were initially screened for suitability. Minimum competency levels were set and only interviewers that met the set criteria were invited to training and accreditation sessions.
Training to administer the biological module took place over two days. At the end of the training session interviewers were accredited in administering each of the measurements and samples and were only able to work on the module if they passed this accreditation process.
Interviewers were accompanied by a nurse supervisor (with previous experience working on the survey) on their initial biological module visit. They are also supervised in the field annually by an experienced survey nurse to ensure they are administering the measurements and samples in line with SHeS protocols. Interviewers are reaccredited annually for the biological module by the research team and survey nurses at the refresher briefings.
Full sets of written instructions, covering both survey procedures and measurement protocols, were provided to interviewers (measurement protocols are available on request from ScotCen Social Research).
1.5.2 Checking interviewer and measurement quality
A large number of quality control measures were built into the survey at the data collection stage and thereafter, to monitor the quality of interviewer performance.
Recalls were carried out at 10% of productive households. These recalls checked with the participants that interviewers had followed the correct survey procedures when conducting the interview.
In addition to the recall procedure, the computer program used by interviewers had in-built soft checks (which can be suppressed) and hard checks (which cannot be suppressed) associated with particular interview questions. When uncommon or unlikely answers were entered, or answers outside a predetermined range, these checks were triggered and appear as a warning message on the interviewers’ laptop. The interviewer is either encouraged to double-check the entered response (a soft-check) or asked to change it (a hard-check). For example, when young children were weighed by having an adult hold them; the weight of the adult on their own was entered into the computer followed by the combined weight of the infant and adult. A hard check was used to ensure that the weight entered for the adult alone did not exceed the weight of the infant and adult combined.
Soft-checks were similar to hard-checks, however they could be suppressed. For example, soft-checks were applied to height measurements; if an interviewer entered a respondent’s height to be in excess of 1.93 metres (6 feet 3 inches), a message appeared asking the interviewer to confirm that this entry was correct. The interviewer could suppress the soft-check once they had confirmed that the height entry was not a mistake.
1.5.3 Ethical clearance
Ethical approval for the 2019 survey was obtained from the Health and Care Research Ethics Committee for Wales (REC reference number: 17/WA/0371).
1.6 Survey Response
1.6.1 Introduction
This section presents the fieldwork outcomes for the sampled addresses. Survey response is an important indicator of survey quality as non-response can introduce bias into survey estimates. Standardised outcome codes (based on an updated version of those published in Lynn et al, 2001[15]) for survey fieldwork were applied across the SHeS, SHS and SCJS. This enables consistent reporting of fieldwork performance and effective comparison of performance between the surveys.
1.6.2 Household response
Table 1.1 shows a detailed breakdown of the SHeS response for all sampled addresses in 2019. Addresses with unknown eligibility have been allocated as eligible and ineligible proportional to the levels of eligibility for the remainder of the sample. This approach provides a conservative estimate of the response rate as it estimates a high proportion of eligible cases amongst addresses with unknown eligibility.
At each selected household in the main sample, all adults and a maximum of two children were eligible for interview. When considering the household response rate, households classed as “responding” were those where at least one eligible person was interviewed. The table shows that for the combined main and Health Board boost sample, 55.6% of eligible households were classed as responding, and with all individual interviews complete at 44.5% of households.
For the child boost sample 75.5% of households were ineligible as they did not contain any children under the age of 16. For eligible households 67.4% were classed as responding, with all individual interviews complete at 66.9% of households.
Table 1.2 shows that across Heath Boards, the percentage of households where at least one eligible person was interviewed ranged from 50% (Greater Glasgow and Clyde) to 66% (Borders and Shetland Islands). Fully cooperating households were those where all eligible individuals were interviewed, all height and weight measured and, if eligible, completed the biological module. This varied between 30% in Lanarkshire to 46% in Grampian. The definition of a fully cooperating household changed in 2012 and is therefore not comparable with fully cooperating figures prior to this.
Table 1.2b shows that across Local Authorities, the percentage of households where at least one eligible person was interviewed ranged from 43% (West Dunbartonshire) to 68% (Clackmannanshire). Fully cooperating households varied between 27% (Perth and Kinross and Dunbartonshire) and 50% (Aberdeen City).
Table 1.3 shows the household response rate for eligible addresses in the child boost sample by NHS board. This varied from 54% (Borders and Tayside) to 81% (Grampian and Dumfries and Galloway). Note that some of the bases for child boost response rates were low (for example 22 eligible households in the Dumfries & Galloway).
Table 1.3b shows the household response rate for eligible addresses in the child boost sample by Local Authority. This varied from 42% (Angus) to 100% (South Ayrshire). Note that the bases for child boost response rates were particularly low in a number of areas (for example 12 eligible households in Angus, Moray and South Ayrshire). Tables 1.1-1.3b
1.6.3 Individual response for adults
Overall there were 4,903 adult responses to SHeS 2019 with 1,281 responses to the biological module, detailed in Table 1.4.
In order to calculate the adult response rate, since all adults in households were eligible for interview, the number of adults in non-responding households had to be estimated to calculate the total number of adults in all households. This was undertaken by calculating the average number of men and women per household for responding households and non-responding households (where information on the composition is known) and applying this to the households where nothing is known. The total estimated number of adults from sampled addresses eligible for interview is referred to as the “set” sample. For 2019, the set sample for men was 4,698 and for women was 5,324.
Table 1.4 shows the adult response rate broken down by gender. The adult response rate was 46% for men, 52% for women and 49% overall. In responding households (those households where at least one interview was completed) additional information on respondents allowed the consideration of response to stages of the survey by gender and age group. This is shown in Tables 1.5 and 1.6. For both men and women, the younger age groups were found to have a lower response rate (60% for men aged 16 to 24 and 69% for women aged 16 to 24) than older age groups (92% or higher response rate for men over 65 and 96% or higher for women over 65).
As part of the biological module, respondents were asked to have their waist and blood pressure measured and to provide a saliva sample. Almost all individuals completing the biological module interview allowed the waist and blood pressure measurements to be taken and provided a saliva sample. Of those eligible for the biological module (including non-responders to the main interview in participating households), 36% of men participated in the module (34% provided waist measurements, 34% blood pressure measurements and 33% a saliva sample), as did 42% of women (39% with waist measurements, 39% blood pressure and 38% saliva) (Table 1.4).
Table 1.9 shows that men are under-represented in the SHeS sample compared to NRS population estimates as they made up 44% of the sample but 48% of the population. Younger age groups were also under-represented in the SHeS sample when compared to NRS population estimates. In particular, men and women under 35 were under-represented. Conversely, men and women over 55 were over-represented in the sample. Tables 1.4-1.6, Table 1.9
1.6.4 Individual response for children (0-15)
Interviews were undertaken with 1,978 children aged 0 to 15, with 942 interviews taking place as part of the main sample and 1,036 as part of the child boost.
As was the case with the adult sample, in order to calculate the response rate for children, the number of eligible children in selected households (the “set” sample) had to be estimated. This was done by assuming that, for both the main sample and the child boost sample, the non-responding and responding households contained the same average number of children.
Table 1.7 shows that overall response rates for the main sample and child boost sample were similar for boys and girls (50% and 52% respectively in the main sample, and 68% and 66% respectively for the child boost sample).
Child response rates have also been calculated for children in responding households. Table 1.8 shows that response rates were highest among children aged under 11 years (95-99% for boys and 98-100% for girls), however, the response rate for children aged 11 to 15 was slightly lower at 90% for boys and 91% for girls. Tables 1.7-1.8
1.7 Weighting The Data
1.7.1 Introduction
This section presents information on the weighting procedures applied to the survey data. Since 2012 the weighting for SHeS has been undertaken by the Scottish Government rather than the survey contractor (as had previously been the case), but the methodology applied was largely consistent with that of the 2008 to 2011 sweeps of the survey. The procedures for the implementation of the weighting methodology were developed by the Scottish Government working with the Methodology Advisory Service at the Office for National Statistics[16].
To undertake the calibration weighting the ReGenesees Package for R was used and within this to execute the calibration a raking function was implemented.
1.7.2 Main adult weights
The main adult weight is applicable for all adults interviewed as part of the main sample and the Health Board boosts. There were six steps to calculating the overall adult weights. These were as follows:
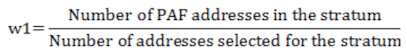
1) Address selection weights (w1)
The address selection weights were calculated to compensate for unequal probabilities of selection of addresses in different survey strata. For the main sample with the Health Board boost there were 36 strata overall (one for each local authority, an extra stratum for the Lanarkshires and two extra strata in Fife as a result of the boost). The address selection weight for each stratum was calculated as:
2) Dwelling unit selection weights (w2)
As stated in Section 1.2.7, the MOI for the PAF was used to ensure that if there were multiple dwelling units at a single address point then they would have the same selection probability as individual addresses. However, there were some cases where the MOI was incorrect. The following correction was applied where this was the case:
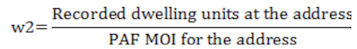
With w2 trimmed to a maximum of 3.
3) Household selection weights (w3)
Similarly, within a very small number of dwelling units, fieldworkers found multiple households, of which only one was selected for participation in the SHeS. The following correction was applied for multiple households:

With w3 trimmed to a maximum of 3.
4) Calibrated household weights (w4)
The three selection weights were combined (w1*w2*w3) before the household calibration stage. This combined weight was applied to the survey data to act as entry weights for the calibration. The execution of the calibration step then modified the entry weights so that the weighted total of all members of responding households matched the population totals for Health Boards, Scotland-level population totals for age/sex breakdown, and the population within SIMD15 areas. The population totals that were used were the National Records of Scotland’s (NRS) mid-2018 estimates for private households.
5) Adult non-response weights (w5)
All adults within selected households were eligible for interview, but within responding households not all individuals completed an interview. The profiles of household members that did not complete the interview were different from those that did. Information on all individuals within responding households was available through information gathered as part of the household interview. This allowed the differential response rates for individuals within households to be modelled using logistic regression to calculate a probability of responding based on their profiles. The logistic regression was only applicable for households containing more than one adult since households consisting of only one adult either responded to the household and individual interviews or did not respond at all.
The following variables were considered for inclusion in the model:
- Health Board
- Age/sex
- Number of adults in the household
- Employment status of household reference person
- Presence of a smoker in the household
- Marital status
- Tenure
- Urban/rural classification
- Access to a car
- Located within SIMD15 area
- Frequency of eating meals together
Through running backwards and forwards selection procedures for the logistic regression the following variables were included in the final model:
- Health Board
- Age/sex
- Number of adults in the household
- Located within SIMD15 area
- Marital status
- Access to a car
- Frequency of eating meals together
- Urban/rural classification
The final logistic regression model was then used to calculate the probability of response for all individuals that did respond. The adult non-response weight (w5) was then calculated as the reciprocal of this probability:
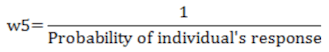
For households of only one adult the non-response weight was one.
6) Individual calibration and final adult weight (int18wt)
The household (w4) and non-response (w5) were combined (w4*w5) and applied to the survey data prior to the final stage of calibration weighting which matched weighted totals for the survey data to the NRS 2018 mid-year population estimates for Health Boards, age/sex distribution at Scotland level and age/sex distribution for the Glasgow and Greater Clyde Health Board.
| Health Board | Adults | Children | Total |
|---|---|---|---|
| Ayrshire & Arran | 304,304 | 61,399 | 365,703 |
| Borders | 95,143 | 18,994 | 114,137 |
| Dumfries & Galloway | 123,603 | 23,359 | 146,962 |
| Fife | 299,690 | 64,327 | 364,017 |
| Forth Valley | 246,835 | 52,443 | 299,278 |
| Grampian | 471,887 | 99,721 | 571,608 |
| Greater Glasgow & Clyde | 954,011 | 196,671 | 1,150,682 |
| Highland | 262,603 | 52,027 | 314,630 |
| Lanarkshire | 535,640 | 118,131 | 653,771 |
| Lothian | 727,282 | 150,252 | 877,534 |
| Orkney | 18,456 | 3,499 | 21,955 |
| Shetland | 18,670 | 4,159 | 22,829 |
| Tayside | 337,741 | 67,260 | 405,001 |
| Western Isles | 22,161 | 4,317 | 26,478 |
| Total | 4,418,026 | 916,559 | 5,334,585 |
Total figures might not be exact due to rounding
| SIMD15 | Total population |
|---|---|
| 15% most deprived data zones | 778,005 |
| All other data zones | 4,556,580 |
| Total | 5,334,585 |
Total figures might not be exact due to rounding
| Age group | Male | Female | Total |
|---|---|---|---|
| 0-4 | 142,039 | 133,936 | 275,975 |
| 5-9 | 153,263 | 146,862 | 300,125 |
| 10-15 | 174,050 | 166,409 | 340,459 |
| 16-24 | 276,165 | 266,233 | 542,398 |
| 25-34 | 358,544 | 370,751 | 729,295 |
| 35-44 | 321,490 | 337,731 | 659,221 |
| 45-54 | 373,345 | 401,051 | 774,396 |
| 55-64 | 348,977 | 370,116 | 719,093 |
| 65-74 | 270,877 | 295,852 | 566,729 |
| 75+ | 178,876 | 248,018 | 426,894 |
| Total | 2,597,626 | 2,736,959 | 5,334,585 |
1.7.3 Biological module weights
A similar process was applied to derive the weights for the biological module. This is outlined below.
1) Address selection weight (bw1)
New address selection weights were calculated using the same process as described for w1 but with the Health Board boost addresses excluded.
2) Dwelling unit (w2) and household selection weights (w3)
The dwelling unit and household selection weights from the main adult weight were applied as above.
3) Calibrated household weight (bw4)
The three selection weights were combined (bw1*w2*w3) and applied to the survey data before the household calibration was run so that survey data matched the population totals for Health Boards, Scotland-level age/sex breakdown, and the population within SIMD15 areas.
4) Adjustment for biological module selection (bw5)
33% of the main sample was allocated to the biological module. To incorporate this probability of selection a correction was applied to the calibrated household weight (bw4). The correction was:

5) Application of adult non-response (w5)
For within household non-response, the non-response weight (w5) calculated for all households was also applicable for the biological module.
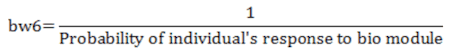
6) Non-response weight for biological module interview
Not all the adults that responded to the main section of the interview responded to the biological module. Using the information collected for the respondent in the main interview and household interview the likelihood of responding to the biological module was modelled with logistic regression.
The following variables were considered for inclusion in the model:
- Health Board
- Age/sex
- Number of adults in the household
- Employment status of household reference person
- Presence of a smoker in the household
- Frequency of eating meals together
- Self-assessed general health
- Gardening/DIY/building work in past 4 weeks
- Any physical activity in past 4 weeks
- Any housework in past 4 weeks
- Economic activity (working/retired/sick)
- Marital status
- Tenure
- Urban/rural classification
- Access to a car
- Located within SIMD15 area
- Long-term illness or disability
- Highest qualification held
- Ever had high blood pressure
- Current smoker
- Currently drink alcohol
- Number of natural teeth
Through running backwards and forwards selection procedures for the logistic regression the following variables were included in the final model for response to the biological module:
- Health Board
- Age/sex
- Number of adults in the household
- Located within SIMD15 area
- Any housework in past 4 weeks
- Current smoker
- Economic activity (working/retired/sick)
- Employment status of Household reference person
The final logistic regression model was then used to estimate the probability of response for all individuals that did respond to the biological module. The biological module non-response weight (bw6) was then calculated as the reciprocal of this probability:
7) Final calibration for biological module (bio18_wt)
The household (bw4), biological sample correction (bw5), adult non-response (w5), and biological non-response (bw6) weights were combined (bw4*bw5*w5*bw6) and applied to the survey data.
For the final stage of biological module weighting the weighted totals for the survey data were calibrated to match the NRS 2018 mid-year population estimates for private households for Health Boards, age/sex distribution at Scotland level. However, due to the low sample size for the module a number of the categories had to be collapsed. In terms of Health Boards, all areas except for Grampian, Greater Glasgow and Clyde, Highland, and Lanarkshire were grouped together. For the age groups, the lowest two age groups were combined as were the highest two age groups.
1.7.4 Non-biological module weights (Version A)
A weight titled “Version A” was calculated for the individual respondents in the main sample that were not selected for the biological module. This consisted of the main sample without the Health Board boost sample. The following steps were followed to derive the weight:
1) Address selection weight (bw1)
As derived in the first step of the biological module weight.
2) Dwelling unit (w2) and household selection weights (w3)
The dwelling unit and household selection weights from the main adult weight were applied as above.
3) Calibrated household weight (bw4)
As derived for the biological module.
4) Adult non-response weight (w5)
For within household non-response, the non-response weight (w5) calculated for all households was also applicable for the biological module.
5) Final calibration for Version A weight (verA1618wt)
The household (bw4) and adult non-response (w5) weights were combined (bw4*w5) and applied to the survey data. As was the case with the main adult weight and biological module weight, the weighted totals for the survey data were calibrated to match the NRS 2018 mid-year population estimates for private households for Health Boards, age/sex distribution at Scotland level.
1.7.5 Overall child weights
An overall child weight was derived for child responses from the main sample and from the child boost combined. Separate logistic regression non-response weights were not required for the child samples as the response rate for children within cooperating households was sufficiently high. The weighting steps are shown below. Steps (1) and (2) followed the same process as described in 1.7.2 above.
1) Address selection weight for main sample and child boost combined (cw1)
2) Dwelling unit (cw2) and household (cw3) selection weights
3) Selection of children within each household (cw4)
A maximum of two children were eligible for interview in each household. To ensure that children in larger households were not under-represented in the final sample the following child selection weight was calculated for households with more than two children to compensate for the probability of selection:
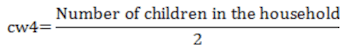
For households with two or fewer children cw4=1.
4) Calibration for child interview weight (cint18wt)
The address selection (cw1), dwelling unit (cw2), household (cw3) and child selection weights (cw4) were combined (cw1*cw2*cw3*cw4) and applied to the survey data. The weighted totals for the survey data were calibrated to match the NRS 2018 mid-year population estimates for private households for Health Boards, age/sex distribution at Scotland level.
Weights were also created specifically for within household analysis, comparing children’s characteristics with those of their parents. As data were only collected with respect to both children and adults in the core sample, these weights were only created for children at core sample addresses. They were created in a similar fashion to that described for the whole of the overall child weights.
1.7.6 Combined weights
A number of different combinations of annual sweeps have been produced to allow the analysis of combined datasets.
The weights provided for combined years of data are:
- int16171819wt
For analysis of 2016, 2017, 2018 and 2019 combined adult data - cint16171819wt
For analysis of 2016, 2017, 2018 and 2019 combined child data - cmint16171819wt
For analysis of 2016, 2017, 2018 and 2019 combined child data core sample only (for within household analysis) - bio16171819wt
For analysis of 2016, 2017, 2018 and 2019 combined biological data (not urine) - int1819wt
For analysis of 2018 and 2019 combined adult data - int1719wt
For analysis of 2017 and 2019 combined adult data - cint1819wt
For analysis of 2018 and 2019 combined child data - cint1719wt
For analysis of 2017 and 2019 combined child data - cmint1719wt
For analysis of 2017 and 2019 combined child data core sample only (for within household analysis) - bio1819wt
For analysis of 2018 and 2019 combined biological data (not urine) - vera1719wt
For analysis of 2017 and 2019 combined version A adult module data - cvera1719wt
For analysis of 2017 and 2019 combined version A child module data
In each case, the calculation of the weights followed the same procedure. The pre-calibration weights which had already been calculated for the individual years (which take into account selection weighting and (except for the child weights) non-response weighting) were combined and calibrated to Health Board and age/sex 2018 population totals for private households.
1.8 data analysis and Reporting
SHeS is a cross-sectional survey of the population. It examines associations between health status, personal characteristics and behaviour. However, such associations do not necessarily imply causality. In particular, associations between current health status and current behaviour need careful interpretation, as current health may reflect past, rather than present, behaviour. Similarly, current behaviour may be influenced by advice or treatment for particular health conditions.
1.8.1 Reporting age variables
Defining age for data collection
A considerable part of the data collected in SHeS 2019 is age specific, with different questions directed to different age groups. During the interview the participant’s date of birth was ascertained. For data collection purposes, a participant’s age was defined as their age on their last birthday before the interview.
Age as an analysis variable
Age is a continuous variable, and an exact age variable on the data file expresses it as such (so that, for example, someone whose 24th birthday was on January 1, 2019 and was interviewed on October 1, 2019 would be classified as being aged 24.75).
The presentation of tabular data involves classifying the sample into year bands. This can be done in two ways, age at last birthday and ‘rounded age’, that is, rounded to the nearest integer. In this report, all references to age are age at last birthday.
Age standardisation
Some of the adult data included in the 2019 report have been age-standardised to allow comparisons between groups after adjusting for the effects of any differences in their age distributions. If data reported have been age-standardised this is highlighted in the title to the table or chart. When different sub-groups are compared in respect of a variable on which age has an important influence, any differences in age distributions between these sub-groups are likely to affect the observed differences in the proportions of interest.
It should be noted that all analyses in the report are presented separately for men and women and on most occasions data for all adults are also presented. All age standardisation has been undertaken separately within each sex, expressing male data to the overall male population and female data to the overall female population. When comparing data for the two sexes, it should be remembered that no age standardisation has been introduced to remove the effects of the sexes’ different age distributions.
Age standardisation was carried out using the direct standardisation method. The standard population to which the age distribution of sub-groups was adjusted was the mid-year 2018 household population estimates for Scotland. The age-standardised proportion p′ was calculated as follows, where pi is the age specific proportion in age group i and Ni is the standard population size in age group i:
Therefore p′ can be viewed as a weighted mean of pi using the weights Ni. Age standardisation was carried out using the age groups: 16-24, 25-34, 35-44, 45-54, 55-64, 65-74 and 75 and over. The variance of the standardised proportion can be estimated by:
where qi = 1 - pi
1.8.2 Standard analysis breakdowns
Scottish Index of Multiple Deprivation (SIMD)
The analysis of 2019 data was based on the most recent version of the Scottish Index of Multiple Deprivation (SIMD), published in 2020[17]. It is based on 38 indicators in seven individual domains of current income, employment, housing, health, education, skills and training, geographic access to services and crime. SIMD is calculated at data zone level, enabling small pockets of deprivation to be identified. The data zones are ranked from most deprived (1) to least deprived (6,976) on the overall SIMD index. The result is a comprehensive picture of relative area deprivation across Scotland. The index was divided into quintiles for the presentation of analysis within this report. The full index is not available on the archived dataset due to concerns about its potential for identifying individual respondents or households.
1.8.3 Design effects and true standard errors
SHeS 2019 used a clustered, stratified multi-stage sample design. In addition, weights were applied when obtaining survey estimates. One of the effects of using the complex design and weighting is that standard errors for survey estimates are generally higher than the standard errors that would be derived from an unweighted simple random sample of the same size. The calculations of standard errors shown in tables, and comments on statistical significance throughout the report, have taken the clustering, stratification and weighting into account. The ratio of the standard error of the complex sample to that of a simple random sample of the same size is known as the design factor. Put another way, the design factor (or ‘deft’) is the factor by which the standard error of an estimate from a simple random sample has to be multiplied to give the true standard error of the complex design. The true standard errors and defts for SHeS 2019 have been calculated using a Taylor Series expansion method. The deft values and true standard errors (which are themselves estimates subject to random sampling error) are shown in Tables 1.10 to 1.17 for selected survey estimates presented in the main report. Tables 1.10 - 1.17
References and notes
1 The 1995 and 1998 surveys were carried out by the Joint Health Surveys Unit of the National Centre for Social Research (NatCen Social Research) and the Department of Epidemiology and Public Health University College London Medical School (UCL). The MRC Social and Public Health Sciences Unit at the University of Glasgow (MRC SPHSU) joined the consortium in 2003. ScotCen Social Research (a branch of NatCen Social Research), UCL and MRC SPHSU conducted the 2008-2011 surveys after a decision was made to carry out the survey annually.
2 Information Services Division (2020). Scottish Heart Disease Statistics. Available from: https://beta.isdscotland.org/find-publications-and-data/conditions-and-diseases/heart-disease-and-blood-vessels/heart-disease-statistics/
3 See: https://www2.gov.scot/Topics/Statistics/About/Surveys/SSCQ/SSCQ2014
4 Corbett, J., Davidson, M., Dowling, S., Hinchliffe S. and Rutherford, L. (2013). Chapter 1: Methodology and response. In Rutherford, L., Hinchliffe, S. and Sharp, C. (eds.) Scottish Health Survey 2012 – Volume 2: Technical Report. Edinburgh: Scottish Government. https://www.gov.scot/publications/scottish-health-survey-2012-volume-2-technical-report/
5 Scottish Health Survey Questionnaire Review Report 2012-2015. Available from https://www2.gov.scot/Topics/Statistics/Browse/Health/scottish-health-survey/questionnairereviewreport
6 Scottish Surveys Core Questions 2018-2021 Questionnaire Review: Consultation Outcome Report (2017). Available from https://www.gov.scot/publications/scottish-surveys-core-questions-2017/
7 Questionnaire Content of the Scottish Health Survey (2017): Consultation Analysis Report. Available from https://www.gov.scot/publications/questionnaire-content-scottish-health-survey-consultation-analysis-report-april-2017/
8 Scottish Health Survey: Report of Questionnaire Changes from 2018. Available from: https://www.gov.scot/publications/scottish-health-survey-report-questionnaire-changes-2018/.
9 Dean, L and McLean, J (eds). The Scottish Health Survey 2018 edition: Volume 2: technical report. Edinburgh: Scottish Government Available from: https://www.gov.scot/publications/scottish-health-survey-2018-volume-2-technical-report/
10 Further information on the sample designs and the methodology used is available here: https://www2.gov.scot/Topics/Statistics/About/SurveyDesigns201215.
11 Further information on the 2011 Scottish Health Survey questionnaire review for the 2012-2015 surveys can be found on the Scottish Government SHeS website: https://www2.gov.scot/Topics/Statistics/Browse/Health/scottish-health-survey/questionnairereviewreport
12 Questionnaire Content of the Scottish Health Survey (2017): Consultation Analysis Report. Available from https://consult.gov.scot/population-health/scottish-health-survey/
13 Further information on the 2017 Scottish Health Survey questionnaire review for the 2018-2021 survey can be found on the Scottish Government website: http://www.gov.scot/Resource/0053/00537370.pdf
14 The household reference person (HRP) is defined as the householder (a person in whose name the property is owned or rented) with the highest income. If there is more than one householder and they have equal income, then the household reference person is the eldest.
15 Lynn, Peter, Beerten, Roeland, Laiho, Johanna and Martin, Jean ‘Recommended Standard Final Outcome Categories and Standard Definitions of Response Rate for Social Surveys’, Working Papers of the Institute for Social and Economic Research, paper 2001-23. Colchester: University of Essex. 2001.
16 A report on the development of the weighting procedures is available here: https://www2.gov.scot/Topics/Statistics/About/Surveys/WeightingProjectReport
17 Where time series SIMD data are presented, the appropriate version of the SIMD is used for each year. More details are provided within the main report and at https://www.gov.scot/publications/?term=SIMD&cat=filter&publicationTypes=statistics&page=1
Chapter 1: Table list
Table 1.1 Detailed fieldwork outcomes
Table 1.2 Main sample household response, by Health Board
Table 1.2b Main Sample household response, by Local Authority
Table 1.3 Child boost sample household response, by Health Board
Table 1.3b Child boost sample household response, by Local Authority
Table 1.4 Summary of adults' individual response to the survey, by sex
Table 1.5 Men in responding households, response to the stages of the survey, by age
Table 1.6 Women in responding households, response to the stages of the survey, by age
Table 1.7 Summary of children's individual response to the survey, by sample type and sex
Table 1.8 Children in responding households, response to the stages of the survey by age and sex
Table 1.9 Age distribution of responding adult sample compared with 2018 midyear population estimates for Scotland, by sex
Table 1.10a True standard errors and 95% confidence intervals for general health variables
Table 1.10b True standard errors and 95% confidence intervals for cardiovascular conditions and diabetes variables
Table 1.10c True standard errors and 95% confidence intervals for CPR training variables
Table 1.11a True standard errors and 95% confidence intervals for mental wellbeing variables
Table 1.11b True standard errors and 95% confidence intervals for mental wellbeing variables
Table 1.12 True standard errors and 95% confidence intervals for dental health variables
Table 1.13 True standard errors and 95% confidence intervals for alcohol variables
Table 1.14 True standard errors and 95% confidence intervals for smoking variables
Table 1.15a True standard errors and 95% confidence intervals for diet variables
Table 1.15b True standard errors and 95% confidence intervals for obesity variables
Table 1.15c True standard errors and 95% confidence intervals for food insecurity variables
Table 1.16a True standard errors and 95% confidence intervals for physical activity variables
Table 1.16b True standard errors and 95% confidence intervals for child physical activity variables
Table 1.17 True standard errors and 95% confidence intervals for Adverse Childhood Experiences variables
The tables can be found on the technical report page under supporting files: https://www.gov.scot/publications/scottish-health-survey-2019-volume-2-technical-report/.
Contact
There is a problem
Thanks for your feedback