Planning performance statistics 2019/2020: annual
Summary statistics on planning decision-making and timescales for April 2019 to March 2020 with historic data going back to 2012/13. It is based on data collected by the Scottish Government from Local and Planning Authorities as part of the Planning Performance Framework (introduced in 2012).
This document is part of a collection
5. Applications by Development Type
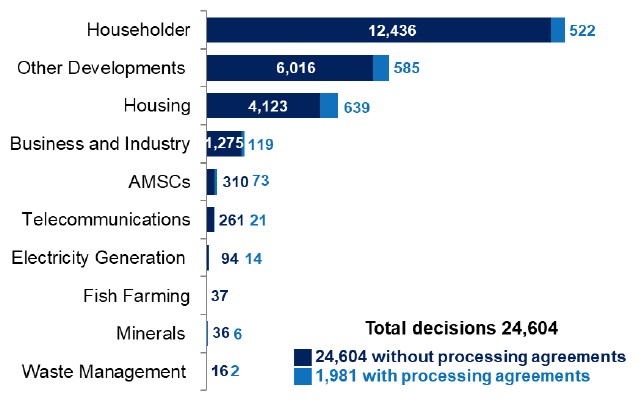
5.1. Local Developments
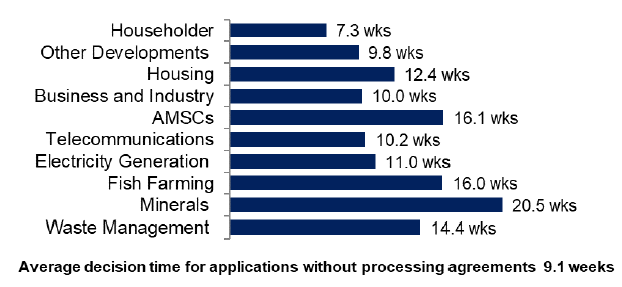
The average decision time for 24,604 local applications not subject to processing agreements in 2019/20 was 9.1 weeks. The number of decisions and average decision times vary between types of development (Table 1). In addition, there were 1,981 local developments decided in 2019/20 that had processing agreements in place.
Almost half (48.7%) of all local applications were from householders, and these had the shortest average decision time (7.3 weeks). Mineral applications (0.2% of all local decisions) had the longest average decision time (20.5 weeks).
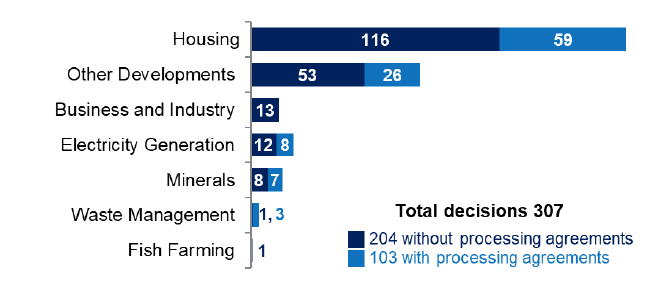
5.2. Major Developments
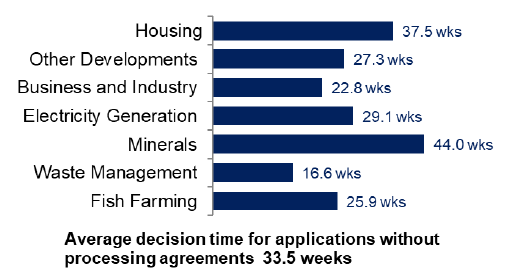
The average decision time for 204 (post 3rd August 2009) major applications not subject to processing agreements in 2019/20 was 33.5 weeks. The number of decisions and average decision times vary between types of development
(Table 2).
In addition, there were 103 major developments decided in 2019/20 that had processing agreements in place.
More than half (57%) of major developments are for housing developments, these had an average decision time of 37.5 weeks.
The shortest average decision time of 16.6 weeks is for Waste Management developments (1% of all major developments), the longest average decision time was for Mineral applications (44.0 weeks, 5% of all major developments).
| Post-3rd August Local Developments | 2019/20 | 2018/19 | 2017/18 | 2016/17 | 2015/16 | |||||
|---|---|---|---|---|---|---|---|---|---|---|
| Number of decisions | Average decision time (weeks) | Number of decisions | Average decision time (weeks) | Number of decisions | Average decision time (weeks) | Number of decisions | Average decision time (weeks) | Number of decisions | Average decision time (weeks) | |
| Householder | 12,436 | 7.3 | 12,482 | 7.2 | 12,861 | 2 | 13,400 | 7.3 | 13,641 | 7.4 |
| Other Developments | 6,016 | 9.8 | 5,859 | 9.6 | 5,981 | 9.9 | 5,919 | 10.0 | 6,126 | 10.3 |
| Housing | 4,123 | 12.4 | 4,648 | 12.3 | 4,768 | 12.2 | 4,899 | 12.7 | 5,590 | 13.7 |
| Business & Industry | 1,275 | 10.0 | 1,478 | 9.1 | 1,609 | 9.5 | 1,738 | 9.3 | 1,941 | 10.4 |
| Telecommunications | 261 | 10.2 | 230 | 8.8 | 504 | 8.7 | 457 | 8.1 | 441 | 7.9 |
| AMSCs | 310 | 16.1 | 289 | 13.8 | 284 | 13.9 | 294 | 14.5 | 319 | 13.0 |
| Electricity Generation | 94 | 11.0 | 180 | 14.5 | 123 | 13.3 | 178 | 19.2 | 561 | 17.4 |
| Fish Farming | 37 | 16.0 | 33 | 15.2 | 56 | 9.3 | 44 | 8.5 | 84 | 9.4 |
| Minerals | 36 | 20.5 | 26 | 17.4 | 17 | 27.1 | 28 | 19.9 | 39 | 35.0 |
| Waste Management | 16 | 14.4 | 20 | 9.4 | 17 | 16.6 | 29 | 11.6 | 22 | 10.8 |
| Total | 24,604 | 9.1 | 25,245 | 9.0 | 26,220 | 9.0 | 26,986 | 9.2 | 28,764 | 9.7 |
| Post-3rd August Major Developments | 2019/20 | 2018/19 | 2017/18 | 2016/17 | 2015/16 | |||||
|---|---|---|---|---|---|---|---|---|---|---|
| Number of decisions | Average decision time (weeks) | Number of decisions | Average decision time (weeks) | Number of decisions | Average decision time (weeks) | Number of decisions | Average decision time (weeks) | Number of decisions | Average decision time (weeks) | |
| Housing | 116 | 37.5 | 98 | 35.1 | 116 | 38.2 | 108 | 43.4 | 95 | 40.6 |
| Other Developments | 53 | 27.3 | 64 | 31.1 | 83 | 30.6 | 94 | 30.4 | 108 | 25.1 |
| Business & Industry | 13 | 22.8 | 21 | 24.6 | 17 | 25.5 | 26 | 33.2 | 23 | 19.9 |
| Electricity Generation | 12 | 29.1 | 9 | 25.6 | 9 | 36.5 | 10 | 32.6 | 16 | 31.7 |
| Minerals | 8 | 44.0 | 10 | 41.9 | 8 | 23.9 | 5 | 30.0 | 16 | 33.6 |
| Waste Management | 1 | 16.6 | 3 | 27.4 | 5 | 14.0 | 3 | 18.6 | 9 | 22.4 |
| Fish Farming | 1 | 25.9 | 1 | 36.9 | 0 | - | 0 | - | 1 | 18.0 |
| Total | 204 | 33.5 | 206 | 32.6 | 238 | 33.6 | 246 | 36.4 | 268 | 31.0 |
1. Figures do not include applications subject to processing agreements.
2. The analysis in Sections 2 to 5 covers applications validated in the current planning system, post 3rd August 2009. Legacy cases validated before 3rd August 2009 are not included in the figures but are reported separately in Section 11. Figures for all applications including legacy cases were reported up to and including 2016/17 and are available in previous publications.
3. Figures for 2012/13 and 2013/14 are available in previous publications.
Contact
Email: planstats@gov.scot
There is a problem
Thanks for your feedback