3% increase in housing supply
A National Statistics Publication for Scotland.
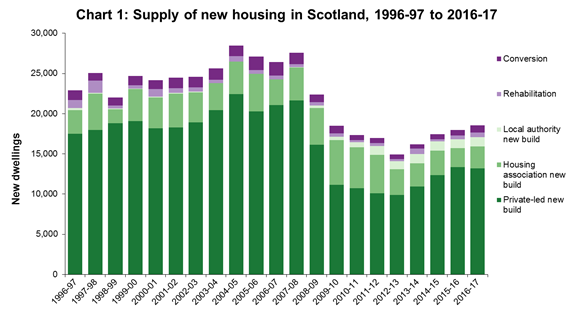
Total new housing supply in Scotland increased by 3% in 2016-17, to 18,539 new housing units, or 571 more homes than the previous year.
Two sets of housing statistics have been released today by Scotland’s Chief Statistician. The Annual Housing Statistics update includes information on total housing supply, local authority house sales, lettings and evictions, stock and vacancy rates, supported housing, housing lists, scheme of assistance and houses in multiple occupation. The Quarterly Housing Statistics update includes information on new house building, affordable housing supply and right to buy applications and sales.
Key findings from the Annual Housing statistics update:
- New housing supply: New housing supply (new build, refurbishment and conversions) increased by 3% between 2015-16 and 2016-17, from 17,968 to 18,539 new homes.
Housing supply figures include private-led and social sector new builds, as well as conversions and rehabilitations. Housing association new builds increased by 428 homes (18%), local authority new builds increased by 5 homes (0%), and private-led new builds decreased by 182 homes (1%), whilst rehabilitations increased by 142 homes (31%) and conversions increased by 178 homes (26%).
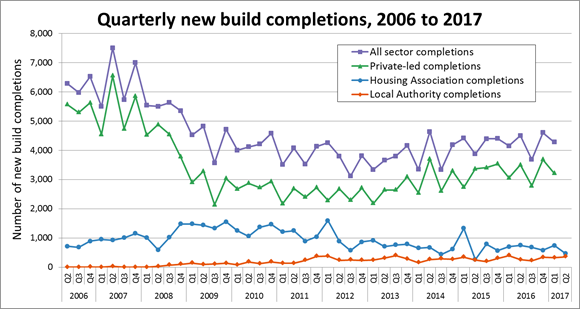
- New house building: In 2016-17, 17,078 new homes were completed in Scotland, an increase of 1% on the 16,827 completions in the previous year, the fourth consecutive annual increase and the highest annual number of completions since 2009-10. Between 2015-16 and 2016-17, the number of homes started rose by 4% from 17,765 to 18,391, the fourth consecutive annual increase and the highest annual number of starts since 2008-09.
- Local authority housing stock: At 31st March 2017, there were 314,816 local authority dwellings in Scotland, a decrease of 1,737 units (1%) from the previous year.
- Right to Buy: Sales of public authority dwellings (including local authorities with total stock transfers) rose by 68% in 2016-17 to 3,510. This is the fourth consecutive annual increase after years of declining numbers of sales. The increases are likely to be due to the announcement in 2013 that right to buy was to be ended for all tenants, following which the scheme closed to all new applicants in July 2016.
- Vacant stock: At 31st March 2016, local authorities reported 6,164 units of vacant stock, of which 38% consisted of normal letting stock. This represents 1% of all normal letting stock, and is down from 6,181 the previous year.
- Lettings: During 2016-17 there were 25,788 permanent lettings made, a decrease of 2% compared to 26,258 lettings in the previous year. Lets to homeless households represented 40% of all lets made by local authorities in 2016-17, a total of 10,436 lettings to homeless households, which is an increase of 5% on the 9,913 lettings in 2015-16.
- Evictions: Eviction actions against local authority tenants resulted in 1,421 evictions or abandoned dwellings in 2016-17 (927 evictions, 494 abandoned dwellings). This is up by 9%, or 121 actions of evictions or abandonments, on the 1,300 in 2015-16.
- Housing Lists: Household applications held on local authority or common housing register lists decreased by 3% or 4,970 households to 162,152 at March 2017, the ninth consecutive annual decrease.
- Scheme of assistance: There were 10,483 scheme of assistance grants paid to householders in 2016-17, 270 (3%) fewer than in 2015-16. Spend on scheme of assistance grants totaled £31.8 million, which is similar to 2015-16. The majority of grants in 2016-17 were for disabled adaptions, 5,967 grants amounting to £22.8 million.
- Houses in multiple occupation: In 2015-16, 9,668 applications were received in respect of the mandatory licensing scheme for houses in multiple occupation. At 31st March 2017 there were 15,289 licences in force, representing a decrease of 2% over the previous year.
Key findings from the Quarterly Housing statistics update:
- A total of 3,212 private sector homes were completed between January and March 2017, 5% (156 homes) more than in the same quarter in 2016. This brings the financial year total to 13,187, 1% down on 2015-16.
- Meanwhile 2,575 private sector homes were started between January and March 2017, 8% (223 homes) less than in the same quarter in 2016. This brings the total for 2016-17 to 12,051, 9% less than in 2015-16.
- In the social sector (local authorities and housing associations), 819 social sector homes were completed between April and June 2017 bringing the total for the year to end June 2017 to 3,708, 6% less than in the year to end June 2016.
- During the same period, 588 homes were started between April and June 2017 bringing the total for the year to end June 2017 to 6,234, 32% more than in the year to end June 2016.
Figures on the Affordable Housing Supply Programme are also available on a quarterly basis.
- A total of 1,592 affordable homes were completed in the quarter between April and June 2017, a 6% decrease, or 105 fewer homes, than the same quarter last year. This brings the total for the year to end June 2017 to 7,231, up 3% on the 7,021 completions in the previous year.
- Between April and June 2017 a total of 1,456 affordable homes were approved. This is 336 (30%) more than in the same quarter in the previous year. It brings the total for the year to end June 2017 to 10,612 approvals, up 30% on the previous year.
- There were 2,076 affordable homes started in the quarter between April and June 2017, a 14% increase, or 262 more homes than the same quarter last year. This brings the total for the year to end June 2017 to 9,570, up 17% on the 8,178 starts in the previous year.
Background
The statistical bulletins and web tables associated with this publication can be found as follows:
Housing Statistics for Scotland 2017: Annual Key Trends Summary:
http://www.gov.scot/stats/bulletins/01289
Housing Statistics for Scotland Quarterly Update (published 12 September 2017):
http://www.gov.scot/stats/bulletins/01288
Associated web tables:
http://www.scotland.gov.uk/Topics/Statistics/Browse/Housing-Regeneration/HSfS
The statistical bulletins and web tables present information on new house building, public sector house sales, and local authority lettings and evictions, stock and vacancy rates, supported housing, housing lists, scheme of assistance and houses in multiple occupation.
These statistics are used for a variety of purposes including for monitoring the National Performance Framework Indicator on increasing the number of new homes in Scotland.
The new build, affordable housing supply, and sales web tables are updated each quarter. An explanatory document providing background information on these statistics is also available. The remaining statistics are updated each year, usually in September.
Official statistics are produced by professionally independent statistical staff – more information on the standards of official statistics in Scotland can be accessed at: http://www.scotland.gov.uk/Topics/Statistics/About
There is a problem
Thanks for your feedback