Scottish Local Government Finance Statistics 2021-22
Annual publication providing a comprehensive overview of financial activity of Scottish local authorities in 2021-22 based on authorities' audited accounts (where available).
The publication tables workbook accompanying this publication was amended on 25 August 2023. Tables 2.14, 2.14a, 2.16, 2.17, 2,17a, and Chart 2.11 were amended to reflect the audited figures for 2021-2022, rather than unaudited provisional outturn figures. The publication itself has not been amended.
No other tables were amended.
The publication tables workbook accompanying this publication was amended on 23 February 2024. Chart 2.7 was amended to fix an error in the underlying calculation. The publication itself has not been amended.
Key Facts
How much did local authorities spend on services in 2021-22?
- Revenue expenditure is the cost of delivering services each year.
- Gross service expenditure is total expenditure on services in year minus internal transfers.
- Gross service income is total income authorities receive from services, such as service specific grants or income generated through fees, etc.
- Net revenue expenditure is gross service expenditure minus gross service income. It reflects the amount of service expenditure to be funded by general funding or reserves.
Net Revenue Expenditure in 2021-22 by service, £ millions
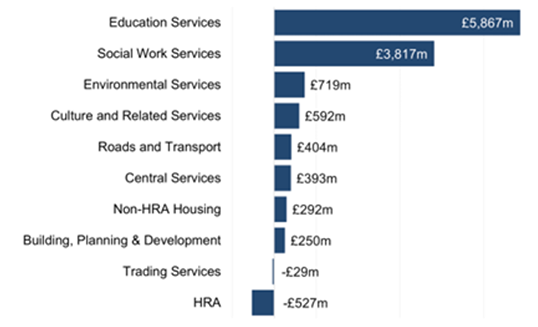
| Gross Service Expenditure | £21,626 million |
|---|---|
| Gross Service Income | £9,846 million |
| Net Revenue Expenditure | £11,780 million |
How did local authorities fund services in 2021-22?
- General funding is largely made up of the General Revenue Grant (GRG), Non-Domestic Rates (NDR) and Council Tax.
- Local authorities use general funding to meet their net revenue expenditure on services and any other revenue expenditure that is not directly related to services, such as repayment of debt.
- In 2021-22, local authorities’ expenditure was less than their general funding. This surplus was added to local authorities’ reserves.
General Funding in 2021-22 by source, £ millions
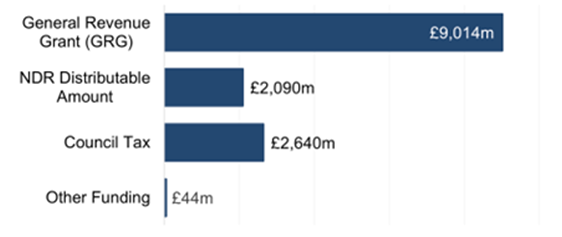
| General Funding | £13,788 million |
|---|---|
| Net Revenue Expenditure | £11,780 million |
| Non-Service Expenditure | £1,714 million |
| Surplus added to Reserves | £294 million |
What was the value of capital investment in 2021-22?
- Capital expenditure is expenditure that creates the buildings and infrastructure necessary to provide services, such as schools, flood defence, roads and vehicles.
- Capital expenditure also includes capital grants or loans to third parties funded from borrowing.
Capital Expenditure in 2021-22 by service, £ millions
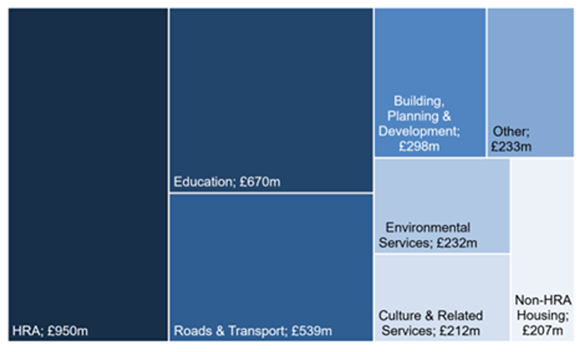
Please note that "Other" includes Social Work, Central Services and Trading Services.
Total Capital Expenditure = £3,341 million*
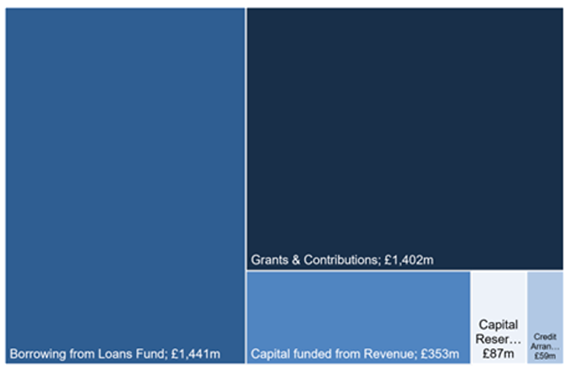
How did local authorities finance the £3,341 million of capital expenditure incurred in 2021-22?
- Local authorities can finance capital expenditure in a number of ways. The main sources of financing in 2021-22 were:
- Grants & contributions, including those from the Scottish Government;
Borrowing; and - Use of revenue reserves.
- Grants & contributions, including those from the Scottish Government;
Financing of Capital Expenditure in 2021-22 by source, £ millions
What reserves did local authorities have at 31 March 2022?
- Usable reserves are local authorities’ surplus income from previous years. This can be used to finance future revenue or capital expenditure.
- The General Fund is the main usable revenue reserve, although there are other reserves that local authorities may be able to use.
- There are also two usable capital reserves.
Usable Reserves at 31 March 2022, £ millions
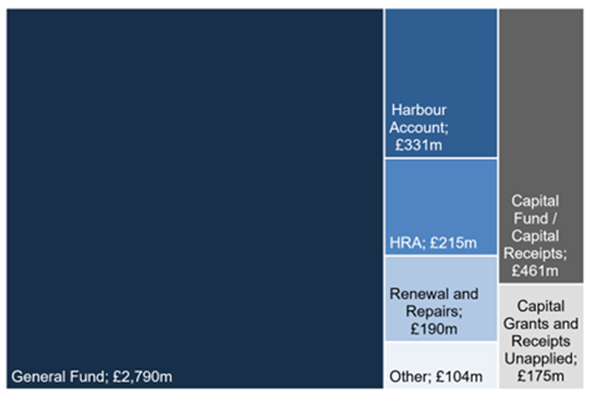
"Other" revenue reserves includes the Insurance Fund.
Usable Reserves at 31 March 2022 = £4,266 million
What debt did local authorities have at 31 March 2022?
- When a local authority borrows money or uses a credit arrangement to finance capital expenditure, a debt is created.
- Local authorities have to repay this debt from future revenues.
- In 2021-22, local authorities repaid £553 million of debt.
Total Debt at 31 March from 2017-18 to 2021-22, £ millions
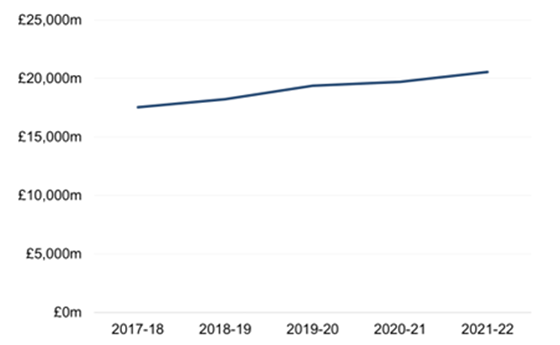
Total Debt at 31 March 2022 = £20,549 million
Contact
Email: lgfstats@gov.scot