Scotland's Marine Atlas: Information for The National Marine Plan
Scotland's Marine Atlas is an assessment of the condition of Scotland's seas, based on scientific evidence from data and analysis and supported by expert judgement.
COASTAL PROTECTION AND FLOOD DEFENCE
What, why and where?
Coastal erosion and flooding pose a threat to people and their property at the coast. For generations, society has built defences to prevent erosion and protect land from flooding. Examples of these include groynes, sea walls and embankments (termed hard engineering).
Present day approaches also include soft engineering such as replenishing eroding beaches with sand, referred to as beach nourishment. Also, nature is occasionally allowed to take its course through managed retreat or coastal realignment, where existing hard defences are intentionally or naturally allowed to breach so recreating natural saltmarsh. This provides a place for high tides to spread out and would be most effective in firths.
There is no central record of all historic coastal management schemes, although aerial survey would indicate where the coast had most likely been altered. SNH estimate that 429km of mainland Scotland's coast is artificial, 307km of this is coastal defences, the rest being other developments such as piers and harbours (1).
Light Detection and Ranging ( LIDAR) can produce a high-resolution map of terrain, from which it is possible to identify man-made structures. LIDAR also allows for the monitoring of changes in coastal structures.
Digital elevation model from Li DAR super-imposed on Ordnance Survey map of southern South Uist
Source: SNH(2)
Note: shading shows changes in altitude; lighter colours are lower, darker colours are higher ground. The gradual narrowing and lowering of the dune reach towards Cille Pheadair is clear in the LIDAR image, as is the extensive low-lying area inland of the dune ridge, which is the bed of a drained loch.
Defences at Aberdeen
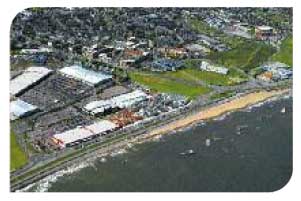
© Aerial Photography Solutions
Contribution to the economy
The key contribution of coastal protection and flood defence schemes is through the protection of assets and infrastructure. They do not contribute directly to economic output, providing no measurable GVA and the number of jobs associated with this sector is difficult to measure accurately. The expenditure on these projects, where known, is shown in the tables, total £56M, with the main benefits being to protect property and reduce damage to economically important land. Costs to society are avoided through the existence of the schemes.
Pressures and impacts on the environment
Pressure theme: Climate change and physical pressures
Pressure: Beach replenishment/nourishment to mitigate erosion
Impact: Change in beach profile leading to hydrographic changes.
Pressure: Hydrographic change from the presence of the structures
Impact: Change in sedimentation pattern may lead to erosion/sedimentation processes in adjacent areas. Defences may also lead to accelerated erosion in front of the defences (6).
Pressure theme: Pollution and other chemical pressures
Pressure: Beach replenishment/nourishment to mitigate erosion
Impact: Changes in beach morphology and replenishment material may contain contaminants.
Pressure theme: Other physical pressures
Pressure: Introduction of noise
Impact: Noise related to construction activities, including sediment addition for soft schemes, can cause disturbance and changes to behaviour of certain species e.g. to foraging birds; movement of material may cause disturbance to fish (7).
Pressure theme: Habitat changes
Pressure: Beach replenishment / nourishment to mitigate erosion
Impact: Habitat changes where deposited material is different from current beach material; shelly material may prevent erosion - important for dunes; coarser material may slow down vegetation successions enhancing habitat value for nesting shore birds; any change may alter suitability for burrowing species, food supply (including to shorebirds).
Pressure: Physical presence of structure
Impact: Hard coastal defencesFragment and replace sedimentary habitats, leading to habitat changes and species level pressures. Diversity and abundance of species has been found to decrease on artificial structures (8)(9). Structures can be a barrier to species movement.
Soft engineered schemes
Smothering by new layer of material. Possible erosion of fine particles causes increased turbidity which can alter primary productivity within sub tidal areas. Nourished beaches have less diverse ecosystems than natural (10) beaches, with reductions in dominant macro invertebrate species (11). Loss, reduction and replacement by other types of habitats.
Source: Based on CP2 PSEG Feeder Report Table 3.16 and 3.17 (5)
Coastal realignment at Nigg Bay, Cromarty Firth (3)(4)
In 2003, an inner sea wall was restored at Nigg to withstand a 1 in 50 year tidal event. This allowed the outer sea wall to be breached letting high tides onto land that was previously improved grassland. This created 25ha of intertidal habitat: a combination of mudflat, and low, mid and upper saltmarsh, and some dry grassland.
Up to 2,000 waterbirds now use the site as a mid tide feeding area and high tide roost; approximately 20% of the waterbird population of Nigg Bay. The Firth supports internationally important numbers of knot, bar-tailed godwit, pink-footed goose and greylag goose and nationally important numbers of redshank, curlew, oystercatcher, red-breasted merganser, scaup, pintail, wigeon, mute swan and Slavonian grebe.
The environmental benefits can be stated in qualitative terms but it is difficult to attribute a financial value to them. The scheme cost £53,840. The RSPB have been monitoring the area to assess its impact on species assemblages, vegetation and sedimentation.
Nigg Bay managed realignment scheme, Cromarty Firth
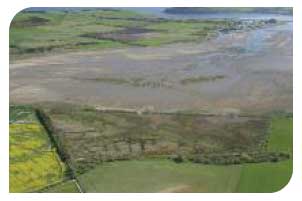
© N Russell, RSPB
Forward look
With the rise in global sea-levels and a predicted increased risk of storm surges, Scotland's coastal infrastructure and habitats may be placed under increasing threat (12)(13). Rising sea levels and changes to wave conditions may alter erosion rates, increase the incidence and severity of flooding events, and affect intertidal profiles (12). This may well increase demand for coastal defences.
Long-term tide gauge measurements (see Chapter 2) at Aberdeen show a rising trend over the last 100 years of around 0.7 mm/year, whereas a tide gauge in Lerwick, Shetland Islands, has recorded a fall in relative sea level since 1957 (13). Global sea-level rise is offset in some areas by the isostatic rise in the Scottish landmass, which has continued since the melting of the ice sheets at the end of the last ice age (14).
There is potential resource for beach nourishment material from the seabed although this would be subject to obtaining consent. Beneficial re-use of maintenance dredging spoil is an alternative source.
Some local authorities have developed Shoreline Management Plans to guide the management of their coasts. The Flood Risk Management (Scotland) Act 2009, which repeals the Flood Prevention (Scotland) Act 1961, establishes a framework within which sustainable flood risk management of coastal flooding will operate more effectively.
Flood defence schemes (since 1961) and coast protection schemes (since 2000)
![]() Flood defence schemes since 1961
Flood defence schemes since 1961
Number on map |
Location |
Cost (£M) |
|---|---|---|
1 |
Ayr South Pier |
|
2 |
Saltcoats |
1.8 |
3 |
Largs |
0.7 |
4 |
Clydesmill Stage 1 |
|
4 |
Clydesmill Stage 2 |
|
5 |
Dalmarnock |
|
6 |
Rothesay |
1.6 |
7 |
North Renfrew |
6.6 |
8 |
Conon Bridge Village |
0.1 |
9 |
River Ness Tidal Section |
23.6 |
10 |
Carnoustie |
0.5 |
11 |
Tayview Caravan Park Monifieth |
|
12 |
Kincardine-on-Forth |
0.7 |
13 |
Bo'ness Foreshore |
7.5 |
14 |
Prestonpans |
Source: Scottish Flood Defence Asset Database Coastal schemes undertaken under the Flood Prevention (Scotland) Act 1961
![]() Coast protection schemes since 2000
Coast protection schemes since 2000
Number on map |
Location and year approved |
Length of scheme (km) |
Cost (£M) |
|---|---|---|---|
1 |
Craigston (2007) |
0.3 |
0.9 |
2 |
Ludag (2007) |
1.15 |
2.3 |
3 |
Stoneybridge (2007) |
0.5 |
0.2 |
4 |
Pol na Craan (2007) |
0.5 |
0.1 |
5 |
Balivanich (2007) |
0.15 |
0.5 |
6 |
Aberdeen Bay (2006) |
0.5 |
2.5 |
7 |
Stonehaven Bay (2000) |
No data |
0.2 |
7 |
Stonehaven Bay (2005) |
No data |
0.2 |
8 |
Carnoustie (2003) |
0.54 |
0.6 |
9 |
Tayview Caravan Park Monifeith (2003) |
0.4 |
0.4 |
10 |
Wemyss & Dysart (2000) |
No data |
4.8 |
Source: Scottish Government
![]() Managed re-alignment schemes
Managed re-alignment schemes
Number on map |
Location |
Construction Date |
Area (ha) |
Cost |
|---|---|---|---|---|
1 |
Skinflats |
2010 |
12 |
N/A |
2 |
Nigg Bay |
2003 |
25 |
£53,840 |
Source: RSPB
Pressures and impacts on Scotland's socio-economics
Positive
- Protection of property and business Employment in construction Conserving or enhancing amenity value of coastal land
- Salt marsh habitat creates defence with lower maintenance cost
Negative
- Long term sustainability issues of hard engineering in face of rising sea level and increased storm surges
- Short term loss of amenity, and possible road congestion, during construction
- Encourages coastal development in low lying areas
Source: Based on CP2 PSEG Feeder Report section 3.2.6 (5)