Scotland's Marine Atlas: Information for The National Marine Plan
Scotland's Marine Atlas is an assessment of the condition of Scotland's seas, based on scientific evidence from data and analysis and supported by expert judgement.
WAVES AND SEA LEVEL
Waves
Sea surface waves are mainly caused by the effects of wind on the surface of the sea. Their height is predominantly determined by the fetch (i.e. distance wind has blown over) and length of time of the wind forcing. Some local modification of wave height can be caused by tides. The seabed also influences waves in shallow water as waves will become steeper and higher as they approach the shore.
Within Scottish waters, the wave climate is mainly influenced by conditions in the North Atlantic ocean, where the fetch is long enough to establish large, regular waves known as swell. The north and west of Scotland (Hebrides, Orkney and Shetland) are most exposed to these conditions. On the east coast of Scotland, conditions in autumn and winter may also be rough in the North Sea because the wind direction can lead to a large fetch. Moreover, the Moray Firth is also relatively exposed because of its shoaling bathymetry and exposure to the North Sea.
Seas breaking over the breakwater at Aberdeen Harbour
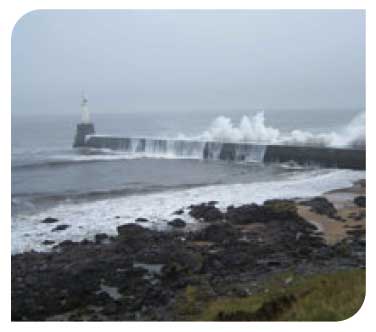
© Marine Scotland
Fishing vessel ploughing through the sea
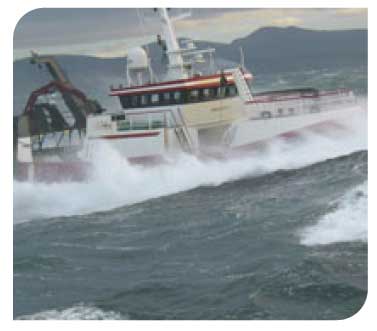
© Marine Scotland
Annual mean significant wave height
Annual mean significant wave height (m) (the average height of the highest 1/ 3 of waves). The wave height is greatest in the Atlantic, moderate in the North Sea and least in the immediate coastal zone where the values are generally < 1.2 m.
Annual mean significant wave power of wave crest
Annual mean significant wave power (kW/m of wave crest). Typical values in the coastal zone are between 0.1 and 12 kW/m of wave crest.
(Data from the Atlas of UK Marine Renewable Energy Resources, Commissioned by DTI and produced by ABPmer, The Met Office & Proudman Oceanographic Laboratory (2008)., http://www.renewables-atlas.info/)
Sea Level
Sea levels are affected over short timescales by the rise and fall of the tide as well as the effects of storm surges. Over longer timescales, the sea level is affected by global climate change and movements of land masses relative to the Earth's crust.
The principal tidal components are the semi-diurnal (twice daily) tides although in some limited regions the diurnal (daily) tides are significant. The UK Tide Gauge Network, run by the Tide Gauge Inspectorate, records tidal elevations at a number of locations around the UK coast of which 11 are currently operating in Scotland. These measurements, together with those provided by the Scottish Environment Protection Agency ( SEPA) Tide Gauge Network, provide a long time series of sea level data. Annual mean sea level is the height of the sea averaged over a year. This removes short term fluctuations caused by waves and tides. Across the UK, mean sea level changes seasonally because of thermal expansion by approximately 10 cm (range), and is at a maximum in late summer.
Trends in sea level vary greatly at different sites. Much of this variation is probably caused by differential rates at which the land on which the tide gauges sit is moving up. This movement is caused by the land continuing to rise after the removal of the weight of ice after the Ice Age.
Impact of Rising Sea Level by Charting Progress 2 Regional Seas (see - Temperature, Salinity and Ocean Acidification section for description of these Regional Seas)
The rate of sea level rise around the UK coast, adjusted for land movements, was about 1.4 mm per year during the 20th Century.
Northern North Sea (Region 1) - rising sea levels are only adversely affecting a small proportion of the coast
Irish Sea (Region 5) - rising sea levels are adversely affecting a large proportion of the low-lying parts of the coast which are vulnerable to flooding and erosion
Minches and Western Scotland (Region 6) - rising sea levels are only affecting a small proportion of the coast
Scottish Continental Shelf (Region 7) - rising sea levels do not pose a significant threat to the coast which is rocky and rising
(Assessment taken from Charting Progress 2: The State of UK Seas; http://chartingprogress.defra.gov.uk)
Tidal Range
Tidal range is generally between 4 and 5 m; highest tidal ranges are found in the inner Solway Firth where the mean spring tidal range can be between 7 and 8 m. Tidal range is at a minimum in areas known as amphidromic points. One of these points occurs in Scottish waters between Islay and the Mull of Kintrye; another amphidromic point can be found in the north east of the North Sea. Tidal range decreases with distance offshore from the North East coast.
Stornoway (S)
Ullapool (U)
Port Ellen ( PE)
Portpatrick (P)
Tidal Surges
Tidal surges caused by storms do occur in Scotland, and mainly affect the east coast. However, storm surges are less significant around Scotland than in regions further south because of the way that the surges grow as they propagate southward. For example, the most significant storm surge ever recorded over the last 100 years occurred in 1953. During that event surge levels of 0.60 m and 0.83 m were recorded at Aberdeen and Leith respectively, but reached 2.97 m in southern England (Kings Lynn) and 3.36 m in the Netherlands. The 1 in 50 year storm surge predictions for Scotland are around 1.25 m.
Tidal Gauge Networks in Scotland and mean spring tidal range (m)
Source for the UK Tidal Gauge Network: Permanent Service for Mean Sea Level (http://www.psmsl.org/data/obtaining/)
Lerwick (Le)
Aberdeen - One of the longest mean sea level time series in the United Kingdom
Until the mid-1980s, sea levels in Aberdeen have varied around the 1920 levels. However, for every year since 1985, sea levels have been higher than 1920. On average, in the past two decades, sea levels are more than 60 mm higher than the baseline. Between 2006-08 sea levels have been higher than 1920 by more than 100 mm.
Wick (W)
Aberdeen (A)
Leith (L)
Source for Annual Mean Sea Level plots: Permanent Service for Mean Sea Level, UK.