Scottish Index of Multiple Deprivation: 2009 General Report
Scottish Index of Multiple Deprivation 2009: General Report
11. Case Study - Highland
11.1. The purpose of including a case study within this report is to give some examples of how the SIMD and its constituent domains can be used independently, together and with other data. Although the SIMD has been designed for a specific purpose, it can be used flexibly depending on what the particular area of interest or focus of the analysis.
11.2. For the purposes of this case study, the data and ranks pertaining to one Local Authority will be used. However, any analysis that is shown here can just as easily be applied to any large geographical area and any data - provided the data is available at datazone level.
Summary of SIMD 2009 results for Highland
11.3. In the SIMD 2009 Highland has a total of 16 datazones in the 15% most deprived, which equates to 1.6% of the national total and 5.5% of all the datazones in Highland. This was a drop of one datazone from SIMD 2006. Table 11.1 gives the numbers of datazones in the 15% most deprived for each of the domains for Highland.
Table 11.1: Summary of SIMD 2009 results for Highland
Domain |
DZ's in 15% Most Deprived |
National Share |
Local Share |
|---|---|---|---|
Access |
127 |
13.00% |
43.50% |
Crime |
36 |
3.70% |
12.30% |
Health |
22 |
2.30% |
7.50% |
Education |
20 |
2.00% |
6.80% |
Income |
16 |
1.60% |
5.50% |
Overall SIMD |
16 |
1.60% |
5.50% |
Employment |
14 |
1.40% |
4.80% |
Housing |
2 |
0.20% |
0.70% |
Using the SIMD Results
11.4. The above table shows that while Highland has a relatively small proportion of the datazones described as deprived by the overall SIMD rank, the individual domains give a different picture and suggests areas for further investigation.
11.5. One way of using these results is to look at the change that has occurred between the previous version of the SIMD and this one. This will give a general idea of how the Local Authority area is performing relative to the rest of Scotland. For example, it is possible to see if the national share of the 15% most education deprived datazones is increasing or decreasing. This approach will however only give a relative picture - it will not show anything about the actual changes that have occurred in the three years between indices. This can be done though by looking at the individual indicators within the domain.
Analysis of the Education Domain Indicators
11.6. Looking at the Education Domain for Highland, it can be seen that between SIMD 2006 and 2009, the number of datazones in the 15% most deprived jumped from thirteen to twenty. Of the original thirteen, eleven remained in the 15% most deprived, which means that two moved out and nine moved in. Did the two that moved out actually improve? And did the nine that moved in really get worse?
11.7. Looking at the actual data in table 11.2, below for the two indicators that can be compared, it can be seen that for the datazones that moved into the 15% most deprived the absence rate increased between 2006 and 2009 and the SQA tariff score on the whole decreased. The opposite is true for those datazones that moved out.
Table 11.2: Absence rate and SQA tariff score for movers into and out of 15% most education deprived in Highland
Moved in. |
Absence Rate |
SQA Tariff Score |
||
|---|---|---|---|---|
2006 |
2009 |
2006 |
2009 |
|
S01003790 |
8.4 |
9.7 |
142 |
121 |
S01003796 |
8.1 |
8.5 |
98 |
122 |
S01003833 |
10.9 |
11.1 |
169 |
123 |
S01003856 |
11.3 |
15.3 |
158 |
107 |
S01003922 |
7.3 |
9.7 |
150 |
112 |
S01003928 |
8.3 |
10.0 |
138 |
130 |
S01003931 |
6.7 |
9.3 |
129 |
118 |
S01003976 |
9.7 |
10.0 |
120 |
112 |
S01003978 |
7.5 |
10.4 |
163 |
128 |
Moved out. |
||||
S01003724 |
9.9 |
7.0 |
104 |
164 |
S01003822 |
13.1 |
11.4 |
119 |
121 |
Analysis of the Health Domain Indicators
11.8. As well as looking at a whole Local Authority or large area, it is also possible to use the SIMD to look at a particular part of Scotland. Chart 11.1 below shows the domain ranks for the datazones that make up Fort William. None of these datazones fall into the 15% most deprived on the overall SIMD. Looking more closely at the health domain ranks it can be seen that datazone S01003731 - Fort William Central, has the lowest rank of the group at 563. It is possible to further analyse the health domain indicators to see which aspects of the health domain are of most interest in this particular datazone. This data is displayed in Chart 11.2., below. Highland Council have named all their datazones and these names are included here.
Chart 11.1: 2009 Domain ranks for the datazones in Fort William

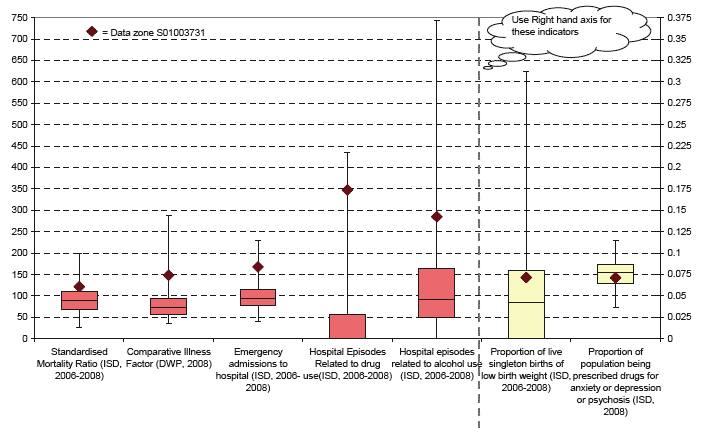
11.9. Chart 11.2 shows the range of each indicator in the Health Domain for Highland using box plots. A full description of what box plots do is available on page 63 of this report. The values for the datazone of interest are highlighted on each range. The higher up the line the dot representing S01003731 lies the closer it is to the highest or worst value in Highland. The box represents the middle 50% of datazones with the lines representing the most and least deprived 25% and the end of the lines the most and least deprived.
11.10. The first five indicators on the chart show values in the top 25% for Highland, with the highest being hospital admissions for drug use. This would seem to suggest that drug use is an issue in this particular area. On the other hand the proportion of the population being prescribed drugs for anxiety, depression or psychosis falls below the median for Highland.
Chart 11.2: Health indicator ranges for Highland
* The data used in this analysis is all available on both the SIMD website and the Scottish Neighbourhood Statistics website.
Using the domains together
11.11. Looking at Table 11.1. above, from the data used to construct the SIMD, it appears that access to services is the most widespread issue for people living in Highland. This may not be much of a surprise, given the size of Highland. However, this data can be used in conjunction with the other domain data to give more detailed pictures of specific areas.
11.12. It is possible to look at where domains overlap. So if there is, for example, a large overlap between access and employment deprivation, then a relevant question might be 'Do the people in that area need job training or better public transport links?'
5, 10, 15, or 20%? Nationally or Locally?
11.13. The descriptions so far have looked at using the 15% most deprived nationally. This is the level of analysis that is initially recommended by the Scottish Government but it is by no means the only way that analysis can be done. Different policy needs will dictate different levels of analysis.
11.14. Within Highland for example, there may be a policy focus to decrease the number of employment deprived people. If the areas classed as employment deprived relative to Scotland as a whole were targeted, then that would mean that 14 datazones with approximately 1,600 employment deprived people would be the focus of the policy. If the decision was made to look at the 15 or 20% most employment deprived areas within Highland, that could see up to around 4,600 individuals being targeted instead. For each policy it will be necessary to look and the SIMD and domains and decide on the most appropriate domains, indicators and cut offs to use for a given purpose.
Using other data with the SIMD
11.15. It is also possible to analyse other data using the SIMD ranks. In fact, much of the analysis done by Scottish Government analysts is also broken down using SIMD ranks or decile (10% band). The General Register Office for Scotland, for example, produce an annual publication which gives details of estimates of the number and types of households and dwellings in Scotland. Some of the data presented within this publication is broken down by SIMD decile.
11.16. Looking again at Highland, it is possible to analyse other data, for example data relating to breastfeeding, to see if there are any differences between the most deprived areas in Highland (say 20%) and the rest of the Local Authority. This, and other, data is available at datazone level on the Scottish Neighbourhood Statistics website. Table 11.3., below, shows the results of this brief analysis. It shows that in 2008 the rate of children breastfeeding at the 6 - 8 week review was lower in the more deprived areas of Highland.
Table 11.3: Children Breastfeeding at the 6 to 8 week review
No. breastfeeding |
% breastfeeding |
|
|---|---|---|
20% most deprived DZ's in Highland |
122 |
29.05 |
Rest of LA |
587 |
47.15 |
LA as a whole |
709 |
42.71 |
11.17. There may more detailed or additional data sources available for parts of Scotland collected and held in local areas or even local data such as that collated by Social Work or education Departments, this may be available to Community Planning Partners for further analysis. Much of this data will not be initially available by datazone but any data with a post code attached can be matched to datazones using the post code look up tables that are available both on Scottish Neighbourhood Statistics and the SIMD web pages. In this way it could be possible to identify if there are specific issues for children in deprived areas or to identify that these issues are not specific to areas of high deprivation.
11.18. The SIMD guidance leaflet contains more information about what the SIMD can and can't be used for and the SIMD team are always happy to advise on the use of the SIMD and its constituent parts.
There is a problem
Thanks for your feedback