Economic impacts of wind farms on Scottish tourism: report
Report commissioned by Glasgow Caledonian University to assess whether government priorities for wind farms in Scotland are likely to have an economic impact on Scottish tourism.
7 The Economic Impact Analysis
7.1 Introduction
Chap 2 identified the key stages in estimating the proportionate change in expenditure in an area, specifically
- Identifying the change in likelihood of a return visit to Scotland as a result of different levels of exposure to wind farms
- Identifying the proportion of tourists in an area to whom this applies
- Identifying the proportion of accommodation that is exposed
- Estimating the likely proportionate change in expenditure in the affected accommodation
In chapters 4, 5 & 6 the methods used to identify these four elements were discussed in some detail.
Once the proportion of tourist expenditure that will be lost has been estimated then a number of further stages are required before the economic impact can be determined. These are as follows:
1. The total Tourist (including specifically accommodation) expenditure in each area is identified
2. The lost expenditure is estimated
3. The distribution of the expenditure by industry is determined
4. The proportion of expenditure in an industry that leaves the area is determined (e.g. VAT, Duty, purchases from outside the area brought in for retailing).
5. The balance, the Direct Expenditure by industry is identified.
6. Using a local input output table, the resulting drop in purchases from other local industries (The Indirect Effect) as a result in drop of activity is assessed.
7. The drop in employee incomes as a result of the Direct Effect is calculated.
8. The drop in purchases from local industry (the Induced Effect) by the local employees is identified.
9. The resulting drop in expenditure in local industry as a result of the indirect and induced effect is identified.
10. This Round 1 fall in industry output then itself has an impact. The further contraction in purchases from local industry by local industry and in purchases from local industries by local employees is calculated to give the Round 2 effect.
11. Successive rounds 3, 4,……,10 are estimated and aggregated
12. The implications of the change in output for employment and income or gross value added are identified.
The following sections discuss:
- Estimates of total Tourist Expenditure in an area and the satellite tourist account that identifies the relationship between that send and the spend in local industries
- Estimates of the change in expenditure
- The development of local input-output models and the DREAM system
7.2 Measuring tourism within the Scottish economy
The only official study of tourism's economic significance in Scotland utilising modern methodologies estimated expenditure on tourism in 2001 to be £6175 mn 17 .
This measure is based on the definition of a tourist as someone outside their normal environment and includes business trips, visits to friends and relatives whether as leisure, pleasure or otherwise, study and other motivations. It includes trips including an overnight stay and also includes day trips (although short day trips less than three hours long were excluded by convention, and non-leisure day trips were excluded because they were not recorded).
This report was written in 2007, and so we have attempted an update of the official figures, as follows:
Table 7-1 Estimated tourism spending summary 2006
2006 |
Scottish residents |
Other UK residents |
Overseas visitors |
Total |
|---|---|---|---|---|
Holiday |
731 |
1099 |
696 |
2,527 |
Business |
238 |
378 |
259 |
875 |
VFR |
98 |
119 |
325 |
543 |
Other |
22 |
34 |
159 |
215 |
Tourism day visits |
3,202 |
3,202 |
||
Total |
4,292 |
1,630 |
1,439 |
7,361 |
Source: cogentsi based on published 2005/2006 figures:see text
Setting these figures out graphically indicates how important day visits are to the economics of tourism.
Figure 7-1 Estimated tourism spending summary 2006
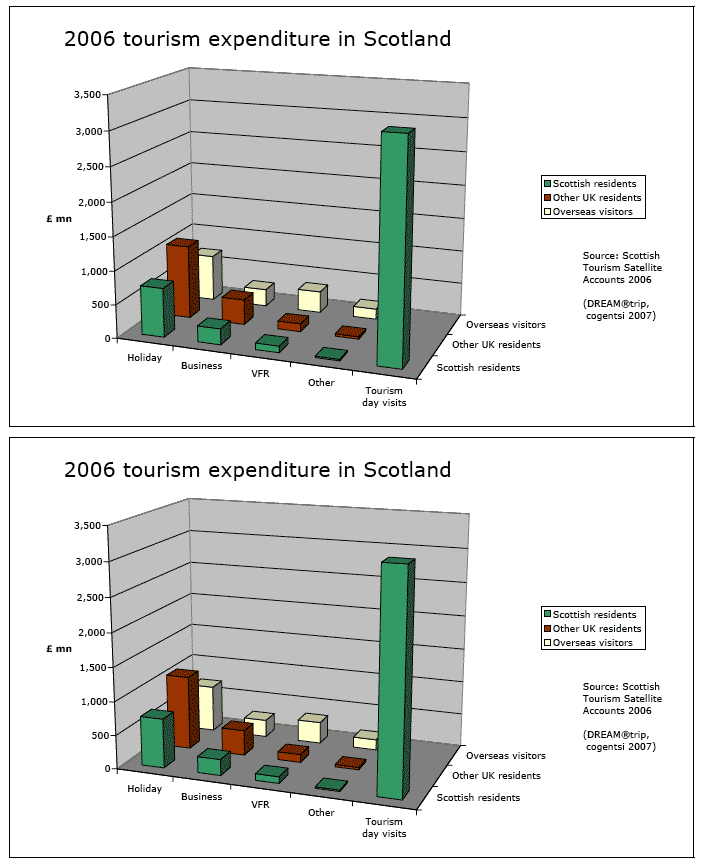
For decades the long run trend of tourism in the world has been upwards, driven by rising prosperity and reductions in the cost of travel, which have also affected the balance between destinations. In recent years the figures have shown dramatic trends, some of them due to real events like the spread of budget airlines, and some purely statistical effects described below. Attempting to see through the latter to identify actual changes in visits to Scotland, the trends for alternative types of visit from different origins are significantly different. The last five years have seen rapidly expanding foreign visitor numbers (almost a doubling), a declining number of UK visitors and Scottish holiday visitors, but significant expansion of day visits and a slight spending increase for non-holiday visits by Scots within Scotland.
The main reason the trends are uncertain is that the principal surveys for UK tourism found increasing problems. The UK Tourism Survey, which addresses tourism by UK residents within the UK found problems with its telephone interview methods, and had to be switched in May 2005 to face-to-face interviews and a new operator. As a result 2004 figures are generally discounted completely, and the quoted 2005 figures are based on real data for the final eight months, but the first four months are based on uprating the same period of 2002 using May-December 2005 data. Unfortunately both years were highly unusual for the sixty per cent of Scottish tourism that goes on outwith the cities. Early 2001 had been hit by Foot and Mouth Disease, and local views are that the rural areas directly affected did not by any means fully recover in the following year. In 2005 the G8 Economic Summit was held at Gleneagles, with a dramatic effect on Perth and Kinross tourism and lesser, but still large, effects elsewhere.
For leisure day visits no GB survey has been held since 2002/3. However, we have been able to use data from the Scottish Recreation Survey conducted by SNH and the Forestry Commission. For international visits a growing anomaly has had to be addressed. The Office for national Statistics has instituted new sampling points at Prestwick Airport and Rosyth Ferry terminal, where previously visitor totals had been collected, but no information on travellers or destinations.
Given these overall difficulties with the tourism surveys, VisitScotland was uncomfortable releasing local visit details, below the level of tourist areas. The tourist area estimates for UK overnight visits in 2005 were as follows:
Table 7-2 Tourist area estimates for 2005
visitScotland |
mn |
mn |
£mn |
% split of trips |
Business |
Other |
|
|---|---|---|---|---|---|---|---|
Nights |
Trips |
Spend |
Holiday |
VFR |
|||
Aberdeen & Grampian |
5.61 |
1.58 |
297 |
73% |
10% |
14% |
3% |
Angus & Dundee |
2.39 |
0.69 |
98 |
61% |
16% |
22% |
1% |
Fife |
1.97 |
0.65 |
76 |
60% |
17% |
22% |
1% |
Greater Glasgow, Clyde Valley |
7.19 |
2.62 |
557 |
61% |
16% |
17% |
6% |
Argyll, Islands, Loch Lomond Stirling & Trossachs |
6.61 |
1.67 |
342 |
61% |
16% |
17% |
6% |
Highland |
8.04 |
1.84 |
438 |
72% |
10% |
14% |
4% |
Ayrshire & Arran |
3.06 |
0.94 |
196 |
69% |
17% |
11% |
3% |
Borders |
1.26 |
0.34 |
58 |
68% |
18% |
15% |
0% |
Dumfries & Galloway |
3.56 |
0.97 |
200 |
69% |
17% |
10% |
4% |
Perthshire |
2.68 |
0.84 |
206 |
60% |
17% |
22% |
1% |
Edinburgh & Lothians |
7.05 |
2.78 |
706 |
60% |
16% |
22% |
2% |
Residual (Islands) |
4.18 |
n/a |
n/a |
||||
Scotland |
53.6 |
14.87 |
3006 |
63% |
17% |
15% |
5% |
Source: visitScotland regional data sheets
Ref: P215 visnorationalise#
We have therefore used detail from happier days to put together a set of Council area estimates for 2006 that add up to the national totals. In the jargon this is known as 'modelling down' and is used, for example, to fill in figures in surveys where the small number of respondents would make sampling errors unacceptably large.
In addition to the national figures and the area figures above, our basic data was overnight stays taken from the Grant Aid calculations for local councils used by the Scottish Executive. These were based on special extracts from the visitor surveys commissioned for 2003. Since funding was directly tied to them they have been scrutinised not only by the Executive but by the councils.
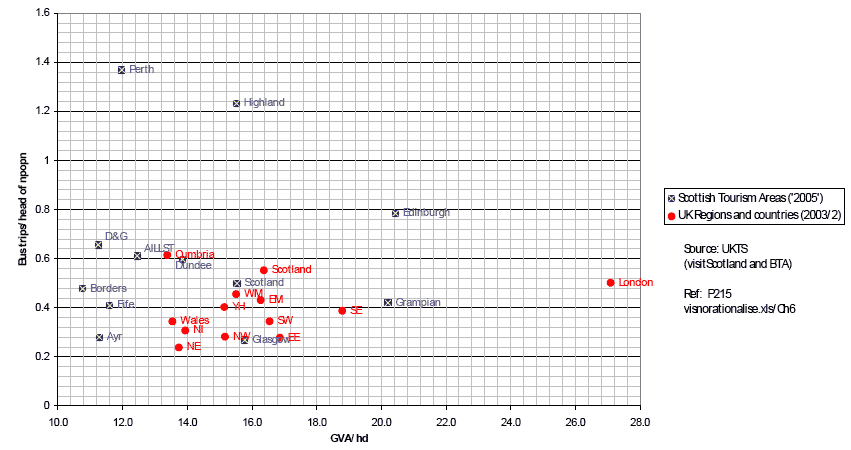
The approach taken was to generate a full matrix of trips, nights and expenditure by the four overnight trip purposes by disaggregating the area statistics, using Scottish averages for trip length and spend per night. The allocation of business trips within tourist areas was by the GVA generated in the area, with a small uprating for the cities as business hubs and Renfrewshire as a transport hub (ie business visitors within Edinburgh and the Lothians were expected to be more likely to stay in Edinburgh, those within Greater Glasgow and Clyde valley to stay in Glasgow or Renfrewshire). This was only done after some investigation and considerable consideration. Although superficially there is a negative correlation between GVA/hd and business trips/hd within Scotland, this appears to reflect an 'accessibility' effect found not only in Scotland but across the UK, shown in Figure 7-2.
Figure 7-2 Overnight business trips increase with dynamic destinations, but are reduced if day trips are feasible
Mo
What appears to happen is that productive and prosperous areas as measured by GVA do attract more visitors overall, but they also typically have far better transport access, so they are much more suitable for business day visits.
From the 2005 figures Perthshire was downrated to allow for the absence of the G8 Summit effect: this effect as estimated by dummy variables in simple regressions (ca 45 per cent) was commensurate with the economic impact estimates made by the Scottish Executive gross of displacement. Since the purpose of the downrating was simply to derive a proper allocation factor, it was not though necessary to adjust other areas where there was undoubtedly a G8 effect, but it was much smaller in proportion to the normal visitor volume.
The same principles were applied to allocate out the Highland figures to sub areas, using here figures which had been collected by HIE and HOST in a number of surveys over the past decade.
The results are shown in the tables on the following page.
7.3 Estimating changes in expenditure
In section 4 the results of the intercept survey were discussed. On of the more important findings was that, contrary to expectations, those intercepted who had high exposure to wind farms were no less likely to return than those with only medium exposure, indeed the evidence might suggest that close contact, such as on the A9 Causeymire, was more desirable than a wind farm outlined on a hill 10km distant. Given no significant difference in the groups the distinction was not pursued.
A second hypothesis was that those staying overnight would be more affected than those on long day trips because of an increased range of opportunities. As Table 7-3 shows, again there was no significant difference between the two groups.
Table 7-3 Intentions
ALL |
Overnight |
|||
|---|---|---|---|---|
Having Seen |
Area |
Scotland |
Area |
Scotland |
Number Sampled |
191 |
191 |
137 |
137 |
Number Responding |
4 |
4 |
3 |
3 |
Number Not Responding |
187 |
187 |
134 |
134 |
Percent Responding |
2.1% |
2.1% |
2.20% |
2.20% |
Change in Likelihood |
-0.08% |
-0.10% |
-0.12% |
-0.16% |
Photo |
Area |
Scotland |
Area |
Scotland |
Number Sampled |
380 |
380 |
256 |
256 |
Number Responding |
11 |
4 |
7 |
3 |
Number Not Responding |
369 |
376 |
249 |
253 |
Percent Responding |
2.89% |
1.05% |
2.73% |
1.17% |
Change in Likelihood |
-0.73% |
-0.05% |
-0.70% |
-0.10% |
Extended |
Area |
Scotland |
Area |
Scotland |
Number Sampled |
380 |
380 |
256 |
256 |
Number Responding |
26 |
5 |
19 |
4 |
Number Not Responding |
354 |
375 |
237 |
252 |
Percent Responding |
6.84% |
1.32% |
7.42% |
1.56% |
Change in Likelihood |
-2.54% |
-0.30% |
-2.50% |
-0.45% |
There are however significant differences between the likelihoods when wind farms are being built or being extended. Where tourists have seen wind farms then it hardly affects their chance of returning at all. We conclude that there would be minimal economic impact if they were dismantled. New wind farm developments on the same scale would have a slightly larger impact. Further extension would add to the likelihood of non return to a specific area. Even then the largest response is only 2.54% and this only applies to holidaymakers (not business trips). The reduction in likelihood of not returning to Scotland is very small indeed, even with substantially increased numbers of turbines.
For the purposes of this study, given that there is going to be both more wind farms and extensions to existing farms the largest of the responses, -2.54%, has been taken as applying to any area and the -0.45% applied to Non-Scottish visitors who might be deterred from visiting Scotland as a whole.
Table 7-4 gives the proportion of tourists and accommodation affected by area.
Table 7-4 Estimated Percentage Change in Tourist Expenditure by Area
Area |
Tourists on Holiday |
Travellers Exposed |
Tourists Affected |
Expenditure Reduction |
|---|---|---|---|---|
Caithness and Sutherland |
75.00% |
81.00% |
60.75% |
1.54% |
Stirling, Perth & Kinross |
60.00% |
85.00% |
51.00% |
1.30% |
The Scottish Borders |
68.00% |
91.60% |
62.29% |
1.58% |
Dumfries & Galloway |
69.00% |
98.00% |
67.62% |
1.72% |
This table shows quite clearly that it is important to note the type of tourists in an area as well as their exposure to wind farms to fully understand the likely reduction in expenditure from a development.
In section 6 the mean percentage short term loss for scenes involving extended farms was found to be 19.7%. This would imply a short term reduction in value of some 9.8% for each hotel using the assumption that 50% of the rooms are affected. Table 7-5 links the percentage of rooms directly affected with the percentage loss in price to give a percentage loss in value and accommodation expenditure.
Table 7-5 Estimated Change in Accommodation Expenditure by Area
Affected Accommodation |
Reduction in Value |
Accommodation Expenditure |
Expenditure Reduction |
|
|---|---|---|---|---|
Caithness and Sutherland |
4.90% |
0.48% |
£23.73 |
£0.11 |
Stirling, Perth & Kinross |
6.60% |
0.65% |
£203.67 |
£1.32 |
The Scottish Borders |
6.70% |
0.66% |
£54.25 |
£0.36 |
Dumfries & Galloway |
16.20% |
1.59% |
£102.78 |
£1.63 |
One assumption made here is that those who currently pay a premium give a value to scenery whatever the purpose for the trip. Most will be holidaymakers but some might be on business. Because the premium will disappear, the drop in expenditure will apply to all tourists not just holidaymakers.
7.4 The DREAM® system
The mapping of tourist expenditure to industrial output and the subsequent estimation of impact is undertaken within the DREAM system. The full DREAM model is based on 123 standard industries ( SIC) and products and eight institutional sectors
- Households
- NPISH, Non-Profit Institutions Serving Households
- Central and Regional Government
- Local Government
- Financial Corporations
- Non-financial Corporations
- Rest of the EU26
- Rest of the world
These consuming sectors absorb output and produce inputs for the 123 industries. However consumption is defined in terms of products (not industries) and follows a different international classification. The relationship between industry and product is defined by industry/product models and sub-models. Tourism is an activity that is matched to a pattern of consumption. Thus if we know there is a loss of expenditure of £1m this can be mapped to expenditure on products and from there to changes in direct expenditure in local industries.
Household demand can also be defined by socio-economic characteristics e.g. it is quite possible to distinguish differential impacts of age (e.g. the impact of a new University), sex or occupation.
The standard model has 155 geographic units. These are based on the " NUTS" classification of the European Union. In England, Wales and Northern Ireland the NUTS3 level is utilised. This is equivalent to the local authority areas. Because of the low population densities, in Scotland the model works to NUTS4 boundaries, sub-divisions of local authorities such as the Highland Region that correspond with Enterprise Company Areas such as Caithness and Sutherland. It should be noted however that geographic sub models can be produced to ward or postcode level.
7.5 Estimating the DREAM model
It is important to recognise that the DREAM model is based on the incorporation and reconciliation of ALL current official statistics on Production, Consumption and Trade at the lowest regional level in the UK. These models are updated whenever there is a new release of data. Riddington et al (2006) provides more detail of the construction of the model and some comparative tests of the validity of the resulting estimates.
The unique feature of the DREAM model is the estimation of Trade. The original Scottish models estimated trade matrices between the 41 geographical units used, but as the number of areas has grown (155 in the basic model) the all inclusive strategy has been modified. In the current version of DREAM, a "geography" is defined for each area appropriate to the main Trade flows between seven areas. The result is 123 7*7 trade tables. The seven areas are typically the home region, three key trading regions, the Rest of the UK ( RUK), the Rest of the EU ( REU) and the Rest of the World ( ROW). For example for the Caithness and Sutherland, trade flows for the 123 products were estimated between Caithness and Sutherland, Ross and Cromarty, the Rest of the Highland, the Rest of Scotland, RUK, REU and ROW. In total 5*123, 7*7 Trade matrices ( geographies for 4 case study areas plus Scotland, 123 industries, 7 trading partners) were identified to underpin the estimates.
Initial estimates of Trade are prepared using the production/absorption estimates as origin-destination values in a 'gravity' model. In such a model the trade between two areas is proportional to the total flows from the origin, the total flows to the destination, and inversely related to the distance between them. The importance of distance is summarised in a 'friction' coefficient describing the inverse relationship. These are then reconciled with all known data by a process of iteration. It is important to note that within any trade sub-model all trade flows will necessarily be balanced. However it is possible for a model based on the geography of the Scottish Borders which has a set of trading partners that includes the Edinburgh, East Lothian and the North East of England to generate slightly different trade flow values from a model based in the North East that includes the North West of England. Research has shown that these differences are extremely small.
Any disadvantages from the "specific geography" approach are significantly outweighed by advantages in terms of flexibility. Sub-divisions to NUTS4 level in England and Wales can be easily incorporated and analyses for specific problems constructed. As an example the "ripple" effect from a city to the suburban and semi rural areas can be identified as can feedback effects from the suburbs to the city. Gibson et al (2005) provides an example of the use of the model in this context. The identification of Feedback is unique to DREAM.
The first stage, building the Dream Snapshot Regional Model, is complex and data intensive and in general a User would not become involved in such detail other than in discussing the appropriate geography. The assessment of Economic Impact, however, involves detailed knowledge of the project or product. The procedures adopted are now discussed.
7.6 Estimating Direct Impacts
The estimation of direct impact is not straightforward. For each category the following procedure is followed
1. The categories are mapped to SIC industries. For example "Accommodation" and "Food and Drink Bought Out" are mapped to Hospitality. Most purchases however are via Retail. In this case the retail margin is allocated to the retail sector and the balance allocated to other industries. In the case of "Food and Drink Purchased" this involves a split between retail, various food processing sectors, soft drink, alcoholic drink and various agricultural sectors. The defaults for these splits are statistically based but may be modified by the user of DREAM.
2. VAT and DUTY are then removed. In the case of fuel and alcohol these are very significant.
3. The final step is the allocation of expenditure between home production and imports. Where the purchase is direct e.g. Accommodation, then this will normally be 100% Home Production. Where the purchase is via retail then the splits identified by the trade model are normally utilised , although these can be modified by the user to reflect specific situations (e.g. agency arrangements)
These three steps provide estimates of the change in output in each industry in each of the trading partners. It should be noted that in some cases such as fuel purchases in a region without refining or distribution facilities, each pound of expenditure may generate only 5p direct impact. If the main expenditure on an activity is travel by car, then it is quite possible for the expenditure to output multiplier to be less than 1.
7.7 Estimating Indirect Impacts
The indirect impact tracks industry to industry purchases in the local region. The Direct Impact is "spent" on (raw material) purchases from other industries (including services), on wages or is retained by the owners for either distribution or investment. To simplify the analysis, profit is added to wage to make "income" (or rather Gross Value Added GVA) and treated as if it were household income. Similarly investment expenditure is assumed to be exhausted in a year and thus treated as simply raw material in the production process.
The Input-Output Table identifies the split between the industrial sectors and the percentage of that which is expected to be local. This is the indirect impact within the region.
Uniquely the DREAM model also identifies feedback effects from the trading partners. Typically for example quarrying will be outside an urban region. An expansion of building demand in the urban region will lead to a flow of expenditure outside, but that industry will in turn utilise services inside the urban area Thus there will be an expansion of the service output indirectly via the trading partner region.
Aggregation of these industry to industry flows immediately following the expenditure is known as the Round 1 Indirect Impact. This change will then have a further impact as the industries purchase (or reduce) goods and services to meet this Round 1 impact. This Round 2 impact, in turn generates Round 3, Round 4 etc impacts. Although the model itself identifies 10 rounds, in practice 99% of the impact is identified in the first four rounds. The ratio of the total impact to direct impact is known as the Type 1 Output Multiplier.
7.8 Estimation of Induced Impacts
The expansion of activity generates increases in local incomes and consequently increases in local expenditure. In practice these effects are less than generally expected for two reasons. Firstly income tax, national insurance and pension payments reduce disposable income to be spent in the region. If the region does not have a financial sector then expenditures on mortgages and insurance also "leak" from the region.
The second problem is the propensity of consumers to import either directly or via retailers. For example expenditure in the "hospitality" sector will include holidays that are inevitably taken outside the region and increasingly outside the UK.
The procedure for estimating the induced impact is as follows
1. Taxes and NI are removed to give disposable income.
2. The direct spend to industries, as opposed to retail, is identified and the proportion of the direct spend to local industry estimated.
3. For retail the percentage of retail spent within the region is calculated. For small regions where the local retail park is outside the region this can be significant.
4. The retail margin is calculated and forms the retail industry's part of the induced effect.
5. The locally sourced proportion in each industry supplying retail is estimated and provides the third part of the induced effect.
6. The sum of these effects is the Round 1 induced impact and is added to the Round 1 indirect effect to provide a total round 1 impact.
7. The proportion allocated to incomes of the total round 1 impact is identified and goes on to generate the Round 2 impact.
8. The ratio of sum of the indirect and induced effects to the direct impact is known as the Type 2 multiplier.
7.9 Estimation of Changes in Incomes and Employment
In each round the additional income (Gross Value Added) generated is identified. The sum of these over all the rounds provides a measure of the additional (reduction in) income as a result of the change.
As discussed, each industry in each region has a unique productivity (reflecting the speciality of the region) and a unique pattern of employment to produce the output. It is relatively simple, therefore, to take changes in output and identify from that the employment by gender and employment category ( PT/ FT).
7.10 Presentation of Results
The DREAM model requires large amounts of data and is capable of generating the most detailed of outputs.
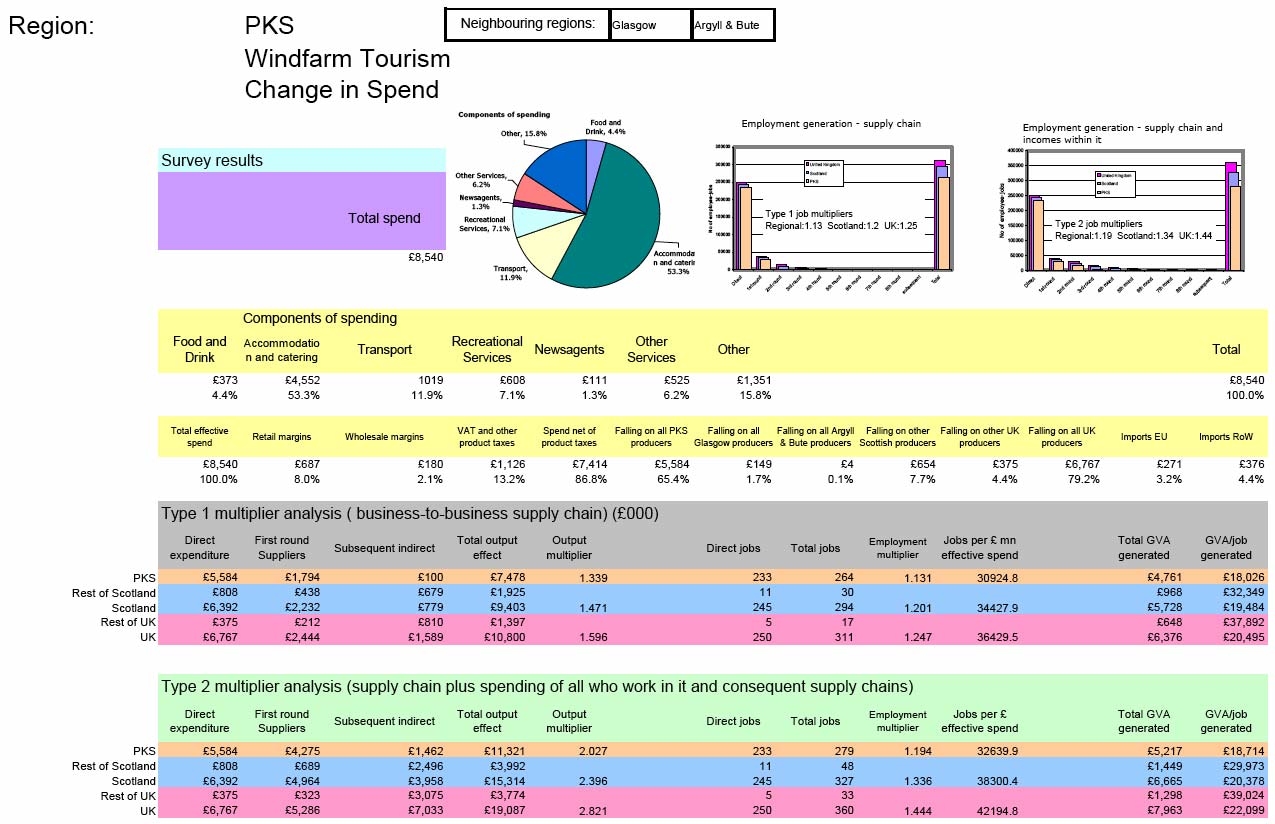
Figure 7-3 below is an example of DREAM output. In this case the output relates to the change in expenditure of tourists in Caithness and Sutherland. As can be seen, both Type I and Type II impacts on output, income and employment are reported. In Part 3 estimates of the impacts of both change in tourist expenditure and in accommodation expenditure for each study area and for Scotland as a whole are presented.
7.11 References for Chapter 7
Riddington G, Gibson H. and Anderson J. (2006) A comparison of gravity model, survey and location quotient based local area tables and multipliersRegional Studies, Vol. 40.9, pp. 1069-1081, December 2006
Gibson H., Riddington G., McIntyre S and Mackay S (2005) The Economic Impact of Sports, Sporting Events, and Sports Tourism in the U.K. The DREAMTMEuropean Sport Management Quarterly, Vol. 5, No. 3, pp 323-/334, September 2005
Figure 7-3 Stirling, Perth & Kinross Wind farm Tourism Change in Spend
Contact
Email: Central Enquiries Unit ceu@gov.scot
There is a problem
Thanks for your feedback