High Level Summary of Equality Statistics: Key Trends for Scotland 2006
The High Level Summary of Equality Statistics is a compendium which presents statistical trends on the main areas of Government activity in Scotland across a number of equality dimensions including age, disability, ethnicity, gender and in some cases religion. It provides a standardised, concise format for each topic and provides a route into more detailed statistics on each topic and each equality dimension by listing relevant publications and websites.
12. Social & Welfare
Introduction to Social & Welfare Issues and Equality
This section of the High Level Summary of Equality Statistics ( HLSES) presents key information on social and welfare issues in Scotland across a number of equality dimensions including age, disability, ethnicity and gender. It reflects key areas of activity identified in the main High Level Summary of Statistics ( HLSS) chapter on social and welfare issues ( http://www.scotland.gov.uk/Topics/Statistics) from an equalities perspective and includes a few additional topics where these are particularly relevant to equality issues. Where the main HLSS publication presents data by any of these equality dimensions, these are also shown here for ease of reference.
As well as showing key high level trends, the analysis highlights where differences and potential areas of inequality may exist for social and welfare issues in Scotland for those groups outlined above. The analysis is not intended to provide a definitive set of equalities data and more detailed statistics across the equality dimensions, where available, are referenced in the links provided. It is also not possible to break down all topics by all equality dimensions.
There are limitations in how far some data can be broken down by the above equality dimensions. Data often contain small numbers, particularly in the case of smaller ethnic groups and to some extent disability. As such, some data show a high degree of volatility. In such instances, data may have been combined for multiple years or multiple ethnic groups, whilst in other cases data may be shown for a single year only. In other instances small data may have been suppressed in order to protect individuals' confidentiality
Possible reasons underlying the differences reported in this chapter are not detailed here. Factors which contribute to differences between equality groups represent a complex interplay of cultural, demographic and socio-economic factors and, as such are outwith the scope of this publication.
Income
A comprehensive set of income and age group definitions are provided at the end of this chapter.
Individual Income
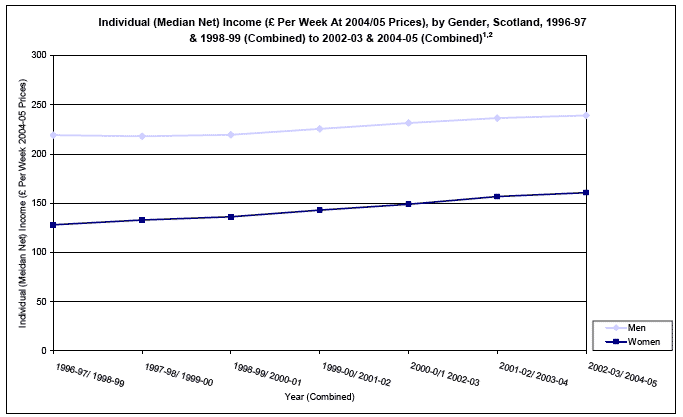
Individual Income: Gender
The individual income series provide estimates of the individual income of women and men and changes in income over time. These provide a means of comparing the income accruing to women and men, either directly or in their own right; that is income from all sources including earnings, investments, benefits, pensions and other sources. The individual income series do not provide a means of comparing the living standards of women and men, nor of different groups of women: the analyses take no account of the extent to which members of a household share their incomes or resources with other household members.
When looking at average income, median income is the preferred measure of average income as the income distribution is heavily skewed and the median is not affected by a few people with extremely high incomes to the same degree as the mean is.
The weekly median net individual income is 49% higher for males (£239) in 2003/04 - 2004/05 (combined) than females (£161). However this gap has narrowed somewhat over the past few years, for example in 1996/97 - 1998/99 (combined) income was 71% higher for males (£219) than females (£128).
Source: Individual Income - Women & Equality Unit - Department for Communities and Local Government
Notes: 1. Years have been combined due to small numbers.
2. From 2002-03 onwards there has been a doubling of the Scottish sample, therefore estimates from 2002-03 onwards should be less prone to fluctuation.
Publication
Social Focus on Women and Men 2002 http://www.scotland.gov.uk/stats/sfwm/docs/sfwm-00.asp
Web Link
Individual Incomes of Men and Women http://www.womenandequalityunit.gov.uk/indiv_incomes/index.htm
Individual Income: Ethnic Group
Median weekly individual income is currently higher for white ethnic groups than for minority ethnic groups.
Individual (Median, Net) Income (£ Per Week At 2004-05 Prices) of Household Heads, By Combined Ethnic Group, 2002/03 to 2004/05 1
£ Stirling
Year (Combined) |
Individual (Median, Net) Income (£ Per Week At 2004-05 Prices) |
|
|---|---|---|
Household Head |
||
Scotland |
||
White Ethnic Groups |
Minority Ethnic Groups |
|
2002-03 to 2004-05 |
195 |
165 |
Source: Individual Income - Women & Equality Unit - Department for Communities and Local Government
Note: 1. Due to small sample sizes, reliable estimates for individual years and individual ethnic groups are not available and instead, data have been combined for multiple years and by broad ethnic group. Trend data are volatile due to small sample sizes and as such time series are not available.
Publication
Analysis of Ethnicity in the 2001 Census - Summary Report http://www.scotland.gov.uk7ff5ee0f-3801-4607-b42e-2fbe7a66bf2d
Web Link
Individual Incomes of Men and Women http://www.womenandequalityunit.gov.uk/indiv_incomes/index.htm
Low Income
The following section is based on household income. The household (net disposable) income has been adjusted (equivalised) for the size and composition of the household, and can therefore, be used as a proxy for material living standards.
Relative low income is a measure of whether those in the lowest income households are keeping pace with the growth of income in the economy as a whole.
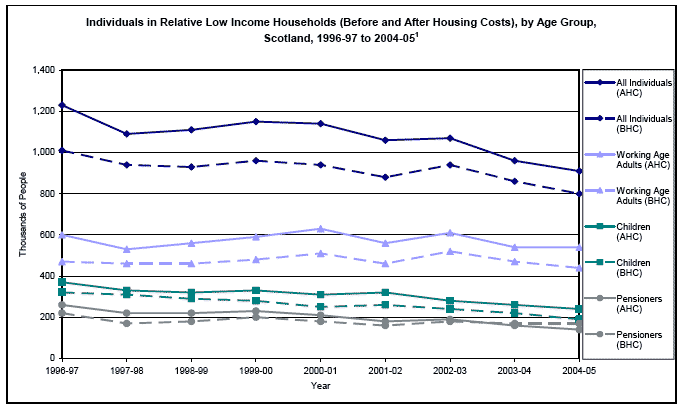
Individuals in Relative Low Income: Age
Over the past decade, the number of individuals in relative low income households has steadily decreased for all age groups but most markedly for children and pensioners.
Before Housing Costs - In 2004-05, 19% of all children live in relative low income households. The number of children in relative low income households decreased by 41% from 320,000 in 1996-97 to 190,000 in 2004-05. In 2004-05, 18% of all pensioners live in relative low income households. The number of pensioners in relative low income households decreased by 23% from 220,000 in 1996-97 to 170,000 in 2004-05. In 2004-05, 15% of working age adults live in relative low income households. The number of working age adults in relative low income has remained fairly steady between 1996-97 and 2004-05.
After Housing Costs - In 2004-05, 23% of children live in relative low income households. The number of children in relative low income households decreased by 35% from 370,000 in 1996-97 to 240,000 in 2004-05. In 2004-05, 16% of pensioners live in relative low income households. The number of pensioners in relative low income households decreased by 46% from 260,000 in 1996-97 to 140,000 in 2004-05. In 2004-05, 18% of working age adults live in relative low income households. The number of working age adults in relative low income has remained fairly steady between 1996-97 and 2004-05.
Source: Households Below Average Income ( HBAI), Department of Work and Pensions
Note: 1. From 2002-03 onwards there has been a doubling of the Scottish sample, therefore estimates from 2002-03 onwards should be less prone to fluctuation.
Publication
Income and Benefits Statistics for Scotland http://www.scotland.gov.uk/topics/statistics/18968/15950
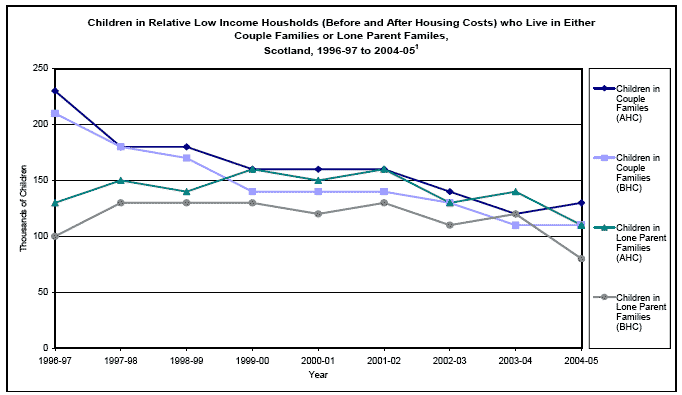
Individuals in Relative Low Income: Family Type & Age (Children)
Relative low income is a measure of whether those in the lowest income households are keeping pace with the growth of income in the economy as a whole.
Children in lone parent families are more likely to live in relative low income households than those in families with two parents.
Before Housing Costs - In 2004-05, 14% of children in families with two parents i.e. a couple, live in relative low income households. This compares to 31% of children in lone parent families. The number of children in couple families in relative low income households decreased by 48% from 210,000 in 1996-97 to 110,000 in 2004-05. By comparison, the number of children in lone parent families in relative low income decreased by 20% from 100,000 in 1996-97 to 80,000 in 2004-05.
After Housing Costs - In 2004-05, 17% of children in families with two parents i.e. a couple, live in relative low income households. This compares to 40% of children in lone parent families. The number of children in couple families in relative low income households decreased by 43% from 230,000 in 1996-97 to 130,000 in 2004-05. By comparison, the number of children in lone parent families in relative low income decreased by 15% from 130,000 in 1996-97 to 110,000 in 2004-05.
Source: Households Below Average Income ( HBAI), Department of Work and Pensions
Note: 1. From 2002-03 onwards there has been a doubling of the Scottish sample, therefore estimates from 2002-03 onwards should be less prone to fluctuation.
Publication
Income and Benefits Statistics for Scotland http://www.scotland.gov.uk/topics/statistics/18968/15950
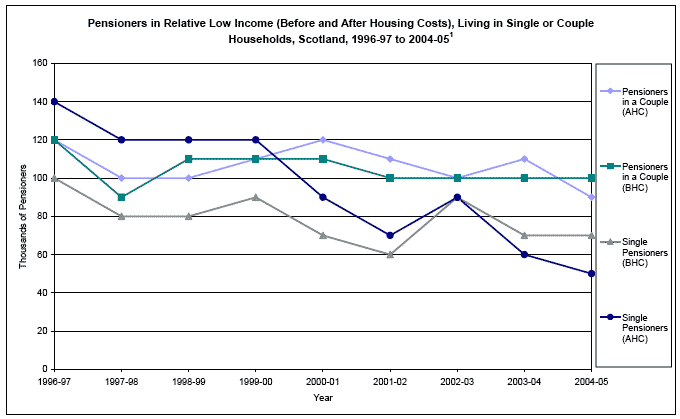
Individuals in Relative Low Income: Family Type & Age (Pensioners)
Relative low income is a measure of whether those in the lowest income households are keeping pace with the growth of income in the economy as a whole.
There is relatively little difference in the proportion of single pensioners and pensioners living as couple who are in relative low income households. However over the past decade the number of single pensioners living in relative low income households has decreased far more rapidly than for pensioners living as couples.
Before Housing Costs - In 2004-05, 19% of pensioners living as a couple were in relative low income households. This compares to 17% of single pensioners. The number of pensioner couples in relative low income households has decreased by 17% from 120,000 in 1996-97 to 100,000 in 2004-05. By comparison, the number of single pensioners living in relative low income households has decreased by 30% from 100,000 in 1996-97 to 70,000 in 2004-05.
After Housing Costs - In 2004-05, 17% of pensioners living as a couple were in relative low income households. This compares to 13% of single pensioners. The number of pensioner couples in relative low income households has decreased by 25% from 120,000 in 1996-97 to 90,000 in 2004-05. By comparison the number of single pensioners in relative low income households has decreased by 64% from 140,000 in 1996-97 to 50,000 in 2004-05.
Source: Households Below Average Income ( HBAI), Department of Work and Pensions
Note: 1. From 2002-03 onwards there has been a doubling of the Scottish sample, therefore estimates from 2002-03 onwards should be less prone to fluctuation.
Publication
Income and Benefits Statistics for Scotland http://www.scotland.gov.uk/topics/statistics/18968/15950
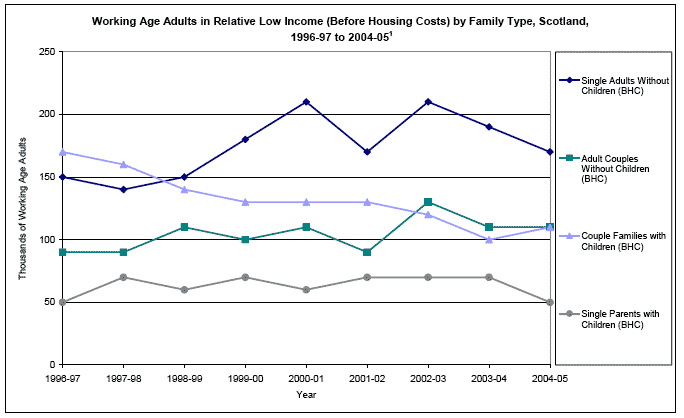
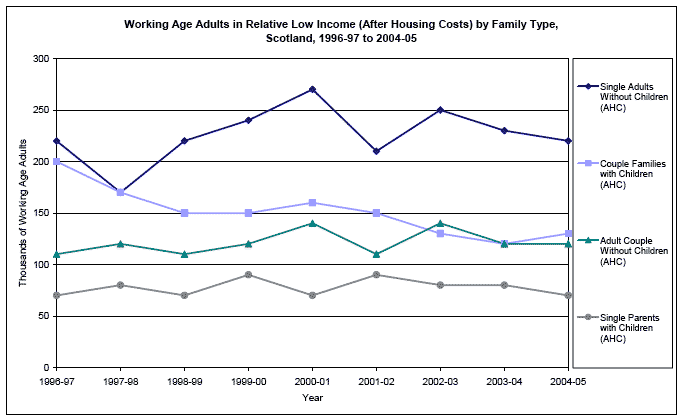
Individuals in Relative Low Income: Family Type & Age (Working Age Adults)
Relative low income is a measure of whether those in the lowest income households are keeping pace with the growth of income in the economy as a whole.
Lone parents with children are more likely to live in relative low income households than single adults or adult couples with or without children.
Before Housing Costs - In 2004-05, 18% of single adults without children are in relative low income households. This compares to 10% of adults living as a couple without children, 13% of adults living as a couple with children and 30% of single parents with children.
The number of single parents with children in relative low income households was 50,000 in 1996-97 and 2004-05. By comparison, the number of adults living as a couple with children in relative low income has decrease by 35% from 170,000 in 1996-97 to 110,000 in 2004-05.
After Housing Costs - In 2004-05, 23% of single adults without children are in relative low income households. This compares to 15% of adults living as a couple with children, 11% of adults living as a couple without children and 39% of single parents with children.
The number of single parents with children in relative low income households was 70,000 in 1996-97 and 2004-05. By comparison, the number of adults living as a couple with children in relative low income decreased by 35% from 200,000 in 1996-97 to 130,000 in 2004-05.
Source: Households Below Average Income ( HBAI), Department of Work and Pensions
Note: 1. From 2002-03 onwards there has been a doubling of the Scottish sample, therefore estimates from 2002-03 onwards should be less prone to fluctuation.
Publication
Income and Benefits Statistics for Scotland http://www.scotland.gov.uk/topics/statistics/18968/15950
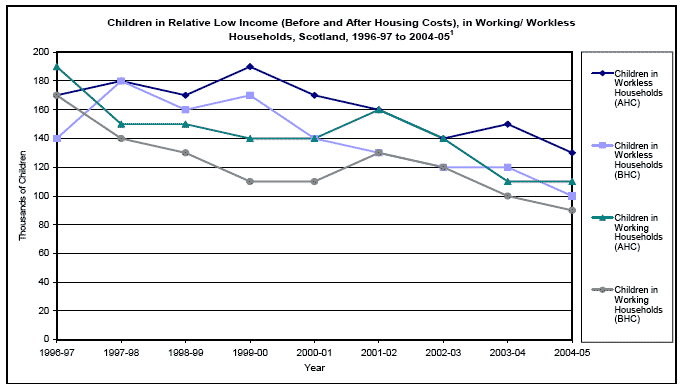
Individuals in Relative Low Income: Household Employment Status: Age (Children)
Relative low income is a measure of whether those in the lowest income households are keeping pace with the growth of income in the economy as a whole.
Children in workless households i.e. households with no income generated through employment, are more likely to live in relative low income than those in working households.
Before Housing Costs - In 2004-05, 58% of children in workless households are in relative low income. This compares to 11% of children in working households.
The number of children in workless households in relative low income has decreased by 29% from 140,000 in 1996-97 to 100,000 in 2004-05. By comparison, the number of children in working households in relative low income has decreased by 47% from 170,000 in 1996-97 to 90,000 in 2004-05.
After Housing Costs - In 2004-05, 72% of children in workless households are in relative low income. This compares to 13% of children in working households.
The number of children in workless households in relative low income has decreased by 24% from 170,000 in 1996-97 to 130,000 in 2004-05. By comparison, the number of children in working households in relative low income has decreased by 42% from 190,000 in 1996-97 to 110,000 in 2004-05.
Source: Households Below Average Income ( HBAI), Department of Work and Pensions
Note: 1. From 2002-03 onwards there has been a doubling of the Scottish sample, therefore estimates from 2002-03 onwards should be less prone to fluctuation.
Publication
Income and Benefits Statistics for Scotland http://www.scotland.gov.uk/topics/statistics/18968/15950
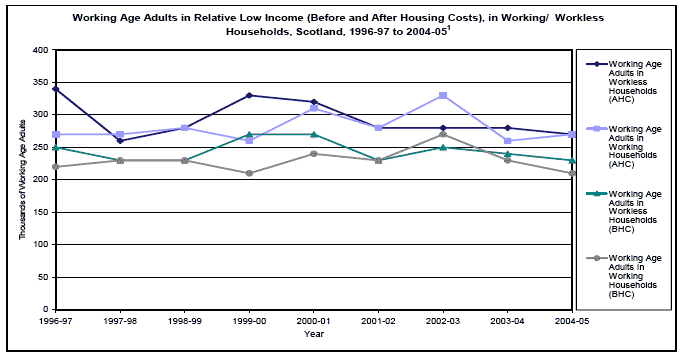
Individuals in Relative Low Income: Household Employment Status: Age (Working Age Adults)
Relative low income is a measure of whether those in the lowest income households are keeping pace with the growth of income in the economy as a whole.
Adults in workless households i.e. households with no income generated through employment, are more likely to be in relative low income than adults in working households.
Before Housing Costs - In 2004-05, 53% of working age adults in workless households are in relative low income. This compares to 8% of adults in working households.
The number of working age adults in workless households in relative low income decreased by 8% from 250,000 in 1996-97 to 230,000 in 2004-05. By comparison, the number of working age adults in working households in relative low income decreased by 5% from 220,000 in 1996-97 to 210,00 in 2004-05.
After Housing Costs - In 2004-05, 61% of working age adults in workless households are in relative low income. This compares to 10% of adults in working households.
The number of working age adults in workless households in relative low income decreased by 21% from 340,000 in 1996-97 to 270,000 in 2004-05. By comparison, the number of working age adults in working households in relative low income was 270,000 in 1996-97 and 2004-05.
Source: Households Below Average Income ( HBAI), Department of Work and Pensions
Note: 1. From 2002-03 onwards there has been a doubling of the Scottish sample, therefore estimates from 2002-03 onwards should be less prone to fluctuation.
Publication
Income and Benefits Statistics for Scotland http://www.scotland.gov.uk/topics/statistics/18968/15950
Individuals in Relative Low Income: Gender & Age (All Adults)
Relative low income is a measure of whether those in the lowest income households are keeping pace with the growth of income in the economy as a whole.
There is relatively little difference in the proportion of males and females living in low income households. However over the past decade, the number of females living in relative low income households has decreased more rapidly than for males.
Before Housing Costs - In 2004-05, 16% of all females live in relative low income households and this compares to 15% of males. The number of males in relative low income households has fallen by 10% from 310,000 in 1996-97 to 280,000 in 2004-05. The number of females in relative low income households has fallen by 13% from 380,000 to 330,000 during this period.
After Housing Costs - In 2004-05, 17% of both females and males live in relative low income households. The number of males in relative low income households has fallen by 16% from 380,000 in 1996-97 to 320,000 in 2004-05. The number of females in relative low income households has fallen by 25% from 480,000 to 360,000 during this period.
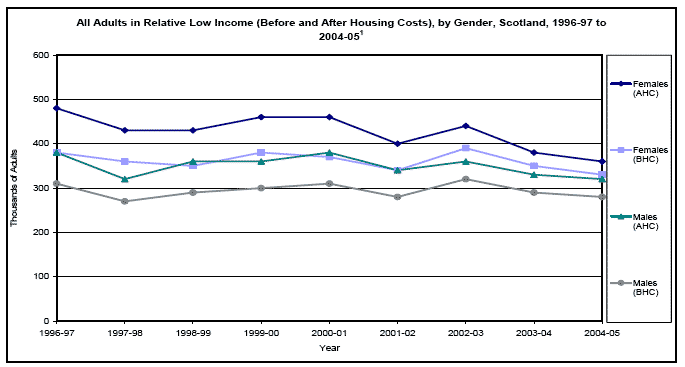
Source: Households Below Average Income ( HBAI), Department of Work and Pensions
Note: 1. From 2002-03 onwards there has been a doubling of the Scottish sample, therefore estimates from 2002-03 onwards should be less prone to fluctuation.
Publication
Social Focus on Women and Men 2002 http://www.scotland.gov.uk/stats/sfwm/docs/sfwm-00.asp
Web Link
Income and Benefits Statistics for Scotland http://www.scotland.gov.uk/topics/statistics/18968/15950
Individuals in Relative Low Income: Gender & Age (Pensioners)
Relative low income is a measure of whether those in the lowest income households are keeping pace with the growth of income in the economy as a whole.
There is relatively little difference in the proportion of male and female pensioners living in relative low income. However over the past decade the number of female pensioners living in relative low income has decreased more markedly than for males.
Before Housing Costs -In 2004-05, 18% of both male and female pensioners live in relative low income households. The number of female pensioners living in relative low income has decreased by 27% from 150,000 in 1996-97 to 110,000 in 2004-05. By comparison, the number of male pensioners living in relative low income has decreased by 14% from 70,000 in 1996-97 to 60,000 in 2004-05
After Housing Costs -In 2004-05, 16% of female pensioners live in relative low income households. This compares to 15% of male pensioners. The number of female pensioners living in relative low income has decreased by 53% from 190,000 in 1996-97 to 90,000 in 2004-05. By comparison, the number of male pensioners living in relative low income has decreased by 29% from 70,000 in 1996-97 to 50,000 in 2004-05
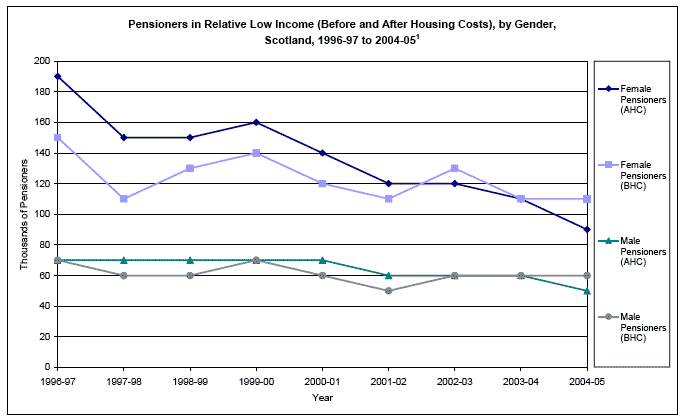
Source: Households Below Average Income ( HBAI), Department of Work and Pensions
Note: 1. From 2002-03 onwards there has been a doubling of the Scottish sample, therefore estimates from 2002-03 onwards should be less prone to fluctuation.
Web Link
Income and Benefits Statistics for Scotland http://www.scotland.gov.uk/topics/statistics/18968/15950
Individuals in Relative Low Income: Age & Disability
Before Housing Costs
In 2004-05, just under a quarter (22%) of all individuals living in households with at least one disabled adult or disabled child were living in relative low income, compared to 14% of those in households with no disabled adults or disabled children.
In 2004-05, 26% of all children living in households with at least one disabled adult or disabled child were living in relative low income, compared to 17% of those in households with no disabled adults or disabled children.
In 2004-05, 25% of all working-age adults living in households with at least one disabled adult or disabled child were living in relative low income, compared to 12% of those living in households with no disabled adults or disabled children.
In 2004-05, 17% of all pensioners living in households with at least one disabled adult or disabled child were living in relative low income, compared to 20% of those living in households with no disabled adults or disabled children.
After Housing Costs
In 2004-05, just under a quarter (24%) of all individuals living in households with at least one disabled adult or disabled child were living in relative low income, compared to 16% of those in households with no disabled adults or disabled children.
In 2004-05, 32% of all children living in households with at least one disabled adult or disabled child were living in relative low income, compared to 20% of those in households with no disabled adults or disabled children.
In 2004-05, 30% of all working-age adults living in households with at least one disabled adult or disabled child were living in relative low income, compared to 14% of those living in households with no disabled adults or disabled children.
In 2004-05, 14% of all pensioners living in households with at least one disabled adult or disabled child were living in relative low income, compared to 17% of those living in households with no disabled adults or disabled children.
Source: Households Below Average Income ( HBAI), Department of Work and Pensions
Publications
Social Focus on Disability 2004 http://www.scotland.gov.uk/Publications/2004/08/19818/41697
Income and Benefits Statistics for Scotland http://www.scotland.gov.uk/topics/statistics/18968/15950
Individuals in Relative Low Income: Ethnic Group
Relative low income is a measure of whether those in the lowest income households are keeping pace with the growth of income in the economy as a whole.
Before Housing Costs - In 2004-05, 25% of all individuals living in households headed by an adult from a minority ethnic group were living in relative low income households, compared to 16% of those living in households headed by an adult from a white ethnic group.
After Housing Costs - In 2004-05, 29% of all individuals living in households headed by an adult from a minority ethnic group were living in relative low income households, compared to 18% of those living in households headed by an adult from a white ethnic group.
Source: Households Below Average Income ( HBAI), Department of Work and Pensions
Publications
Analysis of Ethnicity in the 2001 Census - Summary Report http://www.scotland.gov.uk7ff5ee0f-3801-4607-b42e-2fbe7a66bf2d
Income and Benefits Statistics for Scotland http://www.scotland.gov.uk/topics/statistics/18968/15950
Deprived Areas
The Scottish Index of Multiple Deprivation ( SIMD) is the Scottish Executive's official measure for identifying small area concentrations of multiple deprivation across all of Scotland. Detailed information about how the SIMD is constructed can be found on the web site referenced below.
Deprived Areas: Gender
The following data are based on the Scottish Index of Multiple Deprivation ( SIMD) 2006.
Scotland's 2001 Census day population was 5,062,011, of whom almost 780,000 (15.3%) live in the 15% most deprived areas across Scotland. Of all females, 412,218 (15.7%) live in the 15% most deprived areas, compared to 363,999 (15.0%) of all males.
Scottish Population, by Sex, Residing in the 15% Most Deprived Areas and Rest of Scotland, 2001
Numbers, Column Percentages
All People |
Males |
Females |
||||
|---|---|---|---|---|---|---|
Number |
% |
Number |
% |
Number |
% |
|
15% Most Deprived Areas |
776,217 |
15.3 |
363,999 |
15.0 |
412,218 |
15.7 |
Rest of Scotland |
4,285,794 |
84.7 |
2,068,495 |
85.0 |
2,217,299 |
84.3 |
Scotland |
5,062,011 |
100.0 |
2,432,494 |
100.0 |
2,629,517 |
100.0 |
Source: Population data - General Register Office for Scotland ( GROS), 2001 Census
Deprived areas data - Scottish Index of Multiple Deprivation ( SIMD) 2006
Publications
Social Focus on Women and Men 2002 http://www.scotland.gov.uk/stats/sfwm/docs/sfwm-00.asp
Social Focus on Deprived Areas 2005 http://www.scotland.gov.uk/SocialFocusOnDeprivedAreas
Web Link
Scottish Index of Multiple Deprivation ( SIMD) http://www.scotland.gov.uk/SIMD
Deprived Areas: Age & Gender
The data used in the following analysis are based on the Scottish Index of Multiple Deprivation ( SIMD) 2006.
Overall in Scotland there are 93 males for every 100 females. This is not surprising given that female life expectancy is higher than that of males. However, there are differences in the sex ratios for the younger age groups for the 15% most deprived areas compared to the rest of Scotland; in particular there are higher proportions of females in the 20 to 44 and 65 to 89 age groups living in the 15% most deprived areas. The proportion of lone parents living in the most deprived areas is one factor explaining the dip in the sex ratio in the 20 to 44 age groups, while premature mortality among males is a factor in the 65 to 89 age groups. Understanding other factors would need further analysis. The Census shows that 93% of all lone parent households (with dependent children) in the 10% most deprived areas are female lone parent households compared with 88% in the 10% least deprived areas.
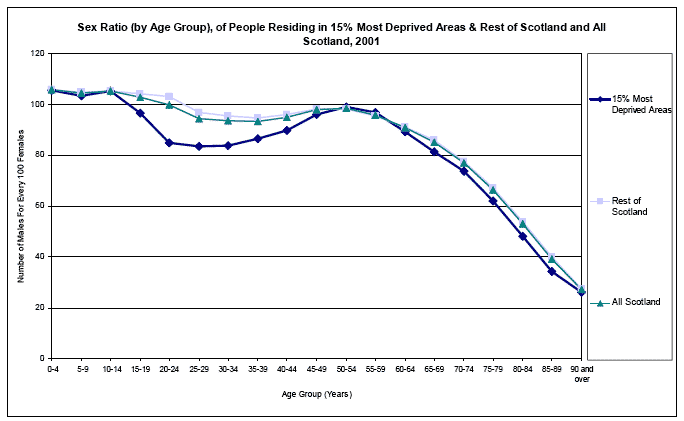
Source: Age & sex data -General Register Office for Scotland ( GROS), 2001 Census
Deprived area data - Scottish Index of Multiple Deprivation ( SIMD) 2006
Publications
Social Focus on Women and Men 2002 http://www.scotland.gov.uk/stats/sfwm/docs/sfwm-00.asp
Social Focus on Deprived Areas 2005 http://www.scotland.gov.uk/SocialFocusOnDeprivedAreas
Web Link
Scottish Index of Multiple Deprivation ( SIMD) http://www.scotland.gov.uk/SIMD
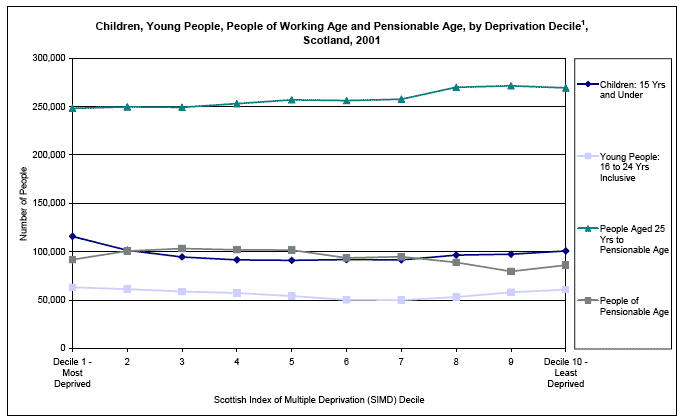
Deprived Areas: Age
The data used in the following analysis are based on the Scottish Index of Multiple Deprivation ( SIMD) 2006.
There are some differences in the age structure across deprived areas, particularly for children.
Looking at the spread of children across deprived areas, there are high numbers in the most deprived areas (deciles 1 and 2) but a high number also reside in the least deprived areas (decile 10).
The spread of young people aged 16 to 24 years dips in deciles 6, 7 & 8 which tend to be the more rural areas.
There are relatively more people aged 25 years to pensionable age in the less deprived areas. Pensioners are less likely than average to live in either the most or least deprived areas which tend to be more urban areas.
Source: Age Data - General Register Office for Scotland ( GROS), 2001 Census
Deprived Areas Data - Scottish Index of Multiple Deprivation ( SIMD) 2006
Note: 1. In this instance, a decile refers to Scotland divided into 10% portions.
Publication
Social Focus on Deprived Areas 2005 http://www.scotland.gov.uk/SocialFocusOnDeprivedAreas
Web Link
Scottish Index of Multiple Deprivation ( SIMD) http://www.scotland.gov.uk/SIMD
Deprived Areas: Ethnic Group
The data used in the following analysis are based on the Scottish Index of Multiple Deprivation ( SIMD) 2006.
The 2001 Census shows that there are just over 100,000 people describing themselves as from minority ethnic groups in Scotland. This equates to some 2% of the population. Analysing the minority ethnic backgrounds of people by the Scottish Index of Multiple Deprivation is not straightforward. Whilst differing levels of deprivation and poverty are a major factor, results should be considered in the context of small populations, differing concentrations in large urban areas (where there are more deprived areas) and other factors such as the age structure of different groups, family composition and housing tenure.
The analysis shows that people describing themselves as belonging to groups including Other White British, Other White, Indian and Chinese are more likely to live in the least deprived deciles. People describing themselves as belonging to the following groups; Other South Asian, African and Black Scottish or Other Black have higher than average proportions of their population living the most deprived deciles.
Ethnic Group 1 by Deprivation Decile 2, Scotland, 2001
Numbers & Row Percentages
Ethnic Group |
Population |
Decile 1 (Most Deprived) |
Decile 2 |
Decile 3 |
Decile 4 |
Decile 5 |
Decile 6 |
Decile 7 |
Decile 8 |
Decile 9 |
Decile 10 (Least Deprived) |
|---|---|---|---|---|---|---|---|---|---|---|---|
White Scottish |
4,459,071 |
11 |
11 |
10 |
10 |
10 |
10 |
10 |
10 |
10 |
9 |
Other White British |
373,685 |
4 |
5 |
6 |
7 |
10 |
12 |
13 |
14 |
14 |
16 |
White Irish |
49,428 |
12 |
10 |
11 |
10 |
9 |
8 |
8 |
10 |
10 |
12 |
Other White |
78,150 |
6 |
6 |
7 |
8 |
9 |
9 |
10 |
12 |
13 |
19 |
Indian |
15,037 |
5 |
6 |
8 |
8 |
7 |
7 |
9 |
13 |
17 |
19 |
Pakistani |
31,793 |
9 |
8 |
12 |
16 |
7 |
8 |
8 |
9 |
11 |
12 |
Bangladeshi |
1,981 |
10 |
11 |
11 |
8 |
9 |
5 |
9 |
12 |
13 |
12 |
Other South Asian |
6,196 |
14 |
12 |
8 |
7 |
7 |
6 |
7 |
11 |
11 |
16 |
Chinese |
16,310 |
7 |
7 |
7 |
7 |
8 |
8 |
8 |
12 |
15 |
21 |
Caribbean |
1,778 |
11 |
9 |
11 |
8 |
9 |
9 |
9 |
10 |
10 |
13 |
African |
5,118 |
18 |
13 |
9 |
9 |
7 |
8 |
6 |
8 |
8 |
14 |
Black Scottish or Other Black Background |
1,129 |
19 |
12 |
12 |
10 |
8 |
7 |
7 |
8 |
9 |
10 |
Other Ethnic Background |
9,571 |
11 |
9 |
8 |
8 |
7 |
8 |
8 |
11 |
13 |
18 |
Any Mixed Background |
12,764 |
11 |
9 |
10 |
9 |
9 |
8 |
8 |
11 |
11 |
15 |
All People |
5,062,011 |
10 |
10 |
10 |
10 |
10 |
10 |
10 |
10 |
10 |
10 |
Source: Ethnic group data - General Register Office for Scotland ( GROS), 2001 Census Deprived areas data - Scottish Index of Multiple Deprivation ( SIMD) 2006
Notes: 1. Some cells are based on counts of less than 100.
2. In this instance a decile refers to Scotland divided in 10% portions.
Publications
Analysis of Ethnicity in the 2001 Census - Summary Report http://www.scotland.gov.uk7ff5ee0f-3801-4607-b42e-2fbe7a66bf2d
Social Focus on Deprived Areas 2005 http://www.scotland.gov.uk/SocialFocusOnDeprivedAreas
Web Link
Scottish Index of Multiple Deprivation ( SIMD) http://www.scotland.gov.uk/SIMD
Definitions of Income
Individual and Household Income
Individual income measures income that has been accrued to all adult men and women either directly or in their own right. Individual income estimates do not however, provide a means of comparing living standards of women and men as it does not take into account the extent to which members of a household share their incomes or resources with other household members. In order to estimate living standards we therefore use 'household income' which has to be adjusted or 'equivalised' to compare households that vary in size and composition. The median is most commonly used to represent average income due to the highly skewed nature of the income distribution, which leads to the very high incomes of a few having a disproportionate impact on the mean.
Individual Income Definitions
Total individual income: equal to gross income, defined as income from all sources received by an individual, plus tax credits.
Net individual income (as used in this chapter): income from all sources received by an individual net of income tax and National Insurance contributions.
Disposable individual income: includes Housing Benefit, Council Tax Benefit and property income from letting and sub-letting (apportioned across household adults where appropriate), and deducts National Insurance contributions, income tax payments, childcare costs, travel to work costs, parental contributions to students living away from home, maintenance and child support payments (which are deducted from the income of the person making the payment), and housing costs (including Council Tax, all costs apportioned across household adults where appropriate).
Household Income Definitions
Total household income: total income from all sources including from Tax Credits, before deductions of income tax and National Insurance.
Net household income: total income after deductions for income tax and National Insurance contributions.
Net disposable household income: total income after deductions for income tax, National Insurance Contributions, council tax, pension contributions and maintenance payments.
Equivalised net disposable household income (as used in this chapter): 'Equivalised' income is used to allow comparisons of living standards between different household types. Income is adjusted to take into account variations in the size and composition of the household. This adjustment reflects the fact that a family of several people requires a higher income than a single person in order for both households to enjoy a comparable standard of living. The key assumption is that all individuals in the household benefit equally from the combined (equivalised) income of the household. There are several different equivalence scales. The household income estimates contained in this chapter use the McClements equivalisation scale. There are distinct equivalence scales used for income before housing costs ( BHC) and income after housing costs ( AHC).
Before housing costs: Net disposable income, equivalised using the before housing costs equivalisation scale. Certain incomes in kind are included such as free school meals and TV licenses for over 75s.
After housing costs: Net disposable income with income as for BHC but with rent/mortgage payments, water charges, structural insurance premiums, ground rent and service charges deducted. This is equivalised using the after housing costs equivalisation scale.
Relative low income (as used in this chapter): Individuals living in households whose equivalised income is below 60% of GB median income in the same year.
Definitions of Age
The data reported in this chapter refer to working age adults and pensioners. Working age adults is defined as females aged 16 to 59 years and males aged 16 to 64 years. Pensioners refers to females aged 60 and over and males aged 65 and over.
Publications
For further information on income definitions and sources of income see the 'Guide To Income Statistics', Scottish Economic Statistics 2004 http://www.scotland.gov.uk/library5/finance/ses04-00.asp.
For further information on individual incomes see 'Individual Incomes of Men and Women 1996/97 to 2004/05 http://www.womenandequalityunit.gov.uk/indiv_incomes/index.htm
There is a problem
Thanks for your feedback